AVAILABILITY IN BAMBOO-BASED AGROFORESTRY
IN LOMBOK TIMUR DISTRICT
Cecep Handoko
Received : 3 February 2012, Accepted : 12 October 2012
Bamboo-based agroforestry is suitable for soils which are poor in nutrient. The characteristics of bamboo and the rapid closure of its canopy improve soil cover, soil nutrient availability and soil moisture content, and prevent erosion by reducing surface runoff. The research was aimed at determining the factors that influenced surface runoff and the availability of soil organic matter (SOM) in the bamboo-based agroforestry in East Lombok.Research was done from March 2010 to March 2011 in Lenek Daya village, Aikmel sub-district, East Lombok district. The research plots were located on slopes of 0-15 , 30-45 , and 45-65 ; with bamboo canopy closures of 0-25%, 25-50%, 50-75%, and over 75%. The research involving 12 plots, each in 4 x 12 m size. Measurements included surface runoff, bamboo canopy closure, weeds and bamboo leaves litter weight, rainfall depth and duration, dissolved sediment, and soil physical and chemical properties as well as SOM. Correlation and multiple linear regression tests were used in data analysis. The results of the regression tests showed a change in surface runoff which was influenced by changes in bamboo canopy closure, rain duration, rain intensity and soil sand fraction, each by -0.019, 0.418, 0.049 and -0.065 respectively. Rain duration was the highest influencing variable, whereas bamboo canopy closure significantly decreased surface runoff. Bamboo canopy closure had no correlation with the increase of SOM. But, the increase of SOM had correlation with the increase of soil cation exchange capacity (CEC). The positive impact of bamboo canopy closure on Regosol soil fertility in bamboo-based agroforestry land was determined by land management intensity which could increase the availability of SOM and decrease phosphorus element loss due to leaching of nutrient.
Keywords: Agroforestry, bamboo, surface runoff, soil organic matter
1
o o o
ABSTRACT
I. INTRODUCTION
Critical land is the result of forest degradation, it has an adverse effect in the form of flash floods, landslides and reduced water resources in some areas at the Province of West Nusa Tenggara (Dinas Kehutanan NTB, 2009). Moreover, it leads to the deficit of water availability in the two of three watersheds in Lombok island (West Nusa Tenggara), Dodokan and Menanga, i.e. -2,156.89 and -258.15 million m respectively. In addition to the deficit of water availability, the highly porous young soil type (Regosol) in most areas of the
3
island of Lombok presents an obstacle to the successful cultivation of crops.
Bamboo populations are widely spread over the island of Lombok, it reaches an area of 2,365 ha with a potential of 4.257 million rods (Markum , 2007 In East Lombok, particularly in research sites, bamboo is planted along the boundaries, in rows or in a specified part of the land, separated from agricultural crops. These are different bamboo plantation types, which form agroforestry patterns and have been developed for generations. Farmers argue that the presence of bamboo closure in the cultivation land reduces the productivity of agricultural crops. However, bamboo is planted because it is able to grow on limited water resources, it is easy to cultivate, it
et al. ).
1
yields continuous harvest and its marketable (Handoko, 2009).
Dry land farming systems by small farmers is the agricultural base in Nusa Tenggara. Agroforestry in Nusa Tenggara is generally developed on barren and small land (0.25 to 1 ha) under the ownership of individual farmers (Roshetko ., 2001). Bamboo plantation is ecologically capable of accelerating the canopy closure of degraded lands, improving nutrient availability and reducing runoff (Nath ., 2009). Productivity of agricultural crops will be low in the presence of bamboo (Divakara , 2001), and Nath . (2009) states that it can be overcome with proper management.
The study was to determine factors that influenced the surface runoff and the availability of soil organic matter in the bamboo-based agroforestry in East Lombok. The research was expected to provide information about the influence of the land productivity in the bamboo-based agroforestry sites in accordance with the land management characteristics of the farmers.
et al
et al
et al. et al
II. MATERIALS AND METHODS
A. Site Description
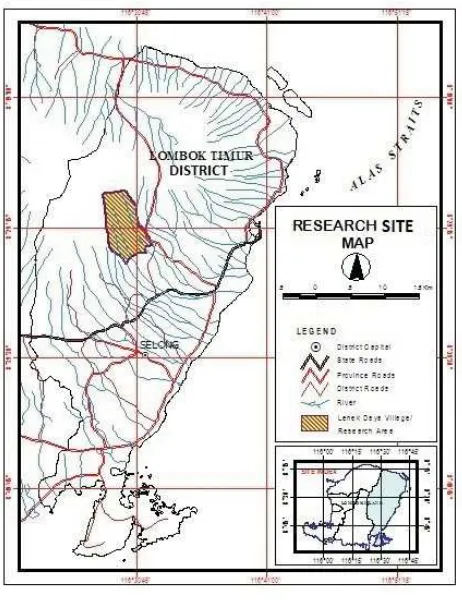
The research period was from March 2010 to March 2011. It was conducted in the village of Lenek Daya, Aikmel Sub-district, East Lombok District. The village was located in the Menanga watershed and was directly adjacent to the forest of Rinjani National Park. The altitude is 200-400 m above sea level with sloping area. Its soil type was Regosol and it had no technical irrigation (dry land agriculture). The dry land agriculture in the area was dominated by bamboo plantation which was distributed almost evenly throughout the village. Bamboo was commonly planted separated from the agricultural crops.
For generations, farmers have planted crops in combination with bamboo. Planting bamboo is primarily aimed to get an additional income especially from unproductive land. Slope and soil fertility is an important factor for farmers in determining the pattern of planting bamboo in
combination with crops. Especially on sloping land with low fertility, bamboo canopy closure was dominated. Meanwhile, in more flat and productive land, bamboo canopy rarely closured and was planted as a hedge plant. Cropping pattern of farmers has resulted in land unit management based on similar slopes and bamboo canopy cover. The groups were in accordance with the need of the research (Figure 1).
The study was conducted through: (1) interview; (2) preparation of surface runoff plots; and (3) measurements in the plots, including: surface runoff, bamboo canopy closure, rainfall depth and duration, dissolved sediment, SOM and soil physical and chemical properties.
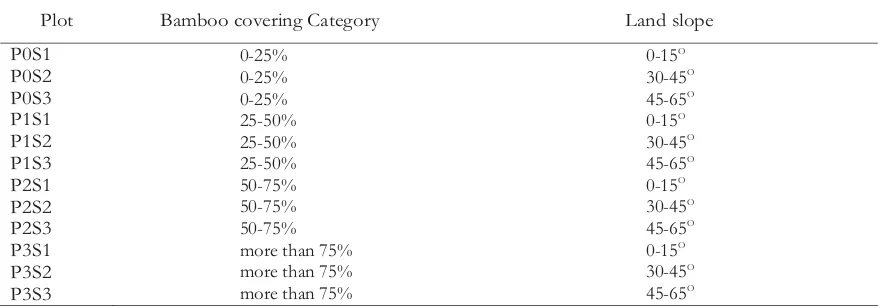
Twenty three farmers who cultivate bamboo in their agricultural land were interviewed purposively. The main objective of the interview was to obtain information on their land cultivation techniques. Based on the interview, as many as twelve land units were selected and surface runoff plot was placed in each land unit. The surface runoff plots of 4m x 12m (Hudson, 1993) were established on three ranges of slopes that represented the distribution of bamboo-based agroforestry in the area, namely: 0-15 , 30-45 and 30-45-65 . On each slope, four plots were established, each with bamboo cover of 0-25%, 25-50%, 50-75% and >75%. The numbering of the twelve plots was based on the bamboo canopy cover and the degree of slope, starting from the lowest to the highest, categorized: P0S1, P0S2, P0S3, P1S1, P1S2, P1S3, P2S1, P2S2, P2S3, P3S1, P3S2 and P3S3 (Table 1). Meanwhile, the studied B. Methods
o
o o
species of bamboo was bamboo apus ( Kurz), while the type of soil was Regosol Surface runoff measurements were performed in each event of rain during the rainy season (five months of observation). While the dissolved sediment measurements were performed three times at the peak of rainfall and soil characteristics measurements were conducted with three replicates. The laboratory analysis was performed to define the characteristics of soil physical properties and particularly its chemical properties. Data were analysed through: (1) correlation analysis; (2) multiple linear regression analysis of the three response variables (Y): surface runoff, soil organic matter, and dissolved sediment, including: (a). predictors (X) selection through a stepwise approach (based on the highest value of R-square), (b). regression model testing, including checking for outliers, error and multicollinearity; and (c). estimat
generalized estimating equation (GEE) (Stokes , 2001) was used exclusively for surface runoff; and (3) analysis of variance of surface runoff between plots using Tukey's HSD (Honestly Significant Difference) test at 95% confidence level.
The specified multiple linear regression model (Freund, Wilson and Sa, 2006) is as follow:
is the dependent variable (response). = 1, 2, . . ., , represent different independent variables (predictors). is the intercept (value when all the independent variables are 0). = 1, 2, . . . , , represent the corresponding regression coefficients. is the random error (usually assumed Gigantochloa
ing regression parameters (β),
j
Table 1. Plot category Plot
Bamboo covering Category Land slope
0-25% 0-15
more than 75% 0-15
more than 75% 30-45
more than 75% 45-65
to be normally distributed with mean zero and variance ).
Based on Equation 1 and Table 2, which were used to find factors that influence the surface runoff, the basic linear regression equation for surface runoff was set, as follows:
response (y) was surface runoff. was intercept. were the corresponding of seven regression coefficients for: rain intensity (I rain), rain duration (T rain), slope (Slope), bamboo canopy closure (L closure), soil sand fraction (F sand), weight of weeds (Weeds), and effective plot catchment (E plot) was random error.
σ2
β β
0 1-7
--
-The availability of SOM is influenced by its constituent materials and the factors that influence the decomposition process, such as water availability (soil moisture) and soil pH. Meanwhile, the loss of nutrients is associated closely with the surface runoff, SOM availability and soil fertility (Buckman and Brady, 1982). Based on these statements, the basic linear regression equation for the availability of soil organic matter was set, as follows:
response (y) was soil organic matter. was intercept. were the corresponding of five
β β
0 1-5
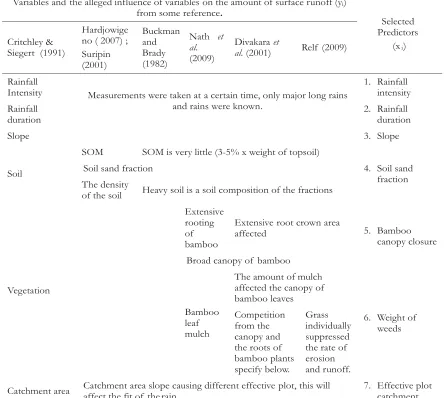
Table 2. Identification of variables that affect the amount of surface runoff Variables and the alleged influence of variables on the amount of surface runoff (yi)
from some reference.
Selected Predictors
(xi)
Critchley & Siegert (1991)
Hardjowige no ( 2007) ; Suripin (2001)
Buckman and Brady (1982)
Nath et al.
(2009)
Divakaraet
al.(2001) Relf (2009)
Rainfall
Intensity Measurements were taken at a certain time, only major long rains and rains were known.
1. Rainfall intensity
Rainfall duration
2. Rainfall duration
Slope 3. Slope
Soil
SOM SOM is very little (3-5% x weight of topsoil)
4. Soil sand fraction Soil sand fraction
The density
of the soil Heavy soil is a soil composition of the fractions
Vegetation
Extensive rooting of bamboo
Extensive root crown area
affected 5. Bamboo
canopy closure
Broad canopy of bamboo
Bamboo leaf mulch
The amount of mulch affected the canopy of bamboo leaves
6. Weight of weeds Competition
from the canopy and the roots of bamboo plants specify below.
Grass individually suppressed the rate of erosion and runoff.
Catchment area Catchment area slope causing different effective plot, this will affect the fit of the rain.
7. Effective plot catchment
-
-...(2)
regression coefficients for: soil dust fraction (F-dust), soil sand fraction (F-sand), cation exchange capacity (CEC), soil acidity (pH), and bamboo canopy closure (L-closure). was random error.
The basic linear regression equation for soil nutrient loss (indicated by P element loss due to surface runoff) was set, as follows:
response (y) was was
Intercept. were the corresponding of three regression coefficients for: soil bulk volume (BV), surface runoff coefficient (RC), and soil organic matter (SOM) was random error.
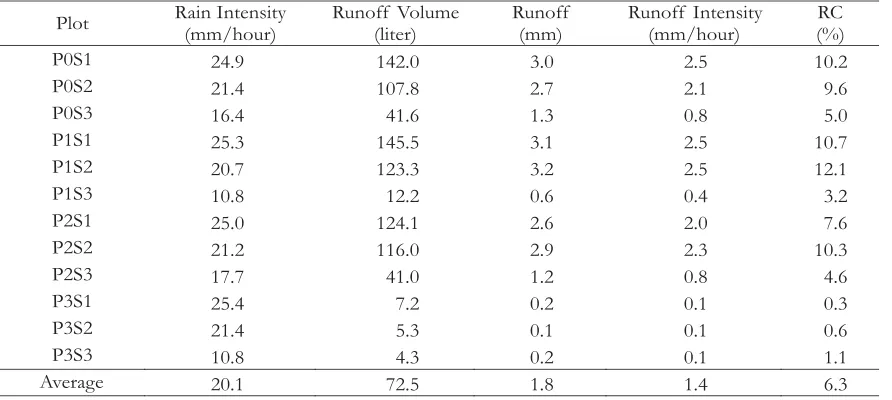
Table 3 shows hydrological characteristics per research plot. During the study, rainfall occurred as many as 90 times. The depth of the rain was from 1 - 75 mm with an average of 31.8 mm, while the rain duration from 0.3 to 3.7 hours with an average of 1.2 hours. The average runoff coefficient (RC) was 6.3%. Surface runoff ranged from 0.1 to 3.2 mm with an average of 1.8 mm, while the intensity of surface runoff ranged from 0.1 to 2.5 mm/hour with an average of 1.4 mm/hour. Meanwhile, rainfall intensity ranged
Phosphorus element loss. β β
0 1-3
III. RESULT AND DISCUSSION
A. Surface Runoff and Bamboo Canopy Closure
from 10.8 to 25.4 mm/hour with an average of 20.1 mm/hour.
Using the seven variables in Table 2, the correlation test to the corrected data (without outliers) indicated a high significant correlations (at 99% confidence level) between the intensity of surface runoff with the four variables: rain intensity (I-rain), rain duration (T-rain), bamboo canopy closure (L-closure), and soil sand fraction (F-sand), each of 0.65, 0.30, -0.58, and -0.59 respectively (Table 4).
In line with the results of the correlation test, the result of variable selection in Table 5 and the regression analysis in Table 6 suggested that only four variables make up the surface runoff regression model, namely the intensity of rainfall (I-rain), rain durations (T-rain), bamboo canopy closure (L-closure) and soil sand fraction (F-sand).
As shown in Table 4, there is a high and significant correlation between the slope and the sand fraction (correlation 0.82, significant at the 99% confidence level), and between the two variables (slope and sand fractions) with the intensity of surface runoff (correlation of -0.54 and -0.59 respectively, both significant at 99% significant level). Based on the results of the regression test, the use of soil sand fraction as variable affecting the intensity change of the surface runoff was suitable than use of the slope.
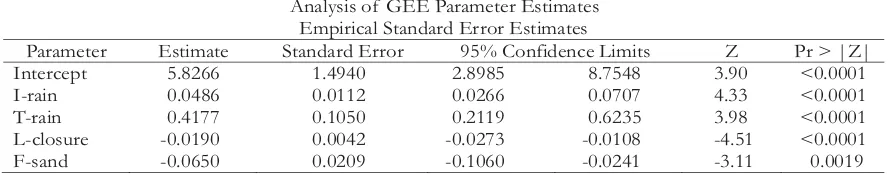
Based on Table 6, it can be concluded that the increase and decrease of rain duration (T-rain) had the greatest influence (the value of the parameter estimates is 0.42) on the increase and decrease the
Table 3. Average hydrological characteristics per plot
Plot Rain Intensity
(mm/hour)
Runoff Volume (liter)
Runoff (mm)
Runoff Intensity (mm/hour)
RC (%)
P0S1 24.9 142.0 3.0 2.5 10.2
P0S2 21.4 107.8 2.7 2.1 9.6
P0S3 16.4 41.6 1.3 0.8 5.0
P1S1 25.3 145.5 3.1 2.5 10.7
P1S2 20.7 123.3 3.2 2.5 12.1
P1S3 10.8 12.2 0.6 0.4 3.2
P2S1 25.0 124.1 2.6 2.0 7.6
P2S2 21.2 116.0 2.9 2.3 10.3
P2S3 17.7 41.0 1.2 0.8 4.6
P3S1 25.4 7.2 0.2 0.1 0.3
P3S2 21.4 5.3 0.1 0.1 0.6
P3S3 10.8 4.3 0.2 0.1 1.1
Average 20.1 72.5 1.8 1.4 6.3
Table 4. Results of the correlation test between the variables on surface runoff
Pearson Correlation Coefficients, N = 653 Prob > |r| under H0: Rho=0
S-runoff I-rain T-rain L-closure F-sand S-lope
S-runoff 1.0000 0.6519
<0.0001*
Significant at 99% confidence level
Table 5. Variable selection using stepwise selection
R-Square Selection Method
Number in Model R-Square Variables in Model
1
I-rain F-sand L-closure I-rain T-rain L-closure T-rain F-sand L-closure I-rain T-rain F-sand
4 0.7362 I-rain T-rain F-sand L-closure
Table 6. Estimated regression parameters (β) of surface runoff using the GEE Analysis of GEE Parameter Estimates
Empirical Standard Error Estimates
Parameter Estimate Standard Error 95% Confidence Limits Z Pr > |Z|
Intercept 5.8266 1.4940 2.8985 8.7548 3.90 <0.0001
I-rain 0.0486 0.0112 0.0266 0.0707 4.33 <0.0001
T-rain 0.4177 0.1050 0.2119 0.6235 3.98 <0.0001
L-closure -0.0190 0.0042 -0.0273 -0.0108 -4.51 <0.0001
F-sand -0.0650 0.0209 -0.1060 -0.0241 -3.11 0.0019
intensity of the surface runoff. Meanwhile, the estimated value of canopy closure parameter (L-closure) also showed a significant value (Pr > | Z | < 0.0001) of -0.019. Although its parameter estimate value was the smallest of the observed land characteristics and precipitation, the increase in bamboo canopy closure had significant
influence on the decrease of surface runoff by 0.019.
Table 7. Univariate analysis of runoff intensity data Tukey Grouping*
Variable: Surface runoff intensity
Means Plot
A 2.8490 P0S1
B A 2.5475 P1S1
B 2.3178 P0S2
C 1.5027 P2S1
C 1.4819 P2S2
C 1.4805 P1S2
D 0.4151 P2S3
D 0.3610 P1S3
D 0.3584 P0S3
D 0.0989 P3S3
D 0.0644 P3S2
D 0.0376 P3S1
* Means with the same letter are not significantly different
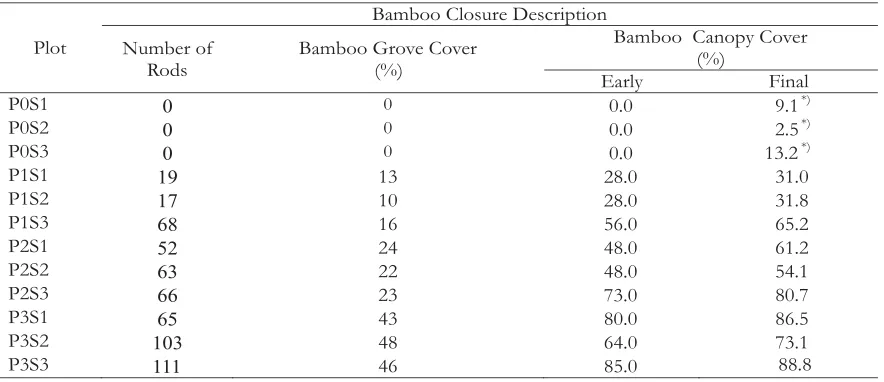
Table 8. Bamboo closure description at each plot
Plot
Bamboo Closure Description
Number of Rods
Bamboo Grove Cover (%)
Bamboo Canopy Cover (%)
Early Final
P0S1 0 0 0.0 9.1*)
P0S2 0 0 0.0 2.5*)
P0S3 0 0 0.0 13.2*)
P1S1 19 13 28.0 31.0
P1S2 17 10 28.0 31.8
P1S3 68 16 56.0 65.2
P2S1 52 24 48.0 61.2
P2S2 63 22 48.0 54.1
P2S3 66 23 73.0 80.7
P3S1 65 43 80.0 86.5
P3S2 103 48 64.0 73.1
P3S3 111 46 85.0 88.8
*)
Bamboo canopy shade from outside the plot
group with the lowest surface runoff intensity. These plots are: P2S3, P1S3, P0S3, P3S3, P3S2, and P3S1. These plots have a slope of more than 46 (or rather have sand fraction of more than 72%) and / or bamboo closure of more than 65% as shown in Table 8 and Table 9.
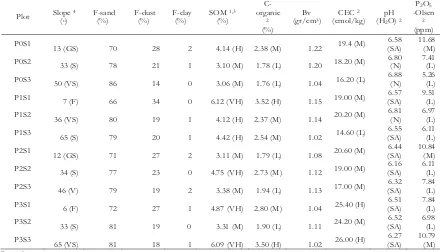
Table 9 shows the physical and chemical properties of soil at the research plots. The soil organic matter of the plot is medium to very high (3.06 - 6.12%), pH is slightly acidic to neutral (6.16-6.88), phosphorus availability is low to medium (5.26-11.68 ppm), sand fraction is high
o
B. Soil Organic Matter, Bamboo Canopy Closure and Regosol Soil Fertility
(66-86%) and the slope is flat to very steep (6-65 ). Due to the soil is highly porous (indicated by the high soil sand fraction of more than 60%) and the availability of soil nutrient of Phosphorus is low to medium, the soil fertility remains low. However, the availability of organic matter gives benefits to the soil. Buckman and Brady (1982) states that soil organic matter plays an important role in improving soil structure, providing nutrients for plants and increasing soil water availability.
Based on Table 10, there is no significant individually correlation between SOM with land variables including bamboo canopy closure. But, combined with two other variables: slope and soil dust fraction, it can be seen in Table 11 that the
Plot Slope4 Table 9. Physical and chemical properties of soil at the research plots
Table 10. Results of correlation test between the land variable on SOM Pearson Correlation Coefficients. N = 12
Prob > |r| under H0: Rho=0
SOM Slope F-dust F-sand CEC Ph L-closure
SOM 1.0000 -0.0245
0.9397
Significant at 95% confidence level Significant at 99% confidence level
CEC has a significant positive relation (parameter estimate is 0.15 and significant at 95% confident level) with SOM. Hardjowigeno (2007) stated that CEC is the soil chemistry that is closely related to soil fertility if the soil is dominated by base cations, Ca, Mg, K, Na (high base saturation) and
vice versa if it is dominated by acid cations, Al, H (low base saturation).
Bamboo leaf litter is hard to be degraded. O'Cornor . (2000) states that most part of bamboo leaves cannot be processed by microbes. Aside from its high value of C/N ratio, the leaves
et al
Remarks :
F = Flat, GS = Gently Sloping, S = Steep, VS = Very Steep; L = Low, M = Medium, H= High, VH= Very High; SA = Slightly Acidic, N = Neutral.
SOM = 1.74 x C-organic (Hardjowigeno, 2007);
Categorized according to Sulaeman, Suparto and Eviati (2005); Categorized according to Bolsa Analytical (2007);
Categorized according to the Decree of the Minister of Agriculture number 837/Kpts/Um/11/1980 and no. : 683/Kpts/Um/8/1981 1
Table 11. SOM regression parameter estimation using regression test Parameter Estimates
Variable DF Parameter
Estimate
Standard Error
t Value Pr > |t| Standardized
Estimate
Intercept 1 -7.08034 2.42162 -2.92 0.0192 0
Slope 1 0.06512 0.01735 3.75 0.0056 1.23525
F-dust 1 0.27192 0.06332 4.29 0.0026 1.38036
CEC 1 0.15112 0.05766 2.62 0.0306 0.49404
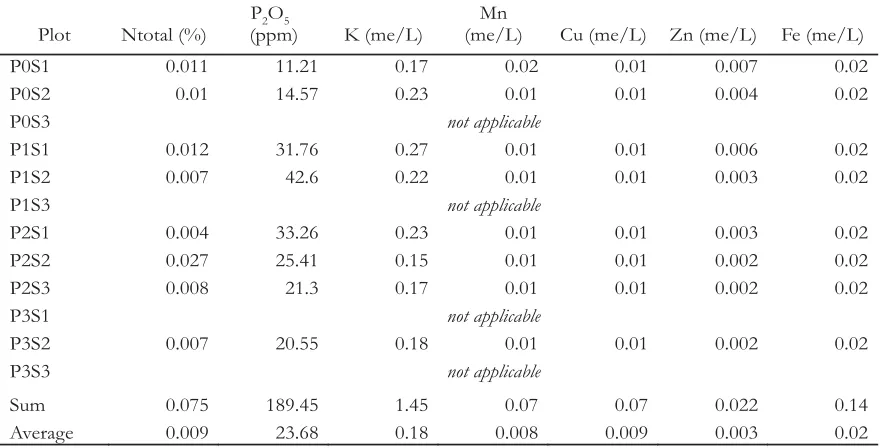
Table 12. Test results in the nutrient content of runoff water
Plot Ntotal (%)
P O2 5
(ppm) K (me/L)
Mn
(me/L) Cu (me/L) Zn (me/L) Fe (me/L)
P0S1 0.011 11.21 0.17 0.02 0.01 0.007 0.02
P0S2 0.01 14.57 0.23 0.01 0.01 0.004 0.02
P0S3 not applicable
P1S1 0.012 31.76 0.27 0.01 0.01 0.006 0.02
P1S2 0.007 42.6 0.22 0.01 0.01 0.003 0.02
P1S3 not applicable
P2S1 0.004 33.26 0.23 0.01 0.01 0.003 0.02
P2S2 0.027 25.41 0.15 0.01 0.01 0.002 0.02
P2S3 0.008 21.3 0.17 0.01 0.01 0.002 0.02
P3S1 not applicable
P3S2 0.007 20.55 0.18 0.01 0.01 0.002 0.02
P3S3 not applicable
Sum 0.075 189.45 1.45 0.07 0.07 0.022 0.14
Average 0.009 23.68 0.18 0.008 0.009 0.003 0.02
of bamboo are also structurally complex which makes it difficult to decompose through a natural mechanical process. As an overview, Singh and Singh (1999) estimates that decomposition of 95% of bamboo leaves takes 28 months. Christanty, Mailly and Kimmins (1996) estimated that the complete decomposition of the leaves of bamboo takes 36 months.
Table 12 displays the test results of the nutrient content of runoff water. Some of the plot did not result in runoff or did result in surface runoff but they did not produce enough runoff to be analyzed in the laboratory at the time of water
Table 13. Parameter estimate of P element loss regression using regression test Parameter Estimates
Variable DF Parameter
Estimate
Standard Error
t Value Pr > |t| Standardized Estimate
Intercept 1 199.34000 16.11319 12.37 0.0011 0
BV 1 -160.96638 14.67854 -10.97 0.0016 -1.12224
RC 1 0.80395 0.20735 3.88 0.0304 0.39678
sampling. As shown in Table 12, the Phosphorus element lost reached on average of 23.68 ppm per plot. The loss of P element affects and suppresses plant growth. The element of P is an essential nutrient. In soil it is available in small quantities, mostly in the form that cannot be easily absorbed by plants and are bound by the Al in acid soils or by Ca in the alkaline soil (Hardjowigeno, 2007).
-1.122, and the RC of 0.397). Soil with a high density has a low porosity and has the ability to retain the P element better than the porous soil (Hardjowigeno, 2007). Therefore, the decrease of sand fraction helps soil retain the nutrient better so that the loss of nutrients caused by surface runoff can be minimized.
On dry land air with temperature of more than 30 , the standard evapotranspiration (ET ) is 6-9% (Allen ., 1998). Without technical irrigation, rain is the only source of water. With the small RC value (6.3%) measured in research plots, the largest soil moisture loss occurs through infiltration (>84%) and only 12.3 to 15.3% is through surface runoff and evapotranspiration. It shows that the highest risk of losing the element P in sandy soil (sand fraction >60%) is through nutrient leaching by infiltration.
Based on these findings it can be indicated that the increase in Regosol soil fertility was determined by an increase in the SOM which was comparable with the increase of CEC, and by the decrease in sand fraction that decreased nutrient loss due to leaching of nutrients. Meanwhile, the influence of bamboo canopy closure on SOM, in relation to soil fertility, remains low due to the decomposition of bamboo leaves litter which is quite long.
1. Rainfall intensity, rain duration, bamboo apus ( Kurz) canopy closure and soil sand fraction were all factors which influenced significantly the intensity of surface runoff. The increase of rainfall intensity and rain duration increased suface runoff, each by 0.049 and 0.412, respectively. Meanwhile, the increase of bamboo canopy closure and soil sand fraction decreased surface runoff, each by -0.019 and -0.065, respectively.
2. The increase in canopy closure of bamboo
apus ( Kurz) showed no
significant correlation to SOM, but showed a high correlation with the CEC and soil pH, each of 0.51 and -0.71, respectively. The slope, soil dust fraction and CEC showed significant positive relationship with the SOM, each of 0.065, 0.272 and 0.151, respectively.
o
o et al
Gigantochloa apus
Gigantochloa apus IV. CONCLUSION
3. The improvement of Regosol soil fertility in bamboo-based agroforestry in East Lombok was determined by the increase in SOM through decomposition of bamboo leaves and other organic matters in the long run, and by the prevention of leaching of soil nutrient. The leaching of soil nutrient is through infiltration (>84%) and is only 12.3 15.3% through surface r unoff and evapotranspiration.
Allen, G.A., L.S. Pereira, D. Raes and M. Smith. 1 9 9 8 .
FAO Irrigation and Drainage Paper 56. Food and Agriculture Organization of The United Nations. Roma.
Bolsa Analytical. 2007. Guidelines for Interpretation of Soil Analyses. Online publication at:
downloaded at 1/01/2013.
Buckman, H.O. and N. C. Brady. 1982. . Translated by: Soegiman. Bhatara Karya Aksara. Jakarta.
Christanty, L., Mailly D. and J.P. Kimmins. 1996. Without Bamboo, the Land Biomass, Litterfall, and Soil Organic Matter Dynamics of a Javanese Bamboo Talun-Kebun System.
87 (1-3) 75-88.
Critchley, W. and K. Siegert. 1991. A manual for the design and construction of water harvesting schemes for plant production. Rome. Online publication at:
downloaded at 27/7/2009.
Dinas Kehutanan Propinsi NTB. 2009. Rencana Kehutanan Spasial 2009-2013. Mataram. Divakara, B.N., B. M. Kumar, P. V. Balachandran,
and N. V. Kamalam. 2001. Bamboo hedgerow systems in Kerala, India: root distribution and competition with trees for
phosphorus. . 51:
189-200.
Freund, R.J., W. J. Wilson and P. Sa. 2006. Regression analysis: statistical modeling of REFERENCES
T h e I m p o r t a n c e o f C r o p Evapotranspiration - Guidelines for Computing Crop Water Requirements.
Ilmu Tanah
Dies:
Forest Ecology and Management
Agroforestry Systems
www.bolsalab.com
a response variable. Second edition. Online
publication at: .
Handoko, C. 2009. Ujicoba model wanatani kayu bakar di Lombok Timur. Research report -unpublished. Balai Penelitian Kehutanan Mataram, Mataram.
Hardjowigeno, S. 2007. . Sixth reprint. Akademika Pressindo. Jakarta.
Hudson, N. W. 1993. Field Measurement of Soil Erosion and Runoff. Rome. Online publication at:
27/7/2009.
Markum, S. Taslim and B. Setiawan. 2007. Studi pengembangan bambu di NTB. Research Report Ministry of Forestry and Mataram University, Mataram.
Nath, S., D. Rameswar, R. Chandra and A. Sinha. 2009. Bamboo based agroforestry for marginal lands with special reference to productivity, market trend and economy: article to the forest plantation research and evaluation. Indian Council of Forestry Research Education. Jharkhand.
O'connor , Paul J., A. P. Covich, F. N. Scatena and L. L. Loope. 2000. Non-indigenous bamboo along headwater streams of the
www.books.elsevier.com
www.fao.org Ilmu Tanah
downloaded at
Luquillo Mountains, Puerto Rico: Leaf fall, aquatic leaf decay and patterns of invasion.
16: 499-516.
Relf, D. 2009. . Virginia
Cooperative Extension. Virginia. Online publication:
Roshetko, J.M., Mulawarman, W. J. Santoso and I N Oka. 2001. Wanatani di Nusa Tenggara. Prosiding Lokakarya Wanatani se-Nusa Tenggara. International Centre for Research in Agroforestry and Winrock International. Denpasar.
Singh, A.N. and J.S. Singh. 1999. Biomass, Net Primary Production and Impact of Bamboo Plantation on Soil Redevelopment in a Dry Tropical Region.
119 (1-3): 195-207.
Stokes, M.E., S.D. Charles and G.K. Gary. 2001.
Second edition. John Wiley & Sons, Inc. USA.
Sulaeman, Suparto and Eviati. 2005. Petunjuk teknis analisis kimia tanah, tanaman, air dan pupuk. Balai Penelitian Tanah. Bogor. Online publication at:
downloaded at 1/02/2013.
Journal of Tropical Ecology
Reducing erosion and runoff
Forest Ecology and Management
Categorical Data Analysis Using the SAS® System.
http://pubs.ext.vt.edu