National Directorate of Economic Policy, DGSF, Tel. +670‑333‑13‑37
Page 1
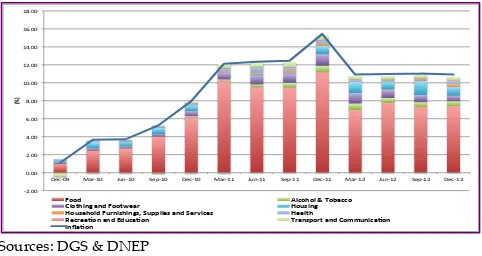
The year‑on‑year inflation rate at the end of December 2012 was 11.7% for Dili and 10.9% for Timor‑Leste. These rates are in line with those recorded in the previous quarter and thus suggest a reduction in volatility compared to 2011 and the beginning of 2012. Over 2012, Timor‑Leste’s average inflation rate was also 10.9%. This rate compares positively in terms of moderation of inflation with the 2011 rate of 13.1%.N.B. The Household Income and Expenditure Survey (HIES) of 2011 enabled the General Directorate of Statistics (DGS) to complete the update of the CPI. Notably, the revision concerned the composition of the CPI basket (‘re‑basketing’) and of the item weights (‘re‑weighting’) to ensure the relevance and accuracy of the CPI. Moreover, from next year (2013) CPI data will be available on a monthly basis for both Dili and Timor‑Leste. This review, however, will continue to be produced quarterly.
Inflation Trend
The year‑on‑year (y‑o‑y) inflation rate at the end of Q4 2012 was 10.9% in Timor‑Leste. As shown in Figure 1, this marks a clear improvement compared to last year’s rate (15.4%) and a slight improvement compared to the rate registered at the end of Q3 (11%). However, inflation remains at double digits and above the 2009 and 2010 rates. Also, the relatively lower rate of Q4 2012 compared to Q4 2011 may itself be the result of particularly high inflation in the last quarter of 2011, which somewhat leans on the Q4 2012 rate. In fact, although being adversely affected by seasonal variations, the quarterly inflation rate between Q3 and Q4 2012 stood at 6.7%, just 0.2 percentage points less than the Q3 to Q4 2011 rate and thus the second highest quarterly increase on record.
Figure 1. Inflation in Timor‑Leste by Category (Year‑on‑year, %)
Sources: DGS & DNEP
With the release of the Q4 inflation rate, it is possible to compute the annual average inflation figure, which gives a better indication of the overall evolution of
inflation throughout the year as a whole compared to the y‑o‑y rate. The Q4‑to‑Q4 rate provides important information as to what the inflation rate was at the end of 2012 compared to the end of 2011. However, this does not correspond to the annual inflation rate, as it considers only one quarter over the year. Instead, the annual average can be used when considering the inflation rate for the entire year. In 2012, this rate was 10.9% compared to 13.1% in 2011.
Concerning specific categories, the main y‑o‑y reductions compared to Q3 were observed in the housing category where house building costs have increased at a slower pace after a surge in Q3, for tobacco products and for clothing and footwear. These reductions outweighed the relative increases registered for health services and pharmaceuticals, household furnishings and alcoholic beverages.
In contrast, the y‑o‑y inflation rate for Dili has continued to moderately increase in the last quarter of 2012, reaching 11.7% in December. This was due mainly to food inflation (12.1%), clothing and footwear (16.3%) and transport (19.1%).
The diverging path between Dili and Timor‑Leste reflects a reduction in inflation in the ex‑Dili region during the last quarter of 2012, which may be a symptom of growing inequality between the capital and the other districts.
!"#$$% $#$$% "#$$% &#$$% '#$$% (#$$% )$#$$% )"#$$% )&#$$% )'#$$% )(#$$%
*+,!$-% ./0!)$% 123!)$% 4+5!)$% *+,!)$% ./0!))% 123!))% 4+5!))% *+,!))% ./0!)"% 123!)"% 4+5!)"% *+,!)"%
!"#
$
%&&'$ ()*&+&)$,$-&./**&$
0)&1+234$/3'$%&&156/7$ 8&9:234$
8&9:6+&)'$%9732:+234:;$<9==)26:$/3'$<67>2*6:$ 86/)1+$
?6*76/@&3$/3'$A'9*/@&3$ -7/3:=&71$/3'$0&BB932*/@&3$
C3D/@&3$
QUARTERLY INFLATION REVIEW
September – December 2012
National Directorate of Economic Policy, DGSF, Tel. +670‑333‑13‑37
Page 2
Underlying Causes
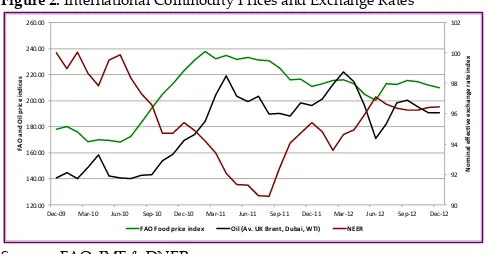
After depreciating during Q3 2012, the USD
increased in value with respect to the currencies of
Timor‑Leste’s main trading partners in the last three months of 2012 (NEER in Figure 2). Notably, in December 2012 the USD continued to appreciate against the IDR for the tenth month running; thus reducing, ceteris paribus, the price of imports from Indonesia. Moreover, both the FAO food price index and the IMF oil price index registered a decline during the last months of 2012 (Figure 2). These positive developments in international conditions are likely to have contributed to the slowdown in inflation. However, the existence of time lags between international and domestic prices implies that these effects may not have entirely factored in yet. This can be seen for the transportation category, for instance, where domestic prices continue to increase strongly whilst international oil prices have been on the decline. The differences between Dili and Timor‑Leste for specific categories such as clothing and footwear may be explained more by domestic factors than international ones. In effect, the high inflation registered in Dili in the clothing and footwear category (16.3% at the end of Q4; 16.8% over the year) well exceeds that registered for the country as a whole (7.8% and 11.2%) and is thus unlikely to result from international forces. Instead, it may be due to higher demand (relative to supply) in Dili
compared to the other districts.
Figure 2. International Commodity Prices and Exchange Rates
Sources: FAO, IMF & DNEP
Government expenditure has been identified as a
potential cause of high inflation in Timor‑Leste. The 2012 State Budget was set at $1.807 billion, or 38.4% higher than the 2011 total. However, for the purposes of inflation, it is more useful to look at actual as opposed to budgeted expenditure. These figures can diverge substantially for countries at Timor‑Leste’s development stage, as ambition may be greater than institutional capacity (in fact, in 2012 the execution rate in Timor‑Leste was 66.1%). While being careful to not confuse correlation with causation, the expenditure figures in 2012 seem to reinforce this relationship. Actual expenditure in 2010 and 2011 increased 25.8% and 44.3% respectively, compared to 8.9% increase in 2012. Ceteris paribus, the economy may have been better able to absorb this relatively modest increase in expenditure than in previous years.
Inflation Prospects
Decreasing international commodity prices and the appreciation of the USD with respect to Timor‑Leste’s main trading partners’ currencies may put downward pressure on inflation in future months. These forces are likely to outweigh the effects of the worse than anticipated second harvest for maize, which is now forecasted at 34,135 tonnes, and which may push up prices of maize products.
The Government takes the matter of high inflation seriously and this was a major consideration behind the decision to reduce budgeted expenditure in 2013 to $1.648 billion (8.8% reduction on 2012). These
concerns, as well as the Government’s stated policy to not use excess withdrawals from the petroleum fund to finance expenditure in 2013 suggest a more fiscally responsible expenditure path in the future. However, inflation will be determined mainly by actual not budgeted expenditure. This means that inflationary pressure will be reduced if actual spending, particularly recurrent, is lower in 2013 than 2012. Lastly, it should be noted that with the next quarterly review, the information provided will be based on the updated CPI basket and will therefore offer a more contemporary representation of inflation.