Victorian Auditor-General’s Report
December 2015
2015–16:18
Water Entities:
V I C T O R I A
Victorian
Auditor-General
Water Entities:
2014–15 Audit
Snapshot
Ordered to be published
VICTORIAN GOVERNMENT PRINTER
December 2015
This report is printed on Monza Recycled paper. Monza Recycled is certified Carbon Neutral by The Carbon Reduction Institute (CRI) in accordance with the global Greenhouse Gas Protocol and ISO 14040 framework. TheLifecycle Analysis (LCA) for Monza Recycled is cradle to grave including Scopes 1, 2 and 3. It has FSC Mix Certification combined with 55% recycled content.
The Hon Bruce Atkinson MLC The Hon Telmo Languiller MP
President Speaker
Legislative Council Legislative Assembly
Parliament House Parliament House
Melbourne Melbourne
Dear Presiding Officers
Under the provisions of section 16AB of the Audit Act 1994, I transmit my report on Water Entities: 2014–15 Audit Snapshot.
This report comments on the outcomes of the financial audits of the 19 water entities for the year ended 30 June 2015. It informs Parliament about significant issues arising from the audits of both the financial and performance reports.
Qualified audit opinions were issued on the four metropolitan water entities' financial reports for 2014–15, as they contained errors in the fair valuation of infrastructure assets. These errors triggered consequential impacts to the performance reports of these entities, therefore qualified audit opinions were also issued on their performance reports. The report also highlights the sector's financial outcomes, risks to financial sustainability and trends in debt across the sector for the past five years.
Yours faithfully
Dr Peter Frost Acting Auditor-General
Contents
Auditor-General's comments ... vii
Audit summary ... ix
Conclusions ... ix
Findings ...x
Recommendations ... xii
Submissions and comments received ... xii
1. Context... 1
1.1 Introduction ... 1
1.2 Victorian water sector ... 2
1.3 Audits for the year ended 30 June 2015 ... 5
1.4 Emerging matters ... 13
2. Financial outcomes ... 15
2.1 Introduction ... 16
2.2 Conclusion ... 16
2.3 Financial overview of the sector ... 16
2.4 Risks to financial sustainability ... 23
3. Performance reporting... 33
3.1 Introduction ... 34
3.2 Conclusion ... 34
3.3 Performance reporting framework ... 34
3.4 Progress of the framework to 2014–15 ... 35
3.5 Audit opinions ... 36
3.6 The quality of performance reporting ... 37
4. Trends in debt management ... 41
4.1 Introduction ... 42
4.2 Conclusions ... 42
4.3 Debt management in the public sector ... 42
Appendix A. Water entity list... 55
Appendix B. Management letter risk ratings... 57
Appendix C. Risks to financial sustainability ... 59
Appendix D. Acronyms and glossary ... 65
Appendix E. Performance reporting ... 73
Auditor-General’s comments
The Parliament and community can have confidence in the 2014–15 financial and performance reports of 15 of the 19 water entities.
I issued qualified audit opinions on the four metropolitan water entities' financial reports for 2014–15, as they contained errors in how the entities struck the fair value of their infrastructure assets. These errors led to a combined overstatement to the value of infrastructure assets of $1.3 billion at 30 June 2015. These errors also impacted the accuracy of three of the financial performance indicators reported in the metropolitan water entities' performance reports, therefore, I also issued qualified audit opinions on those reports.
The sector generated a combined net profit before income tax of $430.6 million for the year ended 30 June 2015, an increase of $109.7 million from 2013–14. Fifteen water entities reported an improvement in their net result (including a reduction in deficits), with only four delivering a loss before income tax, compared to six last year. Despite the improvement in short-term results for the majority of the sector, when analysing risks to financial sustainability there is liquidity risk for the metropolitan and regional urban water entities given the quantum of short-term debt held, and there are also longer-term risks associated with the water sector's ability to replace or renew assets and to repay debt.
The level of borrowings in the water sector increased by 29 per cent, from $8 billion in 2010–11 to $10.4 billion in 2014–15, representing a quarter of the state's borrowings. The metropolitan cohort holds 80 per cent of the total debt portfolio. The growth in borrowings has funded the delivery of major capital projects and has been held to meet certain other payments, such as dividends. Borrowings are also expected to increase by a further 19 per cent in the period to 2018–19, based on forecasts from the entities' 2014–15 corporate plans.
There continues to be significant dependency on debt to finance capital projects, as water entities do not generate sufficient revenue from operations to be able to fund this investment. Further, over the past five years, of the $3.7 billion of loans maturing, $2.7 billion, or greater than 70 per cent, of these loans have not been repaid––they have been rolled over. Eight entities across the sector did not repay any debt over the five-year period. Longer-term financial risks exist for the sector if the sole source of funding capital projects continues to be predominantly from debt and the debt continues to be rolled over and not repaid at similar rates. Lastly, only three water entities had formal debt management plans or strategies.
Audit summary
This report details the outcomes of the 2014–15 financial audits of Victoria’s 19 water entities.
The report identifies and discusses the key issues within the water sector that arose during our audits, and provides an analysis of information included in water entity financial reports and performance reports. It is one of a suite of
Parliamentary reports on the results of the 2014–15 financial audits conducted by VAGO.
Conclusions
Fifteen water entities received clear audit opinions on their financial reports for the financial year ended 30 June 2015, and four entities received qualified audit opinions. The Parliament and the community can have confidence in those reports with clear opinions.
Qualified opinions were issued to the four metropolitan water entities as they had an error in the fair valuation of infrastructure assets, leading to a combined overstatement of the value of infrastructure assets and the corresponding infrastructure asset revaluation reserve of $1.3 billion at 30 June 2015 ($417.0 million at 30 June 2014).
All four metropolitan water entities had inappropriately accounted for deferred tax benefits in their fair value calculation. In addition, Melbourne Water had also inappropriately accounted for developer contributions in their fair value calculation. These errors constitute a departure from Australian Accounting Standard AASB 13 Fair Value Measurement and triggered consequential impacts to the performance reports of these entities Therefore, qualified audit opinions were also issued on their performance reports.
The overall financial performance of the water sector has shown an improvement for the 2014–15 reporting period.
Despite the improvement in short-term results for the majority of the sector, when analysing risks to financial sustainability there are liquidity risks for the metropolitan and regional urban water entities given the quantum of short-term debt held, and there are also longer-term risks associated with the sector's ability to replace or renew assets and to repay debt.
Findings
Financial outcomes
The overall financial performance of the water sector has shown an improvement for the 2014–15 reporting period, on an already positive result recorded last year. The sector generated a combined net profit before income tax of $430.6 million for the year ended 30 June 2015, an increase of $109.7 million from the prior year. Fifteen water entities reported a growth in their net result—including a reduction in their net deficits—with only four delivering a loss before income tax, compared to six in 2013–14.
In 2014–15, dividends paid by the four metropolitan water entities totalled $120.8 million, an increase of $82.4 million on 2013–14.
Despite the improvement in short-term results for the majority of the sector, when analysing risks to financial sustainability, there are liquidity risks for the
metropolitan and regional urban water entities given the quantum of short-term debt held, and there are also longer-term risks associated with the sector's ability to replace or renew assets and to repay debt.
General internal controls
At the commencement of the 2014–15 reporting period, 54 high- and medium-risk issues raised by VAGO since the 2011–12 reporting period remained unresolved. At the end of the reporting period, two high-risk and 16 medium-risk issues raised in prior years remain unresolved.
Our Water Entities: Results of the 2013–14 Audits report, tabled in Parliament in February 2015, analysed the management of gifts, benefits and hospitality across the four metropolitan water entities and the operations of audit committees across all 19 water entities. Nine issues were raised across the water sector. At the end of the 2014–15 reporting period, three issues relating to gifts, benefits and hospitality and two issues relating to audit committees remain unresolved.
Performance reporting
Audit summary
Water entities need to place a greater focus on the processes employed to prepare performance reports, such as:
• designating responsible officers for the overall preparation of reports
• maintaining a central repository for collation of data used to support the performance report
• implementing a formalised independent quality review process
• preparing quality shell performance reports.
Trends in debt management
At 30 June 2015, the Victorian water sector debt held 25 per cent of the state’s overall borrowings. The level of borrowings in the water sector increased by 29 per cent, from $8 billion in 2010–11 to $10.4 billion in 2014–15.
The growth in borrowings has funded the delivery of major capital projects and has been used to meet certain other operating costs. There has been, and continues to be, significant dependency on debt to finance capital projects, as water entities do not generate sufficient revenue from operations to be able to fund this investment. Over the past five years, of the $3.7 billion of loans maturing, $2.7 billion of these loans or greater than 70 percent have not been repaid––they have been rolled over. Eight entities across the sector did not repay any debt over the past five years.
Based on the water entities' 2014–15 corporate plans, borrowings are expected to increase by a further 19 per cent in the period to 2018–19. This is largely driven by the metropolitan water cohort. The increase in debt has been forecast to fund capital expenditure programs and to meet other obligations, such as dividend and tax payments.
Funding capital projects from borrowings is an appropriate mechanism, particularly when the funds are used to construct larger-scale assets with extended useful lives, as costs associated with the assets are spread across future generations. However, longer-term financial risks exist for the sector, if the sole source of funding capital obligations continues to be predominantly from debt and the debt continues to be rolled over at similar rates.
We identified that only three water entities had formal debt management plans or strategies. For the remainder of the sector, some elements of a debt management plan were captured within other corporate documents such as corporate plans and treasury policies.
Recommendations
Number Recommendation Page
That water entities:
1. address issues raised in audit management letters on a timely basis so that any weaknesses in their control environment are rectified promptly.
14
That metropolitan water entities:
2. change their current valuation model used to estimate the fair value of infrastructure assets to correct the errors identified by audit in the qualification.
14
That water entities:
3. enhance their performance reporting processes to: • designate a responsible officer for the overall
preparation and production of the performance report • maintain a central repository for collation of data used to
support the performance report
• implement a formalised, independent quality review process over the preparation processes and presentation of the performance report • prepare quality shell performance reports • critically assess the requirements of Ministerial
Reporting Direction (MRD) 01 Performance Reporting, including providing adequate training or guidance to staff preparing the performance reports.
39
That the Department of Environment, Land, Water & Planning:
4 conducts a more robust review of water entities' draft corporate plans to detect any disparities with MRD 01 and undertakes a comprehensive review of MRD 01
non-financial KPIs for consistency.
39
That water entities:
5. establish a dedicated debt management strategy or plan that maps out their approach to debt management and usage over the medium and longer term.
54
Submissions and comments received
We have professionally engaged with all 19 water entities, the Department of Environment, Land, Water & Planning, the Department of Treasury & Finance, the Essential Services Commission and the Treasury Corporation of Victoria
throughout the preparation of this report. In accordance with section 16(3) of the Audit Act 1994 we provided a copy of this report, or relevant extracts, to named agencies and requested their submissions or comments.
1
Context
1.1
Introduction
This report details the outcomes of the 2014–15 financial audits of Victoria's 19 water entities. In addition, there are two controlled entities, where one no longer actively trades, and the other is captured in the consolidated results of the parent entity. As a result, no further comments are made on the results of these audits throughout this report.
The report identifies and discusses the key issues within the water sector that arose during our audit conduct, and provides an analysis of information included in water entity financial reports and performance reports. It is one of a suite of Parliamentary reports on the results of the 2014–15 financial audits conducted by VAGO.
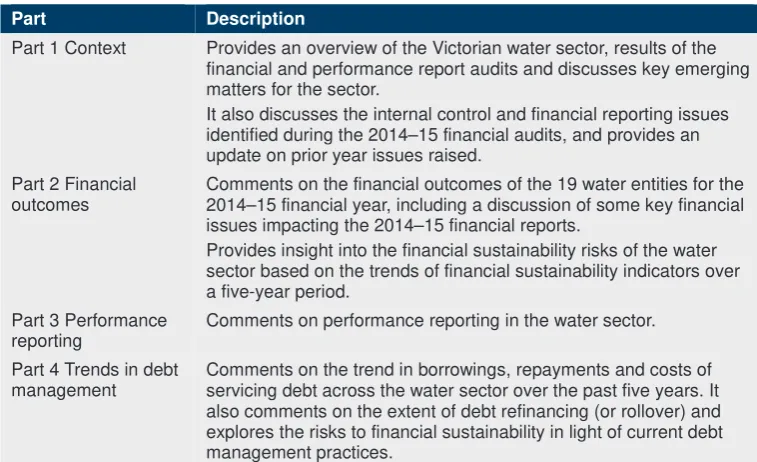
Figure 1A outlines the structure of this report.
Figure 1A Report structure
Part Description
Part 1 Context Provides an overview of the Victorian water sector, results of the financial and performance report audits and discusses key emerging matters for the sector.
It also discusses the internal control and financial reporting issues identified during the 2014–15 financial audits, and provides an update on prior year issues raised.
Part 2 Financial outcomes
Comments on the financial outcomes of the 19 water entities for the 2014–15 financial year, including a discussion of some key financial issues impacting the 2014–15 financial reports.
Provides insight into the financial sustainability risks of the water sector based on the trends of financial sustainability indicators over a five-year period.
Part 3 Performance reporting
Comments on performance reporting in the water sector.
Part 4 Trends in debt management
Comments on the trend in borrowings, repayments and costs of servicing debt across the water sector over the past five years. It also comments on the extent of debt refinancing (or rollover) and explores the risks to financial sustainability in light of current debt management practices.
Source: Victorian Auditor-General's Office.
1.2
Victorian water sector
1.2.1
Snapshot of the sector
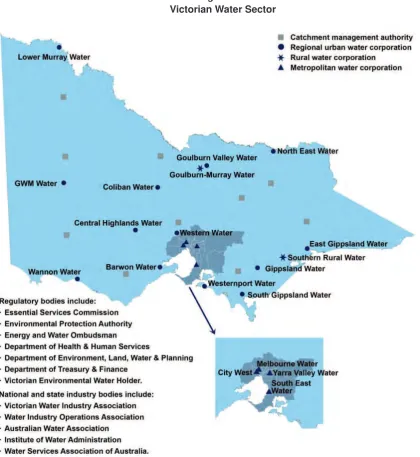
Figure 1B outlines the Victorian water sector:
Figure 1B
Victorian Water Sector
Context
The Victorian water sector includes 21 public sector entities, comprising 19 water entities and two controlled entities. Appendix A of this report includes a list of all 21 entities. This report solely focuses on the results of audits relating to the 19 water entities.
The entities are stand-alone businesses responsible for their own management and performance and provide a range of water services, including the supply of water and/or sewerage services to customers across the state. Several of them also manage bulk water storages and specific recreational areas throughout Victoria.
The 19 water entities are split into three operating areas—metropolitan, regional urban and rural—with each entity providing services within its designated area. Each water entity is governed by a constituted board that has a range of responsibilities, including:
• steering the entity
• setting objectives and performance targets
• ensuring compliance with legislation and government policy.
The board of each water entity reports to the Minister for Environment, Climate Change and Water via the Department of Environment, Land, Water & Planning (DELWP). In turn, the minister is responsible for reporting to Parliament on the performance of each water business.
The Water Act 1989 is the central legislation for the Victorian water industry. Its objectives include:
• promoting the orderly, equitable and efficient use of water resources
• ensuring that water resources are conserved and properly managed for sustainable use for the benefit of all Victorians
• maximising community involvement in the making and implementation of arrangements relating to the use, conservation or management of water resources.
In addition to these water entities, there are 10 catchment management authorities (CMA), established under the Catchment and Land Protection Act 1994 (Vic). The CMAs are responsible for coordinated catchment management in their region and are provided with regional waterway, floodplain, drainage and environmental water reserve management powers under the Water Act 1989. The results of the audits for the CMAs are not captured by this report, they are included in our Portfolio Departments and Associated Entities: 2014–15 Audit Snapshot.
The water sector is also regulated by a number of key agencies, as shown in Figure 1B, who are responsible for setting economic, environmental and social
obligations upon water entities, such as the Essential Services Commission (ESC) and DELWP.
1.2.2
Regulatory pricing model for the sector
Since 1 January 2004, the ESC has been responsible for regulating and approving the maximum prices each water entity may charge its customers for the supply of water and the provision of sewerage services. The ESC sets prices in accordance with the requirements of the Essential Services Commission Act 2001 (the Act), the Water Industry Act 1994, and the Water Industry Regulatory Order. The ESC has approved prices for metropolitan and regional urban businesses since 1 July 2005 and for rural businesses since 1 July 2006.
Its role includes the regulation of prices and monitoring of service standards, and market conduct.
The Act states that the ESC's objective is to promote the long-term interests of Victorian consumers with regard to the price, quality and reliability of essential services.
In order to achieve this, the ESC needs to take into consideration:
• efficiency in regulated entities and incentives for long-term investment
• the financial viability of regulated entities
• existing and potential competition within the sector
• the relevant health, safety, environmental and social legislation
• the benefits and costs of regulation for consumers—including low income or vulnerable consumers—and regulated entities
• consistency in regulation between state jurisdictions and on a national basis.
Taking this into consideration, the ESC has conducted a price review every three to five years since 2004. As part of this review, water entities are required to provide the ESC with a water plan. The ESC then determines the maximum prices for each water entity's prescribed goods and services.
Water Plan 3, 2013–14 onwards
In October 2012, the 19 water entities submitted water plans that covered the period 1 July 2013 to 30 June 2018 to the ESC for assessment.
Each entity was required to set out in its plan:
• expected costs of delivering water and sewerage services
• planned capital works programs
• forecast volumes of water to be delivered
• level of service to customers
• proposed prices that would raise sufficient revenue to recover expected costs.
The ESC assessed the proposed prices and revenue against the regulatory principles set out in the Water Industry Regulatory Order 2012.
The ESC's final price determinations in relation to Water Plan 3 were released in June 2013. They apply for all entities except Goulburn-Murray Water and Melbourne Water from 1 July 2013 to 30 June 2018—or when the ESC makes a new
Context
Overall, the ESC's final decision reduced the water entities' proposed revenue by:
• $1 billion for metropolitan water entities—this includes revenue estimates for years four and five for Melbourne Water
• $200 million for regional urban water entities
• $13 million for rural water entities.
The ESC assessed that water entities were able to deliver services at a lower cost and thus adjusted the water entities' proposed:
• operating expenditure—for example, labour
• productivity improvements
• capital programs and, therefore, financing costs.
The average price increase for each water cohort over the third regulatory period, excluding the impact of inflation, is shown in Figure 1C.
Figure 1C
Average price increase for water entities from the third regulatory period
Water cohort Average change (per cent)
Metropolitan retailers 22.20
Regional urban 1.27
Rural 0.75
Source: Victorian Auditor-General’s Office.
1.3
Audits for the year ended 30 June 2015
1.3.1
Financial audit opinions issued
Independent audit opinions add credibility to financial reports by providing reasonable assurance that the information reported is reliable and accurate. A clear audit opinion confirms that the financial report presents fairly the transactions and balances for the reporting period, in accordance with the requirements of relevant accounting standards and applicable legislation. Fifteen clear audit opinions and four qualified audit opinions were issued to the water entities for the financial year ended 30 June 2015.
A qualified audit opinion is issued when the auditor cannot be satisfied that the financial report is free from material misstatement.
The financial audits of the water entities were undertaken in accordance with the Australian Auditing Standards.
Qualified audit opinions
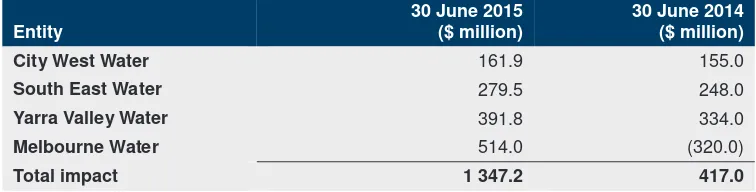
All four metropolitan water entities had inappropriately accounted for deferred tax benefits in their fair value calculation. In addition, Melbourne Water had inappropriately accounted for developer contributions in its fair value calculation. These errors are a departure from Australian Accounting Standard (AASB) 13 Fair Value Measurement. In our view, the error in the fair value models of each metropolitan water entity had the following estimated financial report impact on the carrying value of infrastructure assets and the infrastructure asset revaluation reserve:
Figure 1D
Estimated overstatement/(understatement) of infrastructure assets valuation and infrastructure asset revaluation reserve
Entity
30 June 2015 ($ million)
30 June 2014 ($ million)
City West Water 161.9 155.0
South East Water 279.5 248.0
Yarra Valley Water 391.8 334.0
Melbourne Water 514.0 (320.0)
Total impact 1 347.2 417.0
Source: Victorian Auditor-General’s Office.
The errors also had a consequential impact on the depreciation expense, income tax expense, current tax payable and net deferred tax liabilities for the year ended 30 June 2015—the effects of these errors were not determined as it was not practicable to do so.
As per the requirements of Financial Reporting Direction (FRD) 103F Non-financial physical assets issued pursuant to the Financial Management Act 1994, the metropolitan water entities' infrastructure assets are required to be reported at fair value, with fair value to be determined in accordance with AASB 13.
AASB 13 was effective for reporting periods beginning on 1 July 2013, and provided a more prescriptive definition of fair value as 'the price that would be received to sell an asset or paid to transfer a liability in an orderly transaction between market participants at the measurement date'.AASB 13 brought about a key change in considering fair value from a 'market participant's perspective', placing an emphasis on the 'current exit price' that a market buyer would be 'willing to pay'.
The four metropolitan water entities determined the fair value of infrastructure assets using an 'income approach'—based on a discounted cash-flow analysis. The water entities utilised the expertise of an external accounting firm (expert valuer) to either calculate the fair valuation of infrastructure assets annually, or to assist with a review of an internal valuation model and to recommend key assumptions.
Context
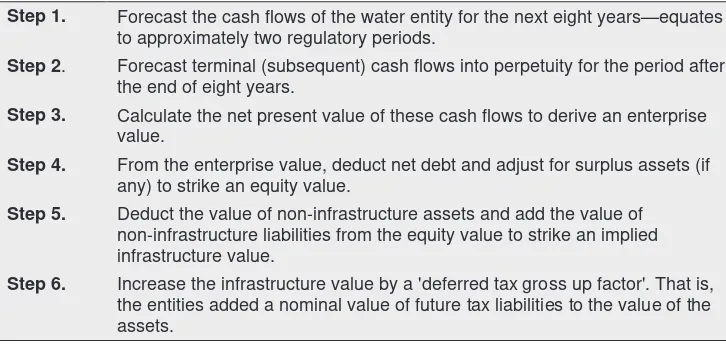
The 'income approach' methodology used by the water entities to determine the fair value of infrastructure assets is summarised in Figure 1E.
Figure 1E
Income approach methodology applied to fair value infrastructure assets
Step 1. Forecast the cash flows of the water entity for the next eight years—equates to approximately two regulatory periods.
Step 2. Forecast terminal (subsequent) cash flows into perpetuity for the period after the end of eight years.
Step 3. Calculate the net present value of these cash flows to derive an enterprise value.
Step 4. From the enterprise value, deduct net debt and adjust for surplus assets (if any) to strike an equity value.
Step 5. Deduct the value of non-infrastructure assets and add the value of non-infrastructure liabilities from the equity value to strike an implied infrastructure value.
Step 6. Increase the infrastructure value by a 'deferred tax gross up factor'. That is, the entities added a nominal value of future tax liabilities to the value of the assets.
Source: Victorian Auditor-General's Office.
The error identified from our audits related to a flaw in the primary methodology in step 6.
For the retail water entities, the error related solely to the 'deferred tax gross up factor' applied to increase the fair value of infrastructure assets. This factor was applied to take into account tax benefits that a potential buyer (market participant) would receive if buying the infrastructure assets. The factor applied was at nominal value.
The application of general present value techniques is a requirement when using an income approach to strike fair value under AASB 13. We concluded that when applying such a factor, any potential buyer would factor in the timing of when the cash flow savings from these tax benefits would arise and discount these benefits to net present value. Consequently, we were of the view that the fair values determined were materially overstated.
For Melbourne Water, we identified that the tax cash outflows within the discounted cash-flow model were based on an accounting rather than tax-based depreciation, which in turn were based on an accounting written down value (fair value) of the infrastructure assets rather than a tax-based written down value (cost less cumulative tax depreciation) of the infrastructure assets.
Melbourne Water had already included the present value of deferred tax benefits within their cash-flow model in steps 1 and 2, and therefore did not need to apply a 'deferred tax gross up', as this would be duplicating the impact. Consequently, we were of the view that the fair value of infrastructure assets was overstated. We also identified that Melbourne Water inappropriately accounted for developer contributions in the
The water entities collectively disagreed with our view that there is an 'error' in the methodology and engaged their expert to consider an alternate valuation scenario. This approach took into account the error identified by our audit, however, it also changed several significant assumptions we had not previously commented on. It was not indicative of the impact of matters identified by our audit, therefore it did not change our view. The 2015–16 financial year presents an opportunity for the
metropolitan water entities to rectify this issue as it is a revaluation year, as discussed in Part 1.4.
1.3.2
Performance audit opinions issued
Clear audit opinions were issued on 15 of the 19 performance reports, with four qualified audit opinions being issued for the 2014–15 reporting period. A clear audit opinion confirms that the actual results reported on the performance report were fairly presented and complied with legislative requirements. A qualified audit opinion is issued when the auditor cannot be satisfied that the performance report is fairly presented.
We do not form an opinion on the relevance or appropriateness of the reported performance indicators as they are set by Ministerial Direction. The audits were undertaken in accordance with the Australian Auditing Standards.
Qualified audit opinions
The audits of the 2014–15 financial reports of the metropolitan water entities identified errors in the fair value of infrastructure assets. Consequently certain values used to calculate three of the financial performance indicators—gearing ratio, return on assets and return on equity—were impacted, and the actual results for 2013–14 and 2014–15 were reported in error. For further detail on the outcomes of the performance reporting for 2014–15, please refer to Part 3 Performance reporting.
1.3.3
General internal controls and financial reporting
Effective internal controls help entities to reliably and cost-effectively meet their objectives. Strong internal controls are a prerequisite for the delivery of reliable, accurate and timely external and internal financial reports.
In our annual financial audits we focus on the internal controls relating to financial reporting and assess whether entities have managed the risk that their financial reports will not be complete and accurate. Poor internal controls diminish management's ability to comply with relevant legislation, and increase the risk of fraud and error.
The governing body of each water entity is responsible for developing and maintaining internal controls that enable:
• preparation of accurate financial records and other supporting documentation
• timely and reliable external and internal reporting
• appropriate safeguarding of assets
Context
The Standing Directions of the Minister for Finance require management to implement effective internal control structures. In this Section we have included:
• internal control weaknesses or financial reporting issues commonly identified across the 19 water entities in 2014–15
• analysis of the status of prior period control weaknesses or financial reporting issues.
Commonly identified internal control weaknesses or financial
reporting issues
In conducting our financial audits, we observed that the financial reporting internal controls at the water entities, to the extent we tested those controls during our audit, were adequate for maintaining the reliability of financial reporting. Nevertheless, we identified a number of instances where important internal controls need to be strengthened or financial reporting matters need to be addressed.
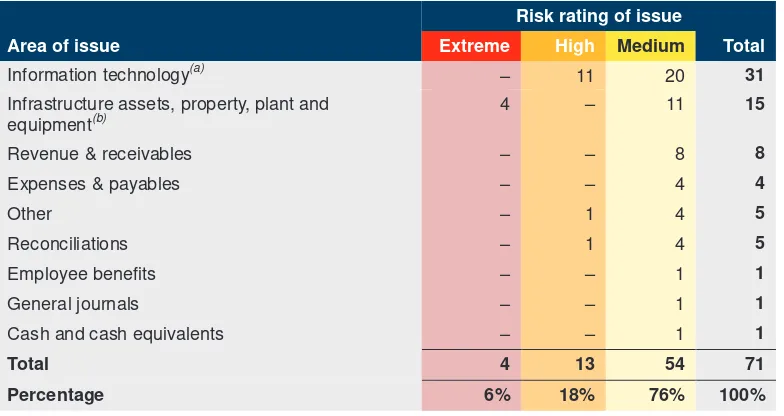
During the 2014–15 reporting period, audit teams identified 108 internal control weaknesses or financial reporting issues, which were reported to management and audit committees. Figure 1F shows the number of issues identified by risk rating for extreme, high and medium risks—it excludes 37 low-risk issues.
The definitions of each risk rating are detailed in Appendix B.
Figure 1F
2014–15 reported issues by topic and risk rating
Risk rating of issue
Area of issue Extreme High Medium Total
Information technology(a) – 11 20 31
Infrastructure assets, property, plant and equipment(b)
4 – 11 15
Revenue & receivables – – 8 8
Expenses & payables – – 4 4
Other – 1 4 5
Reconciliations – 1 4 5
Employee benefits – – 1 1
General journals – – 1 1
Cash and cash equivalents – – 1 1
Total 4 13 54 71
Percentage 6% 18% 76% 100%
(a) Information technology issues relating to the billing system have been included in the 'revenue & receivables' area of issue.
(b) The four extreme risk issues related to the metropolitan water entities' qualification errors outlined in Part 1.3.
Note: Figure 1F excludes low-risk issues raised.
Extreme- and high-risk issues across the sector
In 2014–15, 17 extreme- and high-risk issues were identified across the water sector relating to:
• fair valuation of infrastructure assets at the four metropolitan water entities, leading to qualified audit opinions on both the financial and performance reports
• tax effect accounting-related matters, resulting in material prior period error restatements to a water entity's financial report
• preparation and review of key general ledger reconciliations not occurring periodically across the reporting period
• improvements required to information technology (IT) security controls such as user access management, disaster recovery capabilities, patch management and authentication controls.
Common issues across the sector
More broadly, common areas requiring improvement to controls or financial reporting processes across the sector for 2014–15 were:
• IT system related matters
• monitoring, maintenance and accounting for infrastructure assets, property, plant and equipment
• monitoring, maintenance and user access within revenue billing systems.
Information technology
IT controls protect computer applications, infrastructure and information assets from a wide range of security and access threats. They promote business continuity, minimise business risk, reduce the risk of fraud and error, and help meet business objectives. There is extensive reliance on IT across the water sector, and systems are continually upgraded and replaced to improve information management and the quality of services provided to the community. With the implementation of new IT, the upgrade of existing systems and the continuing emergence of external threats, new security risks to the IT environment can arise regularly.
In our Financial Systems Controls Report: Information Technology 2014–15, tabled in October 2015, we noted the following emerging issues across government, which were also present in water sector management letters raised across the 2014–15 reporting period:
• improvements to IT security controls around user access management authentication controls
• audit logging and monitoring of IT environment
Context
Monitoring, maintenance and accounting for fixed assets
Water entities have substantial fixed assets including infrastructure, land, buildings and plant and equipment. At 30 June 2015 the aggregate value of fixed assets was
$41.7 billion. The assets need to be appropriately recorded and maintained, and their condition and use monitored, so that decisions can be made about whether they are appropriately valued and when they need to be replaced.
In addition to the errors identified with the fair valuation of infrastructure assets at the four metropolitan water entities—highlighted in Section 1.3.1—other common issues across the sector relate to:
• the untimely capitalisation of fixed assets at five of the 19 water entities in 2014–15
• untimely disposal of fixed assets from the fixed asset register
• incorrect application of indices to determine the fair value of buildings under the requirements of FRD 103F
• failure to adequately record changes in fair valuation techniques
• inconsistent application of approved useful lives.
Monitoring, maintenance and user access within the revenue billing
system
In 2014–15, the 19 water entities generated revenue of $5.6 billion, of which $3.3 billion relates to the billing of service and usage charges. The billing masterfile needs to be updated, monitored and maintained appropriately, to minimise the
potential risk of fraud or errors. Inadequate monitoring of the billing system can lead to inaccurate charging of revenue and potential revenue foregone—ultimately leading to misstatements in the financial report.
The key issues identified were:
• control weaknesses over the customer and billing masterfile and lack of segregation of duties over amendments to credit notes
• control weaknesses over billing system user access and password management
• weak bad debtor write-off processes.
Water entities should seek to address all issues raised in accordance with the time periods raised in management letters, to remove potential weaknesses in their control frameworks and to reduce the risk of error in their financial reports. Recommended time lines for the resolution of these issues are detailed in Appendix B of this report.
Status of prior period issues
The status of internal control weaknesses or financial reporting issues identified in prior periods are presented and communicated to water entity management and their audit committees through the current years' management letters. These issues are
Figure 1G
Prior-period issues–resolution status by risk
Risk rating of issue
Period issue raised in Extreme High Medium Total
Unresolved issues – 2 16 18
Resolved issues – 8 28 36
Total – 10 44 54
Note: Figure 1G excludes low risk issues raised.
Source: Victorian Auditor-General's Office.
At the commencement of the 2014–15 reporting period, 54 high- and medium-rated issues raised since the 2011–12 reporting period remained unresolved. Across the 2014–15 reporting period, 36 or 67 per cent, of these issues were resolved and closed. Two high-risk and 16 medium-risk issues raised in prior years remain unresolved. Time frames for resolution of high- and medium-risk rated issues should be within
six months of the issue being raised. This means that the control frameworks in place at these entities are not as effective as they should be.
Management should seek to address all issues raised on a timely basis, to rectify any weaknesses in their control environment to mitigate the risk of material errors occurring in their financial statements.
Refer to Appendix B for detail on time lines for resolution by risk rating.
Follow up on Water Entities: Results of the 2013–14 Audits—Focus
Areas
Our Water Entities: Results of the 2013–14 Audits report tabled in February 2015 analysed the management of gifts, benefits and hospitality across the four metropolitan water entities and the operations of audit committees across all 19 water entities. Nine issues were raised across the water sector. At the end of the 2014–15 reporting period, three issues relating to gifts, benefits and hospitality and two issues relating to audit committees remain unresolved.
Context
1.4
Emerging matters
1.4.1
Government review of water board positions
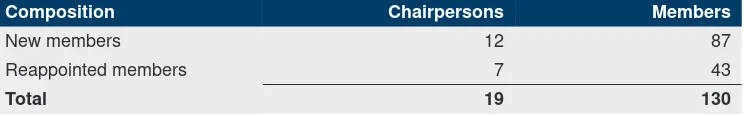
On 8 April 2015, the Minister for Environment, Climate Change and Water announced that the government would review all board positions (excluding managing directors). All current and prospective board members were encouraged by the government to participate in an expressions of interest process. More than 1 400 people expressed interest in joining one of the 19 water entities' boards following the announcement. The minister announced the newly appointed board members on 29 September 2015, with positions effective from 1 October 2015. Figure 1H highlights the split between the newly appointed board members and reappointed board members for the 19 water entities, comprising 12 newly appointed chairpersons, with 87 of the 130
(or 67 per cent) being newly appointed members for the sector.
Figure 1H
Composition of the 19 water entities' board positions
Composition Chairpersons Members
New members 12 87
Reappointed members 7 43
Total 19 130
Source: Victorian Auditor-General's Office.
Essential Services Commission—review of water pricing
approach
The Water Industry Regulatory Order was revised in October 2014, and now allows ESC to consider a broad range of pricing approaches for Victorian water and sewerage customers. As a result, ESC commenced an extensive consultative review of their pricing approach.
The selected pricing approach(es) will underpin ESC's next major water price review for the fourth regulatory period from 1 July 2018. ESC is expected to release its guidance for the 2018 price review in late 2016.
The review focuses on generating new ideas for the future pricing approach. ESC has also engaged a number of independent regulatory experts to provide their views on alternative pricing approaches. Over the remainder of the 2015 calendar year, ESC will be considering the matters raised in submissions responding to the consultation paper and other papers prepared by the regulatory experts.
Commencement of the pricing submission period effective
1 July 2016
Melbourne Water has commenced the process to set waterway, drainage and
wholesale water and sewerage charges for 2016–17 to 2020–21, which will come into effect on 1 July 2016. Consultation closed on 1 July 2015 and the final submission was made on 30 October 2015.
ESC has also commenced its review of Goulburn-Murray Water's price submission for the period 2016–17 to 2020–21, where the final submission was made on 7 September 2015. ESC expects to release a draft decision on Goulburn-Murray Water's prices and services, and another consultation process on the draft decision will occur in
March 2016.
2015–16 asset revaluation
A full valuation of property, plant, equipment and infrastructure assets for the water sector is scheduled for the 2015–16 financial year, as per the requirements under FRD 103F––this occurs every five years.
In addition to our audit qualification relating to the fair valuation infrastructure assets of the metropolitan water entities in 2014–15, our review of the 2010–11 fair valuation for regional urban and rural water entities found that improvements could be made to the processes applied to valuing infrastructure assets.
In particular, in our Water Entities: Results of the 2010–11 Audits report we recommended that:
• water entities work with the Department of Treasury & Finance and the Valuer-General Victoria (VGV) to determine the most appropriate valuation methodology for infrastructure assets
• the VGV should ensure all valuations conducted, including those by service providers ,be subjected to rigorous quality assurance processes, and that appropriate effort is invested in establishing agreement with client entities before valuations are conducted.
In preparation for the upcoming revaluation year (2015–16), the water industry has proactively formed an inter-agency working group, which is being administered by the industry body, VicWater. The group consists of representatives from the water entities, VGV, DELWP and the Department of Treasury & Finance, and observers from VAGO. The revaluation process will be a significant area of focus for water entities during 2015–16 and a key focus area for our audit program.
Recommendations
1. That water entities address issues raised in audit management letters on a timely basis so that any weaknesses in their control environment are rectified promptly.
2
Financial outcomes
At a glance
Background
This Part looks at the collective 30 June 2015 financial position of the 19 water entities. It details the main drivers behind the net results achieved, and analyses the sector's financial sustainability risks.
Conclusion
The financial performance of the water sector has shown an improvement for the 2014–15 reporting period. The sector generated a combined net profit before income tax of $430.6 million for the year ended 30 June 2015, an increase of $109.7 million from the prior year. Fifteen water entities reported a growth in their net result (or reduction in their net deficit), with only four entities delivering a loss before income tax, compared to six in 2013–14.
Despite the improvement in short-term results for the majority of the sector, when analysing risks to financial sustainability there are weak liquidity risk results for the metropolitan and regional urban water entities given the quantum of short-term debt held, and longer-term risks associated with the sector's ability to replace/renew assets and to repay debt.
Findings
• The commencement of the former Fairer Water Bills initiative led to rebates or tariff reductions being provided to Victorian customers, effective 1 July 2014.
• In 2014–15, dividends paid by the four metropolitan water entities totalled $120.8 million, an increase of $82.4 million on 2013–14. No interim dividend was determined for Melbourne Water for 2014–15 due to an outstanding income tax related matter.
• At 30 June 2015, the sector controlled $42.9 billion in total assets—$41.9 billion at 30 June 2014—and had total liabilities of $20.4 billion—$20.2 billion in 2014.
2.1
Introduction
This Part looks at the collective 30 June 2015 financial position of the 19 water entities. It details the main drivers behind the net results achieved, and analyses the sector's financial sustainability risks.
Accrual-based financial reports enable an assessment of whether water entities generate sufficient surpluses from their operations to maintain services, fund asset maintenance or renewal and repay debt. Their ability to generate surpluses is subject to the regulatory environment in which they operate and their ability to minimise costs and maximise revenue.
An entity’s financial performance is measured by its net profit or loss—the difference between its revenues and expenses. An entity’s financial position is measured by reference to its net assets—the difference between its total assets and total liabilities.
2.2
Conclusion
The financial performance of the water sector has shown an improvement for the 2014–15 reporting period.
The sector generated a combined net profit before income tax of $430.6 million for the year ended 30 June 2015, an increase of $109.7 million from the prior year. Fifteen water entities reported a growth in their net result (or reduction in their net deficit), with only four delivering a loss before income tax, compared to six in 2013–14.
Despite the improvement in short-term results for the majority of the sector, when analysing risks to financial sustainability there are weak liquidity risk results for the metropolitan and regional urban water entities given the quantum of short-term debt held, and longer-term risks associated with the sector's ability to replace or renew assets and to repay debt.
2.3
Financial overview of the sector
2.3.1
Financial performance
Figure 2A provides an overview of the financial performance and position of the Victorian water sector for the current and prior period, by relevant cohort— metropolitan, regional urban and rural.
V
Financial overview of the sector
Note: The above balances and transactions are derived directly from the published annual reports, therefore do not eliminate inter-sector entity transactions, nor have they been adjusted for the combined errors to infrastructure assets and the infrastructure asset revaluation reserve of $1 347.2 million for
30 June 2015 ($417.0 million for 30 June 2014), as a result of the metropolitan water entities qualification. Refer to Part 1 of this report for further detail.
Note: Numbers may vary slightly due to rounding.
Source: Victorian Auditor-General’s Office.
2013–14 2013–14 2013–14
Fixed and variable charges levied by Melbourne Water to retailers (a) 1 326.9 1 375.4 1 326.9 1 375.4 0.0 0.0 0.0 0.0
Other 604.9 523.8 427.3 356.2 51.3 54.2 126.3 113.4
Total 5 552.1 5 579.8 4 197.7 4 284.1 1 070.0 1 032.7 284.4 263.1 Percentage of total 100% 100% 75.6% 76.8% 19.3% 18.5% 5.1% 4.7% Expenses
Employee benefits 533.1 528.8 235.2 234.0 214.3 214.1 83.6 80.8
Depreciation and amortisation 988.5 947.9 584.6 552.6 321.4 313.5 82.4 81.8
Operating, administrative and other expenses 1 212.5 1 230.9 739.5 734.0 342.0 346.3 131.0 150.6
Finance costs 1 116.7 1 126.1 968.6 977.9 138.3 138.1 9.8 10.1
Fixed and variable charges levied by Melbourne Water to retailers (a) 1 270.6 1 425.2 1 270.6 1 425.2 0.0 0.0 0.0 0.0
Total 5 121.5 5 259.0 3 798.6 3 923.7 1 016.0 1 012.0 306.9 323.3 Percentage of total 100.0% 100.0% 74.2% 74.6% 19.8% 19.2% 6.0% 6.1% Net result
Net result before tax 430.6 320.9 399.0 360.4 54.0 20.7 -22.4 -60.2
Net result after tax 312.2 224.4 286.1 253.7 41.5 12.7 -15.8 -41.9
Financial position Assets
Cash and cash equivalents 374.2 398.2 44.4 112.4 150.5 91.6 179.3 194.2
Receivables 736.9 723.8 511.2 488.6 195.8 193.8 29.9 41.4
Infrastructure assets, intangible assets, property, plant and equipment
and w ork in progress 41 699.2 40 698.3 24 488.4 23 579.0 11 790.8 11 712.7 5 420.0 5 406.5
Other 137.7 126.7 86.7 74.0 47.2 46.9 3.7 5.9
Total 42 947.9 41 947.0 25 130.7 24 254.0 12 184.3 12 045.1 5 632.9 5 647.9 Percentage of total 100.0% 100.0% 58.5% 57.8% 28.4% 28.7% 13.1% 13.5% Liabilities
Payables, accruals, provisions and other liabilities 1 079.5 1 112.1 724.8 768.9 199.6 199.6 155.0 143.6
Interest bearing liabilities (includes finance lease) 14 791.3 14 645.0 12 512.6 12 374.2 2 144.6 2 113.7 134.1 157.2
Net deferred tax liabilities 4 577.9 4 429.0 2 833.6 2 692.0 1 076.8 1 062.8 667.6 674.2
Total 20 448.7 20 186.1 16 071.0 15 835.1 3 421.0 3 376.1 956.7 975.0 Percentage of total 100.0% 100.0% 78.6% 78.4% 16.7% 16.7% 4.7% 4.8% Equity
Contributed capital 9 119.2 9 052.3 1 697.0 1 697.7 4 479.0 4 430.5 2 943.2 2 924.1
Revaluation reserve 8 508.9 8 042.6 4 562.0 4 101.1 2 173.0 2 167.6 1 773.9 1 773.9
Retained earnings 4 871.1 4 665.1 2 800.7 2 620.1 2 111.2 2 070.0 - 40.8 - 25.0
Total 22 499.2 21 760.1 9 059.7 8 418.9 8 763.3 8 668.1 4 676.2 4 673.0 Percentage of total 100.0% 100.0% 40.3% 38.7% 38.9% 39.8% 20.8% 21.5%
2013–14
2014–15 2014–15 2014–15 2014–15
Net result
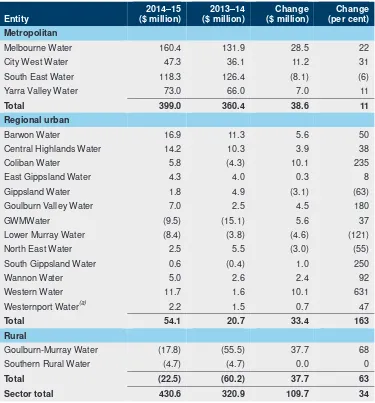
The 19 water entities generated a combined net profit before income tax of $430.6 million for the year ended 30 June 2015, an increase of $109.7 million or 34 per cent from the prior year. Figure 2B shows the net profit or loss before income tax for each entity for the past two years.
Figure 2B
Net profit/(loss) before income tax, by water entity
Entity
(a) In 2014–15, Westernport Water restated their 2013–14 net result before tax. As a result, the net result before tax comparative figure reported in the 2014–15 financial report is
$0.2 million higher than that shown in their 2013–14 financial report.
Note: Numbers may vary slightly due to rounding.
Financial outcomes
The metropolitan water cohort generated $399.0 million of this net profit before income tax—a collective $38.6 million increase on the prior year. The regional urban water entities generated a combined $54.1 million of this net profit before income tax, a $33.4 million increase on the prior year—11 regional urban water entities recorded a net profit before income tax in comparison to nine water entities in the prior year. There was also an improvement in the rural cohort where, despite recording a combined net deficit before tax of $22.5 million, one entity recorded a $37.7 million improvement to their deficit from the prior year.
The 19 water entities are subject to the National Tax Equivalent Regime (NTER) administered by the Australian Taxation Office. NTER is an administrative arrangement that results in government-owned enterprises paying a tax equivalent to the state government. The combined net profit after tax was $312.2 million, an increase of $87.8 million, or 39 per cent, on the prior year. Income tax, under the NTER, is calculated at 30 per cent—$118.4 million was incurred in 2014–15, compared with $96.5 million in 2013–14, the increase a direct result of improved financial
performance.
Revenue
In 2014–15, the 19 water entities generated revenue of $5.5 billion, a decrease of $27.7 million, or 0.5 per cent, on the prior year.
Service and usage charges increased by $57.6 million, or 1.7 per cent in comparison to 2013–14. Regional urban water entities saw the greatest increase to their service and usage charges of $41.0 million due to new customer connections and drier weather conditions increasing consumption, and a slight increase in prices in year two of Water Plan 3. The increase in service and usage charges was largely offset by the Government Water Rebate—formally the Fairer Water Bills initiative—where rebates and tariff adjustments were provided to customers.
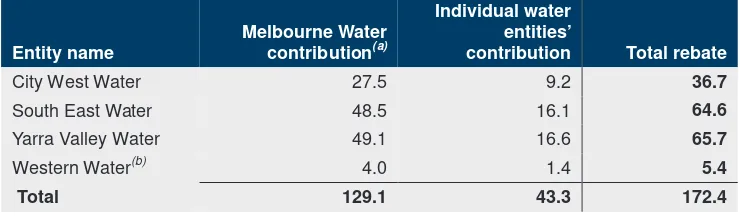
Figure 2C
2014–15 Government Water Rebate returned to metropolitan customers ($ million)
contribution Total rebate
City West Water 27.5 9.2 36.7
South East Water 48.5 16.1 64.6
Yarra Valley Water 49.1 16.6 65.7
Western Water(b) 4.0 1.4 5.4
Total 129.1 43.3 172.4
(a) $56.6 million of the total contribution by Melbourne Water was recognised in 2013–14 as it related to savings in that year, however, was paid to the water retailers and Western Water in the 2014–15 reporting period.
(b) Western Water eligible customers were captured in the Melbourne Water boundaries for the provision of this rebate.
Source: Victorian Auditor-General's Office.
Melbourne Water is the wholesaler of Melbourne's water supply and is responsible for managing catchments, managing waterways and major drainage systems, treating water and transferring the water to the metropolitan water retailers—City West Water, South East Water and Yarra Valley Water. The costs incurred by Melbourne Water for these activities are charged to the metropolitan water retailers by way of bulk water and sewerage charges, which are approved by the Essential Services Commission. Bulk water and sewerage charges, including rebates, levied by Melbourne Water, to the metropolitan water retailers also decreased by approximately $48.5 million due to their contribution of the Government Water Rebate in 2014–15, and a reduction in prices levied to take into account lower desalination plant contract costs as a result of the savings from refinancing that took place in 2013–14.
The further decrease in revenue was partially offset by an increase in developer contributed assets and new customer contributions of $66.6 million, or 22.1 per cent, across the metropolitan and regional urban cohorts, which was driven by an increase in developer activities during the year.
Expenses
In 2014–15, the 19 entities incurred $5.1 billion in total expenditure, a decrease of $137.5 million, or 2.6 per cent, from the prior year, predominantly due to:
• bulk water charges paid by the metropolitan retail water entities to Melbourne Water decreased by approximately $155 million, largely due to Melbourne Water's contribution to the Government Water Rebate offsetting the cost by $125.1 million, and the reduction in prices as a result of the desalination plant contract cost savings
Financial outcomes
• finance costs decreased by $9.4 million, or 0.8 per cent, largely due to Melbourne Water holding lower average borrowings as a result of repaying maturing debt and a further decrease from the desalination plant refinancing savings—while Melbourne Water's interest expense decreased by $20.4 million, this was offset by the metropolitan water retailers, as their finance costs increased by a combined $11.1 million, due to an increase in average borrowings held to fund capital and other obligations
• depreciation and amortisation increased by $40.6 million, or 4.3 per cent, due to the growth in infrastructure, property, plant and equipment balances of water entities from prior year revaluation increments and capital additions.
Dividends
The 19 entities are obliged to pay a dividend to the state if the Treasurer, after consultation with the governing board and responsible minister, makes a formal determination to do so. In the past, only the metropolitan water entities, as for-profit entities, have been required to pay a dividend. The regional urban and rural water entities have not been required to make a dividend payment in part due to historical operating results generated.
Dividends are generally paid twice a year based on a prescribed percentage of the net profit before tax:
• an interim dividend determined in April based on half-year financial results
• a final dividend determined in October based on annual financial results.
In 2014–15, dividends paid by for the four metropolitan water entities totalled $120.8 million—an increase of $82.4 million, or 215 per cent, on 2013–14. This excludes a dividend payment by Melbourne Water on 31 July 2013 of $94.5 million relating to their 2011–12 final dividend.
Figure 2D
Interim and final dividends paid over the past two years
Year
Final dividends paid in respect to the prior period ($ million)
Interim dividends paid in respect to the current period
($ million) Total
2013–14(a) 38.4 – 38.4
2014–15 87.7 33.1 120.8
Total 126.1 33.1 159.2
(a) This figure excludes $94.5 million for a final dividend paid by Melbourne Water in respect of the 2011–12 reporting period, on 31 July 2013.
Source: Victorian Auditor-General's Office.
It is important to note that no interim dividend has been determined for Melbourne Water in relation to 2014–15. At the date of this report, an interim dividend was only 'proposed' by the Treasurer of Victoria in June 2015. Melbourne Water requested a deferral of the determination until the resolution of an income tax related matter regarding the Victorian Desalination Plant––resolution expected by Melbourne Water on this matter in December 2015.
2.3.2
Financial position
Assets
At 30 June 2015, the 19 water entities had assets of $42.9 billion, an increase of $1.0 billion, or 2.4 per cent, compared to the prior year. Property, plant, equipment and infrastructure assets represented 97.1 per cent of total assets.
A $1.0 billion increase in the value of property, plant, equipment and infrastructure assets occurred at 30 June 2015, predominantly driven by:
• significant revaluation increments of the metropolitan water entities:
• $332.3 million at South East Water on infrastructure assets
• $152.4 million at Melbourne Water on land
• $64.9 million at Yarra Valley Water on infrastructure assets
• $65.8 million at City West Water on infrastructure assets and land
• additions to infrastructure assets across all cohorts.
Financial outcomes
Goulburn-Murray Water also received lower funding receipts of $17 million compared to the prior year in respect to the Connections Project. Goulburn-Murray Water assumed responsibility of the food bowl modernisation project, now referred to as the Connections Project, on 1 July 2012.
This reduction was partially offset by an increase of $58.9 million in cash and cash equivalents held by the regional urban cohort due to stronger cash flows from operating activities and some entities drawing down on deposits from the Treasury Corporation of Victoria to take advantage of lower interest rates or on previously approved financial accommodation (borrowings) to avoid foregoing access to these facilities.
Liabilities
At 30 June 2015, the water industry had combined liabilities of $20.4 billion, an increase of $262.6 million, or 1.3 per cent, on the prior year. Net deferred tax liabilities increased by $149.0 million, or 3.3 per cent, in 2014–15 and interest-bearing liabilities continued to grow by a further $146.3 million, or 1.0 per cent, during the year, largely used to fund the construction of infrastructure assets and other obligations.
The metropolitan water retail entities' interest-bearing liabilities increased by $255.8 million. South East Water contributed the largest increase primarily to take advantage of low interest rates during the year. In contrast, Melbourne Water reduced its interest-bearing liabilities by $117.3 million due to repayments of maturing loans and a further year's payment of the Victorian Desalination Plant finance lease.
Interest-bearing liabilities across the regional urban water entities increased by $30.9 million, or 1.5 per cent––six of the 13 entities increased their debt levels, while the remaining seven repaid maturing debt. The two rural water entities decreased their interest-bearing liabilities––Goulburn-Murray Water repaid $22.1million in total.
2.4
Risks to financial sustainability
2.4.1
Financial sustainability
To be financially sustainable, entities need the capacity to meet their current and future expenditure as it falls due. They also need to be able to absorb the financial impacts of changes and financial risks that materialise, without significantly changing their revenue and expenditure policies.
In this Section, we provide insight into the financial sustainability risks of the water sector at 30 June 2015, and trends over a five-year period. The indicator results are calculated using the financial transactions and balances of each entity's statutory financial report.
The indicators highlight risks to ongoing financial sustainability in either the short or longer term. However, forming a definitive view of any entity’s financial sustainability requires a holistic analysis that moves beyond historical financial considerations to also include the water entity’s financial forecasts, strategic plans, and their operations and environment, including the regulatory environment.
We use seven financial sustainability risk indicators taken over a five-year period to assess the financial sustainability risks in the water sector. Appendix C describes the financial sustainability indicators, risk assessment criteria and benchmarks used.
2.4.2
Overall assessment
Figure 2E provides a 'snapshot' of the seven indicator results in sector aggregate and by cohort, against the industry average for the past five years.
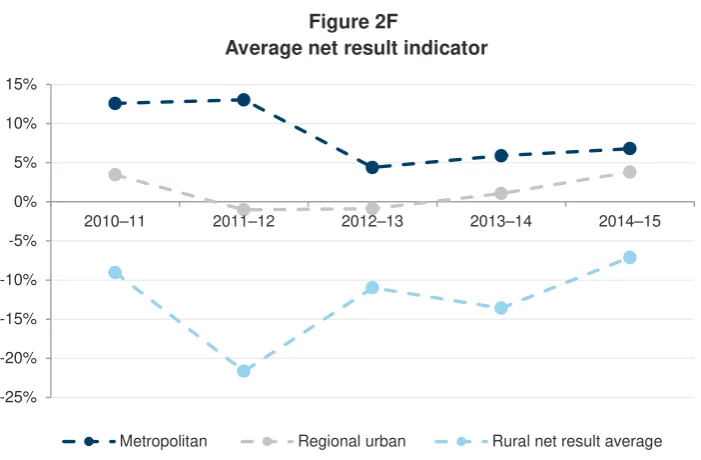
Figure 2E
Financial sustainability snapshot of the sector
Note: A red result shows a high-risk assessment, orange a medium-risk assessment and green a low-risk assessment.
Note: In relation to the 'debt service cover indicator', where any entity has not made an actual repayment of their debt, this indicator will result in an 'NA' outcome for the sector and relevant cohort. Refer to Appendix C for further detail.
Source: Victorian-Auditor General's Office.
The sector results for 2014–15 have been positive for the following indicators:
• Net result—as discussed in Section 2.3.1, the water sector has shown an
improvement in financial performance for the 2014–15 reporting period, on an already positive result in the prior year.
• Interest cover ratio—water entities have maintained an adequate level of
interest cover over the 2014–15 year and trend period. While debt levels and finance costs have increased, the sector continues to generate sufficient cash flows from operations to service their debt––meeting interest and financial accommodation levy payments.
Sector average Sector average Metropolitan Regional urban Rural average
Indicator 2010–11 to 2014–15 2014–15 average 2014–15 average 2014–15 2014–15
Net result 1.36% 3.29% 6.80% 3.81% -7.11%
Interest Cover Ratio 6.44 6.25 2.41 6.20 14.23
Liquidity Ratio 0.82 0.99 0.54 1.08 1.34
Internal Financing Ratio 69.13% 97.63% 64.90% 110.68% 78.25%
Capital Replacement Ratio 1.64 1.28 1.93 1.10 1.15
Debt to Assets 0.19 0.20 0.46 0.15 0.02
Financial outcomes
• Internal financing ratio—this indicator assesses the ability of water entities to
set aside a portion of their cash flows from operating activities to finance capital investment. Consistent with the benchmark set by the Essential Services Commission, 35 per cent of cash flows received from operations is deemed a prudent level, noting that water entities have the ability (and the expectation given the regulatory pricing structure) to borrow funds. All cohorts have reported a result in excess of 35 percent over the review period for this indicator.
Nevertheless, we have seen the level of borrowings increase across the sector by 29.3 per cent, from $8 billion in 2010–11 to $10.4 billion in 2014–15, where three metropolitan retail and five regional urban water entities have not repaid any debt. Refer to Part 4 for further detail.
• Debt to assets—all cohorts have maintained an adequate level of gearing over
the period as the combined debt portfolio of $14.8 billion is substantially lower than the total asset base of $42.9 billion––infrastructure, property, plant and equipment make up $41.7 billion. This positive result is largely driven by the nature and significant value of the sector's asset base, given regular asset revaluations and continual capital renewal projects.
Despite the aggregate results, each of the cohorts face individual challenges––the metropolitan cohort reported a high-risk liquidity result, the regional urban cohort reported a medium-risk capital replacement outcome, and the rural cohort reported a medium-risk net result and capital replacement outcome for the period.
The metropolitan cohort and the regional urban cohort have also been assessed as having 'N/A' results for the debt service cover indicator, given some entities within these cohorts have not made repayments on their borrowings. The following Section addresses the higher-risk indicator results in further detail.
2.4.3
Short-term indicators
The short-term indicators––net result, liquidity and interest cover––focus on a water entity's ability to maintain positive operating cash flows and adequate cash holdings, and to generate an operating surplus over the short term.
The water sector has shown an improvement in their performance, reducing the risk of financial issues in the short term. However, there are still some parts of the sector that face losses from operations and less than desirable liquidity results. These factors are explored in more detail below.