ANALYSIS OF THE FACTORS AFFECTING 3D MODELS RESOLUTION.
APPLICATION TO THE RECORDING OF VAULTS I
N SANGALLO’S HOUSE
G. Tucci*, V. Bonora, N. Guardini
Geco Lab., Dept. of Civil and Environmental Engineering, University of Florence, Italy [email protected]
KEY WORDS: 3D Models, Laser Scanning, Resolution, Accuracy, Surface Comparison, Topography.
ABSTRACT:
The paper will present the extraction of information from a laser scanning survey aimed to support historical studies on the Sangallo's house in Florence. In order to verify some study's hypothesis related to the building history and constructive techniques, high resolution models were needed. The meaning of "resolution" applied to 3D scanning will be briefly discussed stressing the difference between resolution and accuracy.
Starting from the analysis of technical specifications of the used instruments, the expected performance of the model is described. The results obtained from acquired data are shown and the paper will conclude proposing some answers to the historian's questions.
1. INTRODUCTION
Laser scanner survey is generally aimed to provide a reality description as realistic as possible. Large improvements in hardware and software tools have allowed to produce effective and efficient 3D models, to be used for investigations once conducted on the real object or in physical spaces. In most virtual reality environments, which intend to replace physical reality, measurements are quite hidden and coordinates seem to be less related to positions and dimensions, and more just a way to represent data in a software tool.
Geomatic techniques today have to focus not only on positioning problems, but on high level of detail surface descriptions too. The experience described in the following paragraphs highlights the need of a correct integration between positioning and surface description techniques: topographical net for data referencing and laser scanning for surface modelling.
2. THE NEED FOR A GEOMATIC SURVEY
2.1 The Sangallo’s house in Florence
The house that Giuliano and Antonio da Sangallo built for themselves in Borgo Pinti, Florence, is now known as Palazzo Ximenes-Panciatichi and it has never been studied systematically. In 1902 Cornelius von Fabriczy (von Fabriczy 1902) published some documents about it, but since then no further research has been carried out on the history of the building or on its material structure. Recent document researches and detailed surveys concerning a few rooms allow to shine a new light on the history of the house and the techniques used to build it. The land was purchased by Giuliano and Antonio between 1490 and 1491, but the building works advanced slowly. When the two brothers wrote their last wills, the building was still unfinished. After Giuliano’s death in 1516 and Antonio’s death in 1534, the property of the house passed from one member of the family to the other, and in 1603 it was sold to Sebastiano Ximenes, a Portuguese merchant linked to the Grand Duke’s court. He restored the building and started its enlargement. Further enlargements and modifications were
made during the 17th century and especially in the 18th and 19th century (Belli, 2012). These work campaigns transformed the original building - enclosed in a square area with a side of 40 braccia fiorentine (a unit of measurement equal to approx. 58 cm, that means a side of approx. 23 m) and built up on just two floors – into a wide stately palace, enriched with a big garden and built up on four main floors.
2.2 The vaults under study
Despite the alterations, the most ancient nucleus of the palace is still easy detectable today. It is characterized by a perfectly symmetric U structure, which develops around a wide cross double-height room. On the back, on the sides of the loggia facing the garden, there are two equal rooms, covered by barrel vaults with stucco decorations. The kind of decoration and the technique used are typical of Sangallo, and in fact these vaults have always been considered as the few original elements that survived transformations. Instead, not enough attention has been paid to the big barrel vault covering the central room.
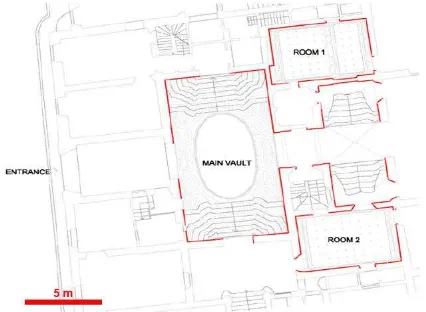
Figure 1. Plan of the original nucleus of the Sangallo’s House in Florence. In red you can see the rooms subject to the survey campaign with laser scanner described in this report, while the
representation of the adjacent rooms has been inferred by a previous survey (by Arch. Ilaria Filippini). ISPRS Annals of the Photogrammetry, Remote Sensing and Spatial Information Sciences, Volume II-5/W1, 2013
The vault of the central room: Altered by 18th-century banded decorations, the vault has been considered as an intervention occurring later than the first building phase (Marchini 1942). But the strict analogies between the plan of the house in Borgo Pinti and the plan of the villa in Poggio a Caiano, designed by Giuliano da Sangallo for Lorenzo de’ Medici in the same years, lead us to believe that the vault had always been there. In Poggio a Caiano too, in fact, the most important room is made up of a big transverse room, covered by an impressive barrel vault.
The Sangallo origin of the vault in Borgo Pinti is supported also by another evidence. In the Life of Giuliano da Sangallo, in fact, Vasari included an anecdote according to which to convince Lorenzo to build a big barrel vault in the room of Poggio a Caiano, the architect built a similar vault in his own house (Vasari, 1878-1881). So, when Vasari wrote the Lives (published for the first time in 1550), the vault should have already been built and noticed by him, as he surely knew the Sangallo’s house being a friend of Francesco, Giuliano’s son. The vault is smaller in size, but it can be compared to the one in Poggio a Caiano (approx. 13.50 m x 6.90 m against 19.80 m x 10.50 m), and additionally they seem to have been built through a single concrete casting, as you can see by inspecting the extrados. It is an ancient technique, which has been brought from Rome to Florence by Giuliano da Sangallo, according to Vasari (Vasari, 1878-1881).
The measurement of the vault’s thickness is an objective factor to ascribe the vault to Sangallo: therefore, it has been one of the goals of the survey project.
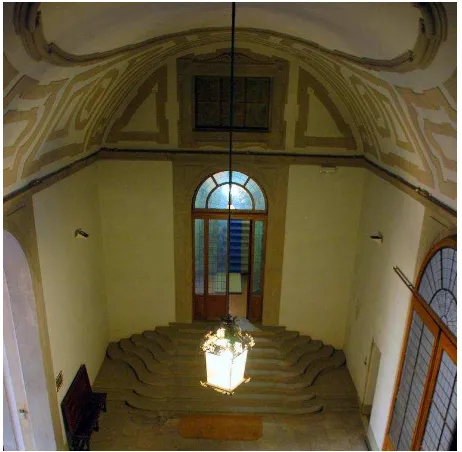
Figure 2. The vault of the central room
The vaults of the minor rooms: The direct surveys on the vault covering the minor room at south, which were carried out through a hole in the decoration, proved that also this structure is made of concrete and the material used to built it is similar to the one of the bigger vault. The vault seems to bear no load, as over the casting (whose keystone is 11 cm thick) we noticed a wooden element, probably the joist of a slab. Instead, it was not possible to carry out a similar inspection on the vault of the room at north, as the decoration there has no holes and it is impossible to access the extrados (unlike the previous case). Only contactless techniques can be applied in order to better
study the analogies between the two vaults, therefore the choice fell on a laser scanner survey. Surface models coming from both rooms have been compared.
Figure 3. The vault of one minor room
The laser scanner survey: We used an HDS 6000 laser scanner (Leica Geosystems). We can consider the vaults as very favourable surfaces to be scanned: they are made by plaster and they have light colour.
As we needed to record a 3D model with a high level of detail, we had to consider laser scanner specifications relative to accuracy and beam diameter, and to plan correctly scan resolution.
In the following paragraphs we focus on factors affecting the final resolution of 3D models: scan density, recorded level of detail, beam related effects. In paragraphs 5 and 6 we will answer questions coming from historians, thanks to the 3D models we produced.
3. DIFFERENT MEANINGS OF RESOLUTION
High resolution's 3D models are frequently requested by users, as it's the case of historians studying the Sangallo's house. While it is a widely used term, ASTM Committee E57 (ASTM 2011) doesn't provide, still now, any definition related to 3D imaging systems for the term "resolution". It is commonly used in different ways (Jacobs, 2005):
Scan density: it refers to the space between adjacent measured points. For time of flight scanner it is defined controlling the angular increment of rotating mirrors; for phase-based scanners it is based on the frequency of measurements sampling that is done from a continuous laser source.
Minimum measurement increment for range and/or angular measurements that a scanner is capable of resolving.
Capability of resolving fine object features from scan data. As stated from (Boehler et al., 2003) two different laser scanner specifications contribute to this ability: the smallest possible increment of the angle between two successive points and the size of the laser spot on the object.
In order to make the required comparison between the surface models, we needed “high resolution” models. The term resolution is used, in this context, from an end user point of view and it is related to a general performance of the hardware and software system adopted.
3.1 Resolution does not equal accuracy
In any case resolution doesn’t equal accuracy (JCGM, 2008). The accuracy of a laser scanner is composed of a combination of errors in distance and angles measurements.
Even though standards for investigations and tests of laser scanning systems still need to be defined, and simple and possibly low cost calibration methods must be found, several studies investigate laser scanner accuracy (Boehler et al. 2003) (Ingensand et al., 2003) (Lichti et al., 2007) (Mechelke et al., 2007) (Russo et al., 2007) (Kersten et al., 2008). These usually refer to calibrated objects (often to plane objects).
Data evaluation cannot be done directly on the recorded measurements: scanning systems acquire a big amount of data in a short time, but they are not able to refer measurements to relevant features or specific targets. Therefore data assessment – deviations from known or pre-defined geometries – is done on the basis of objects extracted from surface models.
4. ANALYSIS OF TECHNICAL SPECIFICATIONS OF THE ADOPTED LASER SCANNER
Accuracy. The producer of the scanner we used for the Sangallo’s survey (HDS 6000, Leica Geosystems) provides accuracy specifications (1 sigma) for data acquired up to 25 meters, and up to 50 meters. Considering the operative range of the described survey, we can take into account only the first ones:
- distance: 4-5 mm (depending on the surface's albedo); - angle (both horizontal and vertical): 125 microradians. They also provide a "modeled surface precision" (2-3 mm, depending on the surface's albedo). It is clear that this value is subject to modeling methodology, but we can assume it as a reference for scanning noise (that is a value related to an accidental error).
Figure 4 graphically summarizes accuracy values for HDS 6000 scanner, considering the intrinsic reference system of the scanner and analyzing the 3D accuracy of a point measured along the Y axe (in order to show simple values), at a distance of 25 m:
σX= σZ= d σα ~ 3 mm
σY= σd~ 5 mm
Figure 4. The accuracy of laser scanner is composed of a combination of errors in distance and angles measurements.
One sigma positioning accuracy, HDS 6000 laser scanner.
Beam diameter. Although the term "spot size" is often used to mean the dimension of the laser beam, according to ASTM Standard Terminology for Three-Dimensional Imaging Systems (ASTM 2011), it is preferable to refer to "beam diameter". For a laser beam with a circular irradiance pattern, the beam diameter
is the extent of the irradiance distribution in a cross section of the laser beam (in a plane orthogonal to its propagation path). The diameter is usually measured at 1/e2 point, where e is the base of the natural logarithm (Figure 5).
Figure 5. Gaussian laser beam with a circular cross section
A not well focused spot, or a very little detail on the object could define a “mixed-pixel” effect (Tang et al., 2007). It is quite common along the edges of the features: wrong points may be recorded because while a part of the spot is reflected by one surface, another part of the spot is reflected by a different surface.
Figure 6. “Mixed pixel” effect
Technical specifications for HDS 6000 consider a Gaussian beam, with a divergence linearly increasing: 3 mm at exit and a divergence of 0,22 mrad.
Figure 7. Beam diameter, increasing with range. In orange, the operative range for the Sangallo’s house survey.
It is clear that working with medium-long range (40-70 meters, for a phase-based laser scanner as the HDS 6000) the level of detail of acquired data is strongly affected by the beam dimension on the surface (Jacobs, 2006). Figure 8 shows, on a different case study, that it's not possible to balance the effect ISPRS Annals of the Photogrammetry, Remote Sensing and Spatial Information Sciences, Volume II-5/W1, 2013
due to a quite big beam diameter (or a long range) with a higher resolution, since it only produces an oversampling.
Figure 8. Pistoia, Basilica dell’Umilta (Laser scanner survey by GeCo Lab., 2008). Two different details have been acquired
from different distances, setting the scan density in order to obtain almost the same number of points in both models: the
surface model’s quality is affected by beam diameter, that increase with distance.
Scan resolution. Our scanner allows only preset resolution steps, as shown in Figure 9.
In the Sangallo's house survey, we set the scan resolution according to the mean distance to the vault surfaces, using Middle or High preset values.
Figure 9. Angular preset resolution for HDS 6000 scanner and corresponding linear distances between measured points
The ability to record small details is related to accuracy and to beam diameter; both these parameters are distance related (Pesci et al., 2011). As we acquired data from short or very short distances (shorter than 7 meters for the big vault and shorter than 4 meters in the small vaults), we can state that the adopted instruments meets the requirements of this case study.
5. WHAT’S THE BIG VAULT’S THICKNESS? THE ANSWER FROM CLASSICAL TOPOGRAPHY
We needed some information on the exact geometry of the vaults to confirm the hypothetical building techniques and to support the hypothesis that the coverage of the central space
dates back to the first (Sangallo-style) phase of the works. In order to investigate the constructive technique, without invasive analysis, it was necessary to survey a small portion of accessible extrados on the first floor.
Five topographical stations have been connected on the basis of overabundant observations and their coordinates have been computed by least square adjustment method (with residuals smaller than 1 cm). The design of the topographic framework was carried out to meet the specific needs of the project, i.e. defining the correct mutual position of rooms that are not directly connected. In particular, we needed to connect the rooms on the first floor with the ground floor and to position the minor room at north (Room 1, in Figure 1), whose access door from the loggia has been infilled.
The answer. Since the extrados and intrados data have a common reference system, it is easy to establish the thickness of the reins of the big vault: it is approximately 28 cm. This information confirms the direct observation of a small portion of accessible extrados and the fact that the vault was built entirely through casting and not with bricks.
Figure 10. The orthoimage of the point model show that the thickness of the reins of the big vault is
approx. 28 cm
6. HOW MUCH ARE SIMILAR THE SMALL VAULTS? THE ANSWER FROM LASER SCANNING
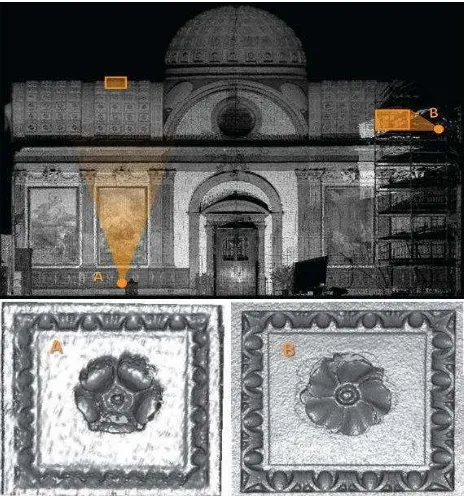
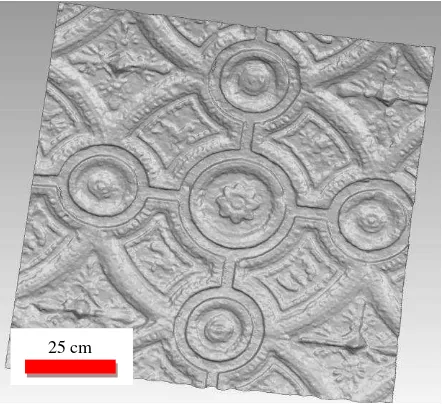
With the aim of hypothesizing a date for the two smaller rooms, we analysed the stucco decoration by means of mesh models (Figure 11 and 12). On their intrados we always noticed a decoration module made up of a circular crown containing four small figures, which is crossed by four smaller circles. This motif was made by impressing in succession a square mould (maybe of wood) with a side of one braccio (approx. 58.6 cm) onto a very thin layer of mortar plaster. The particularly detailed 3D survey of the intrados available allows to compare (by overlapping them) a couple of modules extracted from the two vaults, in order to check whether the same mould was used (Figure 13) and thus have another useful element to date these structures.
The answer. The analogy between the decorations confirms the hypothetical reuse of the same mould, even if in one of the rooms small stucco pyramids have been added to the corners of the square tiles to mask the junction of the adjacent impressions. Even though it is not possible to date the construction or decoration of the vaults, they can be considered as coeval or built within a relatively short period of time. ISPRS Annals of the Photogrammetry, Remote Sensing and Spatial Information Sciences, Volume II-5/W1, 2013
Figure 11. A detail of the surface model – Room 1
Figure 12. A detail of the surface model – Room 2
Figure 13 – The displacement map shows only small differences between the decorations coming from the two rooms; some decay in the plaster should be considered (medium distance
between surfaces is 6 mm; standard deviation is 1 cm)
7. CONCLUSIONS
We are working on the documentation project of the Sangallo’s house in a multi-disciplinary team, including both geomatics and historian researchers. This paper highlights geomatic contribution, aimed to provide objective and effective information to:
- correctly define the relationship between non-intervisible rooms,
- verify historical hypotheses,
- better understand constructive techniques, limiting destructive investigations as much as possible.
We defined a network of control points with topographic measurements, and we made a laser scanner survey. In order to better plan the data acquisition phase, we previously analysed technical specifications of the instrument. Since high resolution models were required we focused on factors influencing model's level of detail: measurement accuracy, beam dimension, scan resolution.
We elaborated metric data with different techniques, in order to be able to answer, time to time, to different questions proposed by our historian colleagues.
REFERENCES
References from Journals:
Pesci, A., Teza, G., Bonali, E., 2011. Terrestrial Laser Scanner Resolution: Numerical Simulations and Experiments on Spatial Sampling Optimization. Remote Sensing, 3, pp. 167-184.
References from Books:
von Fabriczy, C. 1902. Giuliano da Sangallo, “Jahrbuch der Königlich PreussischenKunstsammlungen”. XXIII, Beiheft, pp. 1-42.
Marchini, G. 1942. Giuliano da Sangallo, Firenze, Sansoni.
Vasari, G., (1568). Le vite de’ più eccellenti pittori scultori ed architettori, in Le opere di Giorgio Vasari, a cura di G. Milanesi, Firenze, Sansoni, 1878-1881, IV, pp. 271, 291.
References from Other Literature:
ASTM, 2011. Standard Terminology for Three-Dimensional (3D) Imaging Systems, E2544 − 11a.
Belli, G. (forthcoming). La casa di Giuliano e Antonio da Sangallo in borgo Pinti, in Giuliano da Sangallo, Proc. of the 26th Seminario Internazionale di Storia dell’Architettura, Vicenza, Centro Internazionale di Studi di Architettura Andrea Palladio, 7-9 Jun. 2012.
Belli G., Bonora V., Guardini N., Güleç Korumaz A., Tucci G., Architectural Survey of The Vaults of Sangallo's House in Florence. Proceedings of the 1st International Congress ICONARCH, "Architecture and Technology", Konya, Turkey, November 15-17 2012, Selçuk University Department of Architecture & Selcuklu Municipality of Konia, 2012, ISBN 978-978-605-86483-9, pp. 415-427
Boehler, W., M. Bordas, V., Marbs, A., 2003. Investigating laser scanner accuracy. Proceedings of XIXth CIPA Symposium,
Antalya, Turkey, 30 Sep. – 4 Oct.
http://cipa.icomos.org/fileadmin/template/doc/antalya/189.pdf (15Apr. 2013).
25 cm
25 cm
Bonora, V., Chieli A., Spanò, A., Testa, P., Tucci, G., 2003. 3D metric modelling for knowledge and documentation of architectural structures (Royal Palace in Turin). The International Archives of the Photogrammetry, Remote Sensing and Spatial Information Sciences, Vol. XXXIV, Part 5/W12, pp. 60-65.
Bonora, V., Spanò, A., 2004. Strutture voltate: rilievo laser scanning e modellazione delle geometrie. in Proc. of the
Workshop “Tecnologie per Comunicare l'Architettura”,
Ancona, 20-21-22 May (on CD-Rom).
Guarnieri, A., Remondino, F., Vettore, A., 2006. Digital photogrammetry and TLS data fusion applied to Cultural Heritage 3D modeling. International Archives of Photogrammetry, Remote Sensing and Spatial Information Sciences, Vol. XXXVI, part 5 (on CD-Rom). ISPRS Commission V Symposium, Dresden, Germany.
Guidi, G., Bianchini, C., 2007. ToF laser scanner characterization for low range applications. Low-cost characterization of 3D laser scanners. Proceedings SPIE 6491, Videometrics IX, 649109, doi:10.1117/12.705288.
Ingensand, H., Ryf, A., Schulz, T., 2003. Performances and Experiences in Terrestrial Laserscanning. Optical 3-D Measurement Techniques VI, Grün/Kahmen (Eds.), pp. 236-243.
Joint Committee for Guides in Metrology (JCGM), 2008. International Vocabulary of Metrology, Basic and General Concepts and Associated Terms (VIM), III ed., Pavillon de Breteuil : JCGM 200:2008
Kersten, T.P., Mechelke, K., Lindstaedt, M., Sternberg, H., 2008. Geometric Accuracy Investigations of the Latest Terrestrial Laser Scanning Systems. Proceedings of FIG
Working Week 2008, Stockholm, Sweden 14-19 June
http://fig.net/pub/fig2008/papers/ts02d/ts02d_01_mechelke_etal _2785.pdf (15Apr. 2013).
Lichti, D.D., Stewart, M.P., Tsakiri, M., Snow, A.J., 2000. Calibration and testing of a terrestrial laser scanner. IAPRS, Vol. XXXIII, Part B5/2, pp 485-492.
Mechelke, K., Kersten, Th., Lindstaedt, M., 2007. Comparative Investigations into the Accuracy Behaviour of the New Generation of Terrestrial Laser Scanning Systems. Proceedings of 8th Conference on Optical 3D Measurement Techniques,
Gruen& Kahmen (Eds.), Zurich, July 9-12, Vol. I, pp. 319-327.
Russo, M., Morlando, G., Guidi, G., 2007. Low-cost characterization of 3D laser scanners. Proceedings SPIE 6491, Videometrics IX, 649107; doi:10.1117/12.705712.
Tang, P., Huber, D., Akinci, B., 2007. Comparative Analysis of Depth-Discontinuity and Mixed-Pixel Detection Algorithms. 3DIM'07, Proc. of Sixth International Conference on 3-D Digital Imaging and Modeling, pp. 29-38.
References from websites:
Jacobs, G., 2005. Understanding laser scanner terminology. Professional Surveyor Magazine, II/2005 http://www.profsurv.com/magazine/article.aspx?i=1377 (15 Apr. 2013).
Jacobs, G., 2006. Understanding spot size for laser scanning. Professional Surveyor Magazine, X/2006 http://hds.leica-geosystems.com/hds/en/Prof_Surv_Spot_Size_Oct06.pdf (15 Apr. 2013).
Acknowledgements
The laser scanner survey has been performed whit the helpful cooperation of the Architects A. Gulec Korumaz and M. Korumaz, during their stage at GeCo Lab.
The authors gratefully thank Prof. G. Belli for proposing such an interesting case study and for posing the interesting questions that originated the analysis presented in the paper. For the courtesy, Antonio Becherucci and Klaudia Krainz. Investigations on the vaults have been done in collaboration with the restorer Paola Rosa.