Full Terms & Conditions of access and use can be found at
http://www.tandfonline.com/action/journalInformation?journalCode=ubes20
Download by: [Universitas Maritim Raja Ali Haji] Date: 13 January 2016, At: 00:47
Journal of Business & Economic Statistics
ISSN: 0735-0015 (Print) 1537-2707 (Online) Journal homepage: http://www.tandfonline.com/loi/ubes20
The Effects of Public R&D Subsidies on Firms'
Innovation Activities
Matthias Almus & Dirk Czarnitzki
To cite this article: Matthias Almus & Dirk Czarnitzki (2003) The Effects of Public R&D Subsidies on Firms' Innovation Activities, Journal of Business & Economic Statistics, 21:2, 226-236, DOI: 10.1198/073500103288618918
To link to this article: http://dx.doi.org/10.1198/073500103288618918
Published online: 24 Jan 2012.
Submit your article to this journal
Article views: 627
View related articles
The Effects of Public R&D Subsidies
on Firms’ Innovation Activities: The Case
of Eastern Germany
Matthias A
lmus
and Dirk C
zarnitzki
Centre for European Economic Research (ZEW), D-68034 Mannheim, Germany (almus@zew.de) (czarnitzki@zew.de)
This study analyzes the effects of public R&D policy schemes on the innovation activities of rms in Eastern Germany. The main question in this context is whether public funds stimulate R&D activities or simply crowd out privately nanced R&D. Empirically, we investigate the average causal effects of all public R&D schemes in Eastern Germany using a nonparametric matching approach. Compared to the case in which no public nancial means are provided, it turns out that rms increase their innovation activities by about four percentage points.
KEY WORDS: Nonparametric matching; Public innovation subsidies.
1. INTRODUCTION
In 1998, the German federal government spent about 2.2 billion Euro on promoting R&D activities in the busi-ness sector. Given this large amount of public R&D subsidies for innovation projects, the question arises as to whether pol-icy schemes stimulate private activities that produce positive externalities, that is, benets to society.
The economic literature on external effects indicates that innovation projects lead to market failures. Innovations are assumed to have positive external effects, but rms launch only privately protable innovation projects. Thus there may be projects that would have positive benets to society but that do not cover the private cost. Therefore, these projects are not carried out, and the quantity of innovations remains below the socially desirable level. This circumstance is the main rea-son that governments subsidize private R&D projects. Public funding reduces the price for private investors, and thus the innovations are carried out. However, a rm always has an incentive to apply for public R&D support, even if it could perform the R&D projects using its own nancial means. If public support is granted, then the rm might simply substi-tute public for private investment. This possible crowding-out effect between public grants and private investment must be taken into account when public authorities decide on the level of their engagement in R&D support programs.
This study investigates the effects of R&D subsidies in Eastern Germany, which, more than a decade after the break down of the Berlin Wall, remains a transition economy. Public authorities have been trying to accelerate the transition process from a planned economy to a market economy since the Ger-man reunication in 1990. The efforts undertaken were and still are enormous, but many industrial rms are still struggling to survive. In most regions of Eastern Germany, the number of producing rms per inhabitant is far below the average of Western Germany. Moreover, rms are mostly too small, that is, they have not reached the minimum efcient size of produc-tion. Furthermore, rms suffer from the collapse of “eastern markets,” which still induces severe sales difculties. Various programs and schemes have been set up to overcome these difculties.
For example, Ragnitz (2000) compared all subsidies granted in Eastern and Western Germany. In relation to the labor force, the amount is twice as high in Eastern Germany. Instead of the labor force, subsidies can be considered in relation to the gross domestic product. In this case subsidies are more than three times higher in Eastern Germany than in Western Germany. According to calculations of Ebling, Hipp, Janz, Licht, and Niggemann (1999), about 60% of innovating rms in Eastern Germany received public R&D funding in 1996—a percent-age six times higher than in the Western Germany. Moreover, considerably more is spent on new rms to establish a cer-tain amount of small- and medium-sized rms (SMEs), which are important for a powerful market economy (Almus 2001). These gures make examination of public R&D schemes in Eastern Germany an interesting and necessary task. There-fore, in this article we analyze whether a crowding-out effect among public R&D funds and privately nanced R&D activi-ties occurs in the Eastern German economy.
2. THIS STUDY IN THE CONTEXT
OF EXISTING LITERATURE
Several empirical studies already exist on the effects of pub-lic R&D subsidies. David, Hall, and Toole (2000) reviewed the literature on the relation between R&D subsidies and R&D expenditure on different levels of aggregation. All stud-ies reviewed aim to explore the sign and the magnitude of the “net” effect of public policies. On industry or country level, only 2 out of 14 empirical studies report that public R&D funding crowds out private R&D investment. The evidence is less clear at the rm level; 9 out of 19 studies indicate substi-tutional effects; that is, public funds crowd out private invest-ment, partially or even completely.
The difculty of this kind of analysis are potential selection biases coming from the public institutions that—depending on
©2003 American Statistical Association Journal of Business & Economic Statistics April 2003, Vol. 21, No. 2 DOI 10.1198/073500103288618918
226
the applying rm and the relevant R&D project—decide the recipients of the public funding solely. According to Busom (2000, p. 114), “This makes public funding an endogenous variable, and its inclusion in a linear regression will cause inconsistent estimates if it happens to be correlated with the error term.” Furthermore, public institutions might support only those rms and R&D projects that are expected to gener-ate extensive economic spillover effects. To estimgener-ate the “real” effects of public subsidies, it is therefore necessary to address the core evaluation question: How much would the subsidy receiving rms have invested had they not participated in a public policy scheme? In fact, only a few studies on the impact of R&D subsidies attempt to model this counterfactual situa-tion. Most of the studies surveyed by David et al. (2000) do not pay attention to this kind of selection bias.
Recently, Wallsten (2000) considered a simultaneous equa-tion model to pay attenequa-tion to the possible interdependence between public R&D funding and R&D expenditure of rms. He investigated the Small Business Innovation Research (SBIR) program and concludes that it is necessary to account for possible endogeneity of federal R&D grants. According to the results of the study, SBIR awards crowd out rm-nanced R&D spending dollar for dollar (full crowding out). The sub-sidies have no effect on R&D activities or employment. How-ever, Wallsten (2000, p. 98) mentions another possible and important impact of public funding: “: : :while the grants did not allow rms to increase R&D activity, they instead allowed rms to continue their R&D at a constant level rather than cutting back.”
Busom (2000) explored the problem of selection bias by applying a two-stage econometric treatment model in which the rst stage consists of estimating a probit model on the par-ticipation probability in public funding programs and in the second stage the R&D activity is regressed on several covari-ates, including a selection term that accounts for the differ-ent propensities of rms to be publicly funded. This second equation is estimated separately for participants and nonpar-ticipants. The difference in expected R&D expenditure of both groups is according to this approach the result of public fund-ing. Busom concluded that for most rms in her sample, pub-lic funding induced more R&D activities, but for 30% of par-ticipants complete crowding-out effects cannot be ruled out.
Lach (2000) investigated the effects of R&D subsidies granted by the Israeli Ministry of Industry and Trade on local manufacturing rms. He applied different estimators, includ-ing the before-after estimator, the difference-in-difference esti-mator, and different dynamic panel data models. Although Lach found heterogenous results from the different models applied, he nally concluded that subsidies do not crowd out company-nanced R&D expenditure completely. Their long-run elasticity with respect to R&D subsidies is .22.
Other microeconomic approaches do not focus on crowding-out effects but take different output measures into consideration. Examples include the effects of subsidies on patent applications, productivity, xed-asset investments, returns on capital, returns on sales, and growth of sales or employment (see Klette, Møen, and Griliches 2000 for a com-prehensive survey).
This study focuses on the crowding-out issue and intro-duces another empirical tool to the literature on examining
the effects of public R&D funding. We apply a nonparamet-ric matching approach that goes back to the model of poten-tial outcomes developed by Roy (1951) and Rubin (1974). These matching approaches were applied extensively in the literature on the evaluation of labor market policies, includ-ing the evaluation of active labor market programs and qual-ication measures (LaLonde 1986; Dehejia and Wahba 1999; Lechner 1999; Heckman, LaLonde, and Smith 1999). In these cases, people are the subject of the examination, and research questions include whether wages, salaries, or the probability of being hired or reemployed increase if people take part in a specic measure or program. The nonparametric matching approach applied here can clearly identify the effect that goes back to the receipt of public R&D funding, because we are able to approximate a situation with no differences between subsidized and nonsubsidized rms with respect to character-istics that inuence the probability of receiving public sup-port and carrying out private R&D. According to Hausman (2001), the matching methodology leads to more robust esti-mates of the treatment or causal effect compared with alterna-tive approaches.
A major advantage of this study is the ability to iden-tify exactly whether a rm received any subsidies for innova-tive projects. All programs launched by public authorities are incorporated, so the approach applied can reect the effects of public R&D policy schemes collectively and is not restricted to a particular measure. Many other studies deal with only one specic public R&D program and cannot control for pos-sible effects of other publicly funded research. In contrast, we can distinguish recipients and nonsupported rms in the sam-ple exactly. Our control group contains only rms that did not receive any public R&D grants. This is not the case for several other studies that analyze one specic R&D program but are not able to control for other sources of public funding. This advantage has its price, however. We are not able to track in which particular program a rm participated. We only observe whether a rm participated in any public R&D scheme under consideration. Therefore, we do not describe the R&D pro-grams in more detail. Of course, the treatments were targeting different types of rms or aims, and thus heterogeneous treat-ments exist. Hence our study can only be seen as providing broad evidence as to the overall R&D policy in Eastern Ger-many and is able to discover only average effects over differ-ent schemes.
3. DATA
The data used are taken from the Mannheim Innovation Panel (MIP) conducted by the Centre of European Economic Research (ZEW) on behalf of the German Federal Ministry for Education and Research (see Janz, Ebling, Gottschalk, and Niggemann 2001 for a more detailed description of the MIP database). The MIP is a German survey on innovation activ-ities in the business sector. It formed the German part of the Community Innovation Survey (CIS) of the European Com-mission in 1993, 1997, and 2001. Since 1993, information from about 2,500 German manufacturing rms has been col-lected in the MIP annually. We use data from the surveys in 1995, 1997, and 1999; the information collected corresponds
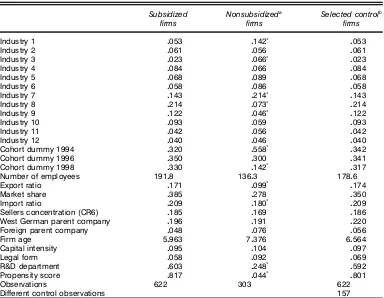
Table 1. Mean Comparisons of Subsidized Firms, Firms From the Potential Control Group Without Subsidization, and the Selected Control Groups
Subsidized Nonsubsidizeda Selected controlb
’rms ’rms ’rms
Cohort dummy 1994 0320 0558
ü
0342
Cohort dummy 1996 0350 0300 0341
Cohort dummy 1998 0330 0142
ü
0317
Number of employees 19108 13603 17806
Export ratio 0171 0099
ü
0174
Market share 0385 0278 0350
Import ratio 0209 0180
ü
0209
Sellers concentration (CR6) 0185 0169 0186
West German parent company 0196 0191 0220
Foreign parent company 0048 0076 0056
Firm age 50963 70376 60564
Capital intensity 0095 0104 0097
Legal form 0058 0092 0069
R&D department 0603 0248
ü
0592
Propensity score 0817 0044
ü
0801
Observations 622 303 622
Different control observations 157
NOTE: üindicates that the means differ with statistical signi’cance in a two-tailedttest at the 5% level between the supported ’rms (column 2) and either ’rms from the potential control group (column 3) or from the selected control group (columns 4).
aNonsubsidized ’rms of the initial sample, that is, before the matching procedure. bSelected nonsubsidized ’rms, that is, based on the matching procedure.
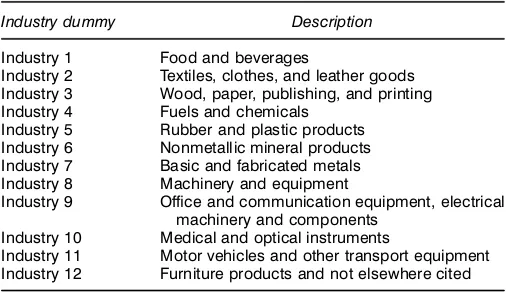
to the rms’ activities in 1994, 1996, and 1998. Firms in the survey are from almost the whole business sector and can be classied according to the European standard classication Nomenclature of Economic Activities in the European Union (NACE). We use the manufacturing sector, and thus rms in the sample belong to 12 industries that are characterized by dummies in the empirical analysis (see the Appendix). Note that only rms with at least ve employees are sampled in the MIP. In a critique of previous studies, Lichtenberg (1984) argued that the results of evaluations are often biased because the data used comprise mainly observations on large rms. The MIP data overcome this problem with many observations on small and medium-sized rms. The sample contains 925 observations on innovating rms located in Eastern Germany, of which 622 participated in public R&D schemes. Note that we use our database not as panel data, but rather as three cross-sections. Most rms (more than 70%) are observed only once in the sample; only about 8% are included in all three cross-sections. Table 1 contains descriptive information on partici-pating rms and the potential control group of nonparticipants. According to the Oslo Manual guidelines (Eurostat and OECD 1997), innovators are dened as rms that have introduced at least one product or process innovation in the past 3 years. A product or process innovation is dened as follows:
Technological product and process (TPP) innovations com-prise implemented technologically new products and processes and signicant technological improvements in products and processes. A TPP innovation has been implemented if it has
been introduced on the market (product innovation) or used within a production process (process innovation). TPP inno-vations involve a series of scientic, technological, organiza-tional, nancial and commercial activities. The TPP innovat-ing rm is one that has implemented technologically improved products or processes during the period under review (Eurostat and OECD 1997, p. 47).
As potential outcome variable in the empirical analysis, the R&D intensity, that is, the ratio of R&D expenditures to sales (multiplied by 100), is considered. We separate our sample with respect to the participation in public R&D schemes into the treatment group (i.e., subsidized rms), and potential con-trol group. The empirical analysis then tries to assess whether rms that received public R&D funds in 1994, 1996, or 1998 have on average a higher R&D intensity compared to rms that did not receive public means in that period. There are three time periods under evaluation, and a rm may belong to the group of subsidized rms (treatment group) in one, two, or all three periods. However, we allow rms to enter the potential control group only if they have previously not partic-ipated in any of the R&D support programs. Hence all rms that received public R&D funds in 1994 but not in the sub-sequent years under examination, or in 1996 but not in 1998, are excluded from the potential control group to avoid biased results. An important part of the empirical analysis is to esti-mate a rm’s probability of that receiving public funds given a number of observable characteristics also have an inuence on the success variable, that is, the R&D intensity. Therefore,
we briey review several control variables used in the empir-ical analysis.
The log of the number of employees and its square take into account possible size effects. A potential concern of using number of employees is the fact that rms that receive subsi-dies may hire R&D staff, and thus their employment increases. This would cause some endogeneity among the receipt of pub-lic funding and rm size. Therefore, it would be preferable to use the lagged number of employees of the year before par-ticipation in public policy schemes, but we do not have the required information in our database. However, we think that the possible endogeneity problem is not severe in our study for two reasons: (1) there are only a few programs elaborated toward increasing the R&D staff directly, and (2) R&D staff as a proportion of all employees of the rm amounts to less than 5% on average for the rms in the database, a gure that is quite stable over time. Hence R&D subsidies may inu-ence the number of R&D staff in some cases, but this change is small compared to the number of all employees. These two arguments weaken the concern of a potential endogene-ity between the receipt of R&D subsidies and the number of employees.
Eleven industry dummies control for cross-sectional differ-ences, for example, different technological potential in various industries. Two cohort dummies shift intertemporal effects. Another important factor that might have an inuence on the probability of funding, as well as on the success measure, is market competition. Thus several variables control for com-petitive impacts; the market share variable measures the rms’ sales in relation to the industries’ sales measured on the NACE three-digit level. The import ratio measured on the two-digit sectoral level captures the competitive pressure of foreign rms on the market. Moreover, we consider the rms’ export related sales divided by total sales to measure foreign com-petition. The sellers concentration of the domestic market is also taken into account. This is measured as the concentration ratio CR6, that is, the sum of market shares of the industries’ six largest rms. Capital intensity (i.e., the ratio of tangible assets per employee) is included in the analysis to control for different technologies used in the production process. More-over, we incorporate the rms’ age. It is often claimed that older rms are more reluctant to pursue innovation and, thus it may be argued that they are less likely to apply for public research programs. The foundation of a rm usually induces innovation activities and; hence young rms are expected to be more lively regarding R&D.
The legal form indicates the attitude of the rm (owner) toward risk and also the chance to enter public R&D pro-grams. Hence the dummy variable “legal form” separates the sample in rms with liability limiting legal forms [joint stock company (AG), nonpublic limited liability rm (GmbH), or commercial partnership with a nonpublic limited liability rm (GmbH & Co, KG)]. For these rms, the legal form dummy is 0. Using these legal forms, owners can minimize their risk up to a certain amount and thus have higher incentives to pur-sue more risky projects (Stiglitz and Weiss 1981). The dummy is 1 for rms with remaining legal forms (e.g., joint part-nerships). Companies with limited liability have much better options for receiving public subsidies, because rms applying
for public grants, must prove that they maintain an operating industrial plant. Firms with a liability limiting legal form must be recorded in the trade register in Germany, which means a publicly available information exists that this rm is already doing business. Companies with other legal forms must prove this within their application for public grants, and the ministry ofcial must inspect this on her or his own. Because ministry ofcials may behave in a risk-averse manner, companies with limited liability, who have already proved their credibility, are possibly favored.
To control for technological prowess or previous R&D experience, the analysis includes a dummy variable indicating whether rms have R&D departments. The inclusion of this dummy has the potential to create an endogeneity problem; However, this would occur only if rms in the sample were establishing new R&D departments as a result of the receipt of public subsidies. As there are no public R&D schemes in Germany that explicitly support the founding of whole R&D departments, the endogeneity problem is unlikely to occur. Nonetheless, the R&D department dummy reects the absorp-tive capacity and R&D experience of rms. The use of other variables is not possible with our data; unfortunately, using the (share of) R&D personnel would cause endogeneity prob-lems, because there are some policy schemes which promote hiring R&D staff. Other indicators of absorptive capacity, like lagged values of R&D expenditure, are not available.
Finally, we incorporate dummy variables that indicate whether the observed rm is a subsidiary of a foreign or West German rm. We do this for two reasons: rst, there are many policy schemes specically for SMEs. However, if a rm is an SME but also belongs to a group with a large par-ent company, then it would not be accepted to participate in policy schemes designed for SMEs. Moreover, many schemes are exclusively for Eastern German rms, and if the parent company is Western German, its subsidiaries are not allowed to enter in programs for Eastern German rms. Hence the dummy variables Western German Parent Company and For-eign Parent Company should capture these effects.
4. IDENTIFICATION AND MATCHING
4.1 Causal Effects and Potential Results
The situation to be examined is typical for an evaluation. All rms in the database can be separated with respect to the receipt of public R&D subsidies. This leads to a nonexperi-mental setting because the receipt of subsidies is not random. There are several differences between the groups of rms with and without R&D subsidies, as the empirical analysis herein reveals. The receipt of public R&D subsidies nally leads to potential outcomesY1for the rms that received subsidies and
Y0 for the nonrecipients. The approach that is used to
mea-sure the difference between groups (i.e., the causal effect) goes back to the model of potential outcomes by Roy (1951) and Rubin (1974). Rubin dened the term causal effect as “the dif-ference between the likely outcome of a person’s participation in the measure and the likely outcome of a person’s nonpar-ticipation.” The participation of rmi in any R&D scheme is denoted beSiD1 andSiD0 otherwise. The evaluation aims
to calculate the causal effect of public R&D schemes in the subsidized rms’ view, that is, the study concentrates on the causal effectˆ1that results from receiving R&D subsidies,
ˆ1
where E6ÿ7 in (1) represents the expectation operator. The causal effect then indicates whether public R&D support has a positive impact on the private R&D intensity. However, the outcome E6Y0—S D17 is by denition not observable,
because nonsubsidized rms cannot be observed in the case of R&D subsidy receipt. The rst outcome,E6Y1—SD17, can
be estimated unbiased as the mean value of the outcome vari-able representing rms that received subsidies. To identify
E6Y0—SD17, we need to incorporate further assumptions.
4.2 Identi’cation
E6Y0—SD17cannot simply be calculated as arithmetic mean
of the nonrecipients, because
E6Y0—
SD176DE6Y0—
SD070 (2)
This condition would be valid only in the case of an experi-ment in which participants and nonparticipants are randomly assigned to the measure. The descriptive analysis, however, shows that the subsidized and nonsubsidized rms in our sam-ple differ in various important characteristics. Due to selec-tion processes on the part of the authorities that determine how funds are distributed among applicants, the group of rms that received assistance is special and select. Moreover, rms have different information and different access to information regarding possibilities of application for public funds, which may be a further source of potential selection.
Rubin (1977) introduced the conditional independence assumption (CIA) to solve the problem arising in (2). This condition means that participation (receipt of subsidies) and potential outcome (R&D intensity) are independent for individuals with the same set of exogenous characteristics
4XDxi5,
4Y01 Y15?S—XDx4CIA50 (3)
The condition helps overcome the problem thatE6Y0—SD17
is unobservable. If CIA is valid, thenE6Y0—SD01 XDx
i7can
be used as a measure of potential outcome for the R&D recip-ients (Lechner 1998). However, CIA is plausible only if all variables that inuence the outcomeY0orY1and participation
statusSare known and available in the dataset. Although it is not possible to test the validity of CIA formally (see Almus, Egeln, Lechner, Pfeiffer, and Spengler 1999), the MIP con-tains a rich set of information that we believe makes the CIA a reasonable approximation. If CIA is correct, then the equation
E6Y0—
SD11 XDx7DE6Y0—
SD01 XDx7 (4)
holds, which means that the outcome of nonparticipants can be used to calculate the average outcome for the participants in an unbiased way provided that there are no systematic differences
between rms with and without public R&D subsidies. Then the causal effect of public subsidization in (1) changes to
ˆ1
2DE6Y1—
SD11 XDx7ƒE6Y0—
SD01 XDx71 (5)
which can be estimated unbiased using the means of both groups (Lechner 1998). The next step requires a search for pairs of nonsubsidized and subsidized rms that do not differ in characteristics contained in the vector X. Here the study deviates from other examinations. Normally, there are more rms or individuals in the potential control group compared to the group of treated individuals or rms. Our database, how-ever, has about twice as many rms that received public R&D subsidies than nonrecipients because of the special situation in Eastern Germany after reunication. Then the matching approach assigns to every subsidized rm a similar nonsubsi-dized counterpart. Using this approach, we do not waste infor-mation of subsidized rms; however, a nonsubsidized rm may be matched to more than one recipient of R&D subsidies.
4.3 Nonparametric Matching
Rosenbaum and Rubin (1983) pointed to the fact that a large number of exogenous characteristics is required to ensure the validity of the CIA. Thus the vectorxi containing the exoge-nous variables of rm i has a high dimension. This impedes the estimation of the causal effect, because it is almost impos-sible to nd subsidized and nonsubsidized rms that have exactly the same values in the exogenous variables if there are many to consider. Fortunately, the vector of exogenous vari-ables, xi, can be condensed into a single scalar measure to
solve this problem, the so-called propensity score. This mea-sure represents the probability that a given rmihas received public R&D subsidies at all given a setxi of individual
char-acteristics Pr4SiD1—XDxi5. Rosenbaum and Rubin (1983)
showed that if the CIA is fullled, then it is sufcient to con-dition on the propensity score to ensure statistical indepen-dence between potential outcome and receipt of R&D subsi-dies. Several forms of conditioning can be summarized under the classication “balancing scores” (Rosenbaum and Rubin 1983; Lechner 1998). Balancing scores cover a wide range of measures, ranging from the most complex,XDxi, to the
propensity score Pr4SiD1—XDxi5 as the most simple form.
This analysis uses the unbounded propensity score x0
i‚O as a
single matching criterion.
Along with the independence of potential outcome (rm-specic R&D intensity) and participation status (receipt of public R&D funds), identication of the causal effect depends on a further condition. Individual causal effects may not be inuenced by the participation status of other rms, that is, the absence of indirect effects [stable unit treatment value assumption (SUTVA) condition] (Angrist, Imbens, and Rubin 1996). SUTVA constitutes a potential caveat of the analysis, but because all R&D programs in Eastern Germany are con-sidered, these possible indirect effects should not cause biased results; the rms compete for the means on many submar-kets (various schemes). Regarding a possible demand shift for R&D inputs and thus a change in factor prices, we do not believe that public policy schemes have a remarkable effect.
In our opinion, the market for R&D inputs can be seen as a national market rather than several regional markets. Admit-tedly, a proportion of the 60% of innovating rms was sub-sidized in Eastern Germany, but when looking at whole Ger-many this proportion is rather small, because less than 14% of German innovators are located in Eastern Germany. In West-ern Germany only about 15% of innovating rms receive any public funding. Thus, most German innovators in the manufac-turing sector do not participate in public R&D schemes. More-over, the amount of subsidies for the recipients is low com-pared with their private investments. For example, in 1999, rms spent about DM 60 billion on R&D activities in Ger-many, whereas the public R&D subsidies from the federal government amounted to about DM 2 billion for civilian R&D (BMBF 2000). Unfortunately, there are no gures available for Eastern Germany only. However, because the share of sub-sidies is only about 3%, it seems unlikely that public R&D schemes have a signicant inuence on prices for R&D inputs. Hence the SUTVA is assumed to be fullled.
Other approaches can be used to estimate the causal effect in nonexperimental settings. Those most often applied are as follows (for a comprehensive overview, see Heckman et al. 1999):
¡ The “difference-in-differences” method (Ashenfelter 1978; Ashenfelter and Card 1985) became popular with the availability of panel data. Here, potential selection biases stemming from observable time invariant variables vanish in the linear model if differences are calculated over time (Fitzen-berger and Prey 1998).
¡ Complete econometric selection models simultaneously estimate participation and success of the program or measure. These models depend on restrictive assumptions regarding the error terms and their distribution that often cannot be inter-preted economically. Therefore, these models have often been criticized (Ashenfelter and Card 1985). However, Heckman and Hotz (1989) pointed out that application of parametric models leads to satisfying results.
¡ Parametric instrument variable estimators, which have garnered increasing attention in recent years, may be consid-ered a variant of parametric selection models (Angrist et al. 1996).
All of these approaches have advantages and disadvantages, and there are currently no guidelines as to when to use sta-tistical matching or econometric evaluation models. Thus “the choice of an appropriate econometric model critically depends on the data on which it is applied” (Heckman, Ichimura, Smith, and Todd 1996). Moreover, Heckman and Hotz (1989) concluded that “there is no objective way to choose among alternative nonexperimental estimators.” We nally apply a matching approach because the dataset has comprehensive information on the rms, thus enabling us to nd a “perfect twin,” that is, a similar control observation for every sub-sidized rm in the upcoming matching process. Moreover, Hausman (2001) stated that matching approaches lead to more robust estimates of the treatment effect compared with other methods.
5. EMPIRICAL ANALYSIS
5.1 Initial Situation and Probit Estimation
5.1.1 Prematch Situation. The dataset contains 625 rms
(N1) that received public R&D subsidies. Moreover, there are
303 rms (N0) that did not receive any public R&D subsidies.
Table 1 shows signicant differences in the means of sev-eral characteristics between both groups. This indicates that the group of rms that received public R&D subsidies is a selective one. The rms’ decision to apply for public assis-tance, as well as the selection mechanisms on the part of the authorities who distribute the means, generates a group of rms with special characteristics. Therefore, a comparison of the rm-specic R&D intensities using the initial dataset would lead to biased results due to the differences between groups.
5.1.2 Specication Tests and Probit Estimation. The best
and easiest way to nd a counterpart for every rm that received public R&D subsidies is to select the nonsubsidized one with exactly the same values in the selected matching variables (see Table 1), that is, a perfect twin. But the rela-tively large number of these variables and the availability of only about 300 rms in the potential control group impedes this approach. Matching methods, which have recently become popular in labor market evaluation studies, represent a pow-erful alternative to avoid these difculties (Lechner 1998). Rosenbaum and Rubin (1983) pointed out that matching “is a method for selecting units from a large reservoir of potential comparisons to produce a comparison group of modest size in which the distribution of covariates is similar to the distribu-tion in the treated group.”
The matching algorithm used corresponds closely to the one applied by Lechner (1998). To reduce the multidimensional problem arising from the relatively large number of covari-ates to a one-dimensional problem, initially a probit model is estimated. The decision whether the rm has received public assistance4SiD15or not4SiD05serves as the endogenous
variable,
E6Si—XDxi7DPr4SiD1—XDxi5Dê4x0i‚5
8iD11 : : : 1 N0CN10 (6)
The vectorxi contains the set of characteristics that
poten-tially inuence the probability of receiving public R&D sub-sidies. These have been introduced in Section 3. Also,ê4ÿ5
is the cumulative density function of the standard normal,‚
is the parameter vector to be estimated, andN1andN0dene
the number of assisted and nonassisted rms.
Tests on normality and heteroscedasticity have been car-ried out to nd potential misspecications that would lead to inconsistent probit estimates. We use Lagrange multiplier (LM) tests to check whether misspecications of the distri-butional assumptions (nonnormality, heteroscedasticity) exist (Verbeek 2000). The results of the heteroscedasticity tests are given in Table 2. The statistics are chi-square, distributed with as many degrees of freedom as variables to be tested for heteroscedasticity. The tests do not reject the null hypoth-esis that error terms are homoscedastic at the 5% level of signicance. Moreover, the normality assumption cannot be
Table 2. Heteroscedasticity and Normality Tests
Degrees of Probability
Variable freedom Statistic value
Industry dummies 11 130290 .275
Cohort dummies 2 40245 .120
Size groups 5 50050 .410
Export ratio 1 0900 .343
Market share 1 0015 .903
Import ratio 1 0177 .674
Sellers concentration 1 0070 .791
Parent company 2 10096 .578
1/age 1 0471 .492
Capital intensity 1 0213 .644
Legal form 1 0000 .984
R&D department 1 20005 .157
Normality 2 40941 .085
Number of observations 925
rejected at the 5% level of signicance in a chi-squared test with 2 degrees of freedom (see Table 2). This test examines whether skewness and kurtosis are characteristic of a normal distribution.
No indication of potential misspecication of the homoscedastic probit model was found. Thus the results can be used for inferences and the matching process. Table 3 gives the estimated parameters, which we interpret briey at rst. In addition to the estimated parameters, Table 3 contains the marginal effects normally used to interpret the results. Here the effect of marginal changes of an exogenous variable on the probability of receiving subsidies can be examined. The marginal effects for the probit model are calculated according
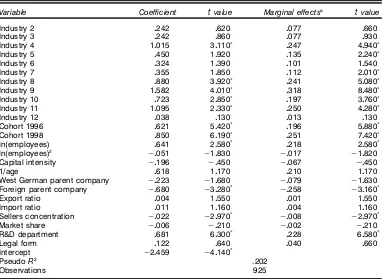
Table 3. Results of the Probit Estimation
Variable Coef’cient tvalue Marginal effectsa tvalue
Industry 2 0242 0620 0077 0660
ln(employees) 0641 20580
ü
0218 20580
ü
ln(employees)2 ƒ0051 ƒ1
0830 ƒ0017 ƒ10820
Capital intensity ƒ0196 ƒ0450 ƒ0067 ƒ0450
1/age 0618 10170 0210 10170
West German parent company ƒ0223 ƒ10680 ƒ0079 ƒ10630
Foreign parent company ƒ0680 ƒ30280
ü ƒ0258 ƒ3
0160
ü
Export ratio 0004 10550 0001 10550
Import ratio 0011 10160 0004 10160
Sellers concentration ƒ0022 ƒ20970
ü ƒ0008 ƒ2
0970
ü
Market share ƒ0006 ƒ0210 ƒ0002 ƒ0210
R&D department 0681 60300
ü
NOTE: üindicates statistical signi’cance at the 5% level.
a¡S=¡xis for dummy variables the discrete change from 0 to 1. The marginal effects will be calculated at the means of the variables.
to Greene (2000) in the following way:
¡E6S—XDx7
Here ”4ÿ5is the probability density function of the standard normal.
In the probit estimation, several industry dummies, the cohort dummies, the rm size, and the fact that the potential parent company is located abroad have a signicant inuence on the probability to receive public R&D subsidies. More-over, the seller’s concentration, as well as the existence of an R&D department, signicantly determine the probability of being subsidized. No a priori considerations were made regarding the inuence of the industry dummies, but it turns out that industries that are rather technology intensive (indus-tries 4, 8–11) have ceteris paribus a higher probability to receive subsidies. The cohort dummies indicate that rms had a higher probability of receiving subsidies in subsidization periods 1996 and 1998 than in the reference period 1994. Other things equal, the effects amount to about 20 to 25 per-centage points. The existence of a foreign parent company is connected with a decrease of the probability of receiving public R&D subsidies ceteris paribus by about 26 percentage points. This indicates that German rms without foreign links are the main focus of public support. The insignicant inu-ence of a West German parent company further supports this nding.
Firm size is a further determinant that signicantly inu-ences the subsidization probability. The larger the rm, the
0
unbounded propensity score
a
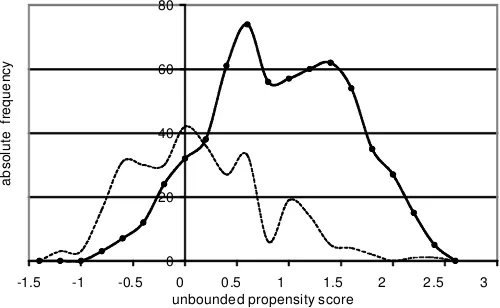
Figure 1. Frequency Distribution of the Unbounded Propensity Scores of the Initial Dataset. Scores(x0
i‚O) based on the probit model. (—–ÿ ’rms with subsidies;- - - ’rms without subsidies.)
better its chances to receive public funds. This is due mainly to information advantages, better capacities to carry out R&D, as well as the existence of more staff and capacity to apply for the funds. According to the marginal effects an increase of the rm size by 10% would raise the probability of receiving subsidies by about 2.2 percentage points. Not surprisingly, an existing R&D department has a signicant positive effect on the probability of receiving subsidies, raising the probability by about 23 percentage points. Finally, the legal form does not inuence the probability of receiving subsidies.
After (6) is estimated, the unbounded propensity score x0
i‚O
is calculated for every observation. This measure is used in the procedure to nd the counterparts for every subsidized rm. We prefer the unbounded over the bounded propensity scoresê4x0
i‚5O because they have better distribution properties
(Hujer, Maurer, and Wellner 1997). We also used ê4x0i‚5O as matching criterion, but there were only marginal changes in the results of the following matching process. Figure 1 shows frequency distributions of the unbounded propensity scores,
xi0‚O, of both rm groups for the initial dataset. They fulll
an important assumption for the matching process, because both graphs overlap to a great extent, hence indicating similar distributions of the two groups (Lechner 1998).
5.2 Nonparametric Matching
The general matching process proceeds as follows:
1. Separate the observations with respect to their status of public R&D subsidy receipt.
2. Select a rm i that received public R&D funds.
3. Take the unbounded propensity score x0‚O. In many empirical studies one wants to balance the participants and control observations with regard to more characteristics than the propensity score. Firm size is an example. Therefore, in addition to the propensity score, one uses a vector (where
is a subset ofx) that contains important matching variables. This variant is calledhybrid matching(Lechner 1998).
4. Calculate a proper measure of metric distance, for exam-ple, the Mahalanobis distance. Let
dijD4x
for every combination of the R&D recipienti and every rm from the potential control groupj. Then calculate the Maha-lanobis distance,
to nd the nearest neighbor. Here cov represents the covari-ance matrix based on the controls, that is, rms that did not receive public subsidies.
5. After calculating the distance, some restrictions on the neighborhood can be imposed:
¡ A required criterium to be a neighbor of participantimay be that a potential control rm is recorded in the same industry classication.
¡ One shortcoming of the nearest-neighbor matching so far is that a neighbor is always picked, even if the metric distance to the ith control observation is very large. To prevent excessively large distances, it is possible to dene a condence interval of the propensity score and other matching variables on basis of the participant group in which a potential control observation should be included. This approach, called caliper matching, was indroduced by Cochran and Rubin (1973). Hujer et al. (1997) gave an example of this method.
6. The rm j from the potential control group with the smallest Mahalanobis distance serves as control observation in the following success analysis. The comparison observation is drawn randomly if more than one rm attains the mini-mum Mahalanobis distance. If no potential control observation remains in the pool after applying the restrictions described in the previous step, then rm i is bypassed, and no match can be made.
7. Remove theith rm from the pool of rms that received subsidies, but return the selected control observation to the pool of control observations. This is done because of the rela-tively small number of control rms. Using different data (i.e., a large potential control group), one could also draw without replacement. In this case, it would be important to draw the participants one after the other randomly from the treatment group.
8. Repeat steps 2–7 to nd matched pairs for all recipients.
In this article we use only the propensity score and impose the restriction that potential controls must be recorded in the same industry classications as the participants. If the match-ing results are not satisfactory, then one would proceed with additional variables in the matching function. However, it turned out that using the unbounded propensity score as the only matching criterion was already sufcient. Table 1 mea-sures the statistical “similarity” of the observations that remain after the matching procedure. Column 2 contains the means of the variables of the rms with R&D subsidies, and columns 4 contains the means of the assigned rms without such sub-sidies. Matching is regarded as successful if the means of the relevant variables in both groups do not differ signicantly. Note that we found for every participant a neighbor within the condence interval dened by the caliper restriction with regard to the propensity score. As indicated by a t test, the
0.0 0.2 0.4 0.6
-1.5 -1.0 -0.5 0.0 0.5 1.0 1.5 2.0 2.5
unbounded propensity score
p
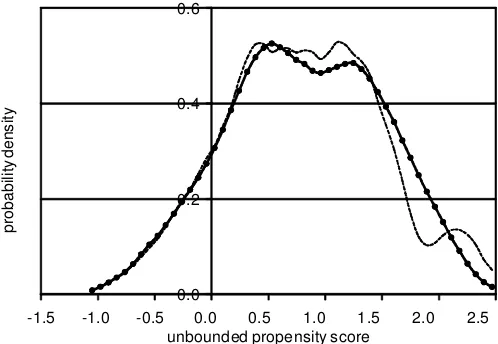
Figure 2. Density Distribution of the Unbounded Propensity Scores after the Matching Process. Scores(x0
i‚O) based on the probit model. (—–ÿ ’rms with subsidies;- - - ’rms without subsidies.)
differences of the means are small and not statistically signi-cant at the 5% level for all variables. Moreover, the unbounded propensity scorex0
i‚O as a summary measure of various
vari-ables does not signicantly differ between both groups, indi-cating a good t of the matching algorithm applied. We used 157 out of the 303 potential control observations for the selected control group. This means that each selected control group observation is on average assigned to four subsidized rms.
Figure 2 contains kernel density estimates of the unbounded propensity scoresx0
i‚O for both groups. The Epanechnikov
ker-nel density estimates instead of histograms serve as tools to show the similarity in the relative frequencies (probability den-sities), because both groups contain the same number of obser-vations after the matching process (Silverman 1986). The are nearly no differences on the left and middle parts of the dis-tribution. Due to the small number of nonsubsidized rms on the right tail (see Fig. 1) it is difcult to nd adequate match-ing pairs. All in all, Figure 2 underlines the quality of the matching procedure.
6. CAUSAL EFFECTS
The success of public R&D subsidies is evaluated by com-paring the average rm-specic R&D intensities between the groups of subsidized and nonsubsidized rms; that is,Y1
i and
Y0
i. The unbiased estimator for the causal effectˆO
1is the
dif-ference of the means in these groups,
O
R&D subsidy programs have on average a positive impact on the rm specic R&D intensity if the causal effect ˆO1 is
sig-nicantly greater than 0. The programs do not generate pos-itive effects if ˆO1 is statistically insignicant. Finally,
subsi-dized rms perform worse than rms without subsidies if the causal effect is signicantly smaller than 0. This means that nonsubsidized rms undertake on average more R&D efforts
(measured with the R&D intensity) than rms that received funding within the programs under evaluation.
The test on the effect is usually carried out by means of a simple t statistic. In this case, however, the ordinary t value is biased upward, because it does not take into account that the mean of the outcome variable of the control group is not a result of a random sampling, but rather is an estimation based on the estimated propensity scores and the nonparametric matching procedure. Thus the usual t statistic may be mis-leading for making inferences. To remove the bias of the t
statistic, the method of bootstrapping is applied; that is, we simulate the distribution of the mean outcome of the control group by repeated sampling (see Greene 2000 for a sketch of bootstrapping or Efron and Tibshirani 1993 for a comprehen-sive discussion):
1. A random sample with replacement is drawn from the original sample that has the same size as the original one.
2. The probit model is reestimated and a new matching with this sample is performed; the mean difference ˆO1 is recorded
after the procedure.
3. The whole process is repeated 200 times.
4. This leads to a simulated distribution of mean differences between the participants and their controls. This empirical dis-tribution can subsequently be used to calculate a standard error and thus an unbiasedt statistic.
Applying (8) leads to an average R&D intensity of about 6.6 (2.6)% for the subsidized (nonsubsidized) rms. Thus the resulting causal effect amounts to about four percent-age points. According to the result of the two-tailed t test, this effect is statistically signicantly different from 0, even according to the bootstrapping. As mentioned earlier, this result shows that the ordinarytstatistic is biased downward.
Eastern German rms that receive public R&D funds achieve on average higher rm-specic R&D intensities than rms that do not receive public R&D support, given that the rms from both groups do not differ with respect to exogenous variables that inuence the probability of receiving public R&D subsidies. The results conrm that public R&D schemes in Eastern Germany are an important factor for stimulating private R&D efforts.
The signicantly higher R&D intensities for subsidized rms indicate that complete substitution of public means does not occur, that is, the absence of perfect crowding out. The recip-ients increase instead their private R&D efforts in the case of public subsidization. This is especially important in a transi-tion economy like Eastern Germany, in which private R&D is indispensable for creating innovative and viable economic structures after more than 40 years of a planned economy.
Of course, it be would interesting to know how large the net effect of public funding is for the Eastern German manufactur-ing sector. The MIP provides weights for its sampled rms that enable calculation of population-weighted descriptive statistics and, in our case, rough estimation of a macroeconomic effect. According to this information, the total R&D expenditure in the Eastern German manufacturing sector in 1998 was about 3.84 billion DM. Firms that participated in any public inno-vation scheme spent almost 3.4 billion DM of this amount. According to the result displayed in Table 4, we assume that
Table 4. Causal Effect: Firm-Speci’c R&D Intensity
Subsidized Nonsubsidized Causal effect Test statistic
’rmsEb[Y1—SD1] ’rmsEb[Y0—SD0] ˆO1 tvalue
Firms (percent) (percent) (percentage points) (bootstraptvalue)
622 6057 2063 3094 8024
ü
(5032
ü)
NOTE: üindicates statistical signi’cance in a two-tailedttest at the 1% level.
60% of recipients’ R&D activities on average are due to public funding. Applying this rule of thumb, we derive a macroeco-nomic effect of 2.04 billion DM according to subsidies. This effect is large compared with other studies cited in Section 2. However, keeping in mind that the transformation process in Eastern Germany is heavily fostered by the government, this gure seems to be plausible. Of course, it would be desirable to carry out a cost-benet analysis, but unfortunately the Ger-man federal government does not provide any information on how the 2 billion DM of public funding dedicated to the busi-ness sector (BMBF 2000) are allocated to Eastern and Western German rms.
7. CONCLUSIONS
This article provides new evidence regarding whether public R&D funds crowd out private investment in innovations. It is analyzed whether the participation in public R&D programs leads on average to a higher R&D intensity at the rm level. Using a nonparametric matching approach, we compare the potential outcome of this group to a matched control group of nonsubsidized rms.
The analysis has some advantages over previous studies. The information collected in the MIP is not restricted to a particular measure but covers all public funding activities by the EU, the federal government, and the federal states in the years after reunication. However, it is not possible to track in which program a rm participated with the available informa-tion. The procedure used to identify the causal effect of public R&D schemes is also new to this kind of literature. We use a nonparametric matching approach to dene a suitable control group.
Our study has yielded the following results. The causal effect identied is signicantly positively different from 0; that is, rms that received public funding achieve on average a higher R&D intensity than rms belonging to the selected control group. This causal effect amounts to about four per-centage points on average. For example, a subsidized rm with a turnover of 100,000 monetary units would have invested on average 4,000 monetary units less if it had not participated in public R&D schemes.
ACKNOWLEDGMENTS
We are grateful to the members of MIP team for providing the data and to François Laisney, two anonymous referees, and the associate editor of for helpful comments. All remaining errors are, of course, our responsibility alone.
APPENDIX: INDUSTRIES IN THE SAMPLE
Table A.1. Classi’cation of Industry Dummies
Industry dummy Description
Industry 1 Food and beverages
Industry 2 Textiles, clothes, and leather goods Industry 3 Wood, paper, publishing, and printing Industry 4 Fuels and chemicals
Industry 5 Rubber and plastic products Industry 6 Nonmetallic mineral products Industry 7 Basic and fabricated metals Industry 8 Machinery and equipment
Industry 9 Of’ce and communication equipment, electrical machinery and components
Industry 10 Medical and optical instruments
Industry 11 Motor vehicles and other transport equipment Industry 12 Furniture products and not elsewhere cited
[Received March 2001. Revised August 2002.]
REFERENCES
Almus, M. (2001), “Evaluating the Impact of Public Start-Up Assistance— Results From an Econometric Approach,” ZEW Discussion Paper 01-23, Mannheim.
Almus, M., Egeln, J., Lechner, M.. Pfeiffer, F., and Spengler, H. (1999),
Wirkungen gemeinn¨utziger Arbeitnehmer¨uberlassung in Rheinland–Pfalz, Beitr¨age zur Arbeitsmarkt- und Berufsforschung 225, Nürnberg (in German).
Angrist, J., Imbens, G., and Rubin, D. B. (1996), “Identication of Causal Effects Using Instrumental Variables,”Journal of the American Statistical Association, 91, 444–455.
Ashenfelter, O. (1978), “Estimating the Effect of Training Programs on Earn-ings,”Review of Economics and Statistics, 60, 4–57.
Ashenfelter, O., and Card, D. (1985), “Using the Longitudinal Structure of Earnings to Estimate the Effect of Training Programs,”Review of Eco-nomics and Statistics, 67, 648–660.
BMBF (German Federal Ministry for Education and Research) (2000), Bun-desbericht Forschung 2000, Bonn, Germany: author.
Busom, I. (2000), “An Empirical Evaluation of the Effects of R&D Subsidies,”
Economics of Innovation and New Technology, 9, 111–148.
Cochran, W., and D. Rubin (1973), “Controlling Bias in Observational Stud-ies,”Sankyha, 35, 417–446.
David, P. A., Hall, B. H., and Toole, A. A. (2000), “Is Public R&D a Com-plement or Substitute for Private R&D? A Review of the Econometric Evi-dence,”Research Policy, 29, 497–529.
Dehejia, R. H., and Wahba, S. (1999), “Causal Effects in Nonexperimental Studies: Reevaluating the Evaluation of Training Programs,”Journal of the American Statistical Association, 94, 1053–1062.
Ebling, G., Hipp, C., Janz, N., Licht, G., and Niggemann, H. (1999), “Inno-vationsaktivit¨aten im Dienstleistungssektor—Ergebnisse der Innovationser-hebung 1997,” inInnovationsaktivit¨aten in der Deutschen Wirtschaft, eds. N. Janz and G. Licht, Baden-Baden, Germany: Nomos (in German). Efron, B., and Tibshirani, R. S. (1993),An Introduction to the Bootstrap, New
York: Chapman and Hall.
Eurostat and OECD (1997),OSLO Manual—Proposed Guidelines for Col-lecting and Interpreting Technological Innovation Data, Paris: author.
Fitzenberger, B., and Prey, H. (1998), “Besch ¨aftigungs und Verdienst-wirkungen von Weiterbildungsmaßnahmen im Ostdeutschen Transforma-tionsprozess: Eine Methodenkritik,” in Qualikation, Weiterbildung und Arbeitsmarkterfolg, eds. F. Pfeiffer and W. Pohlmeier, Baden-Baden, Ger-many: Nomos, pp. 39–96 (in German).
Greene, W. H. (2000), Econometric Analysis, Upper Saddle River, NJ: Prentice Hall.
Hausman, J. (2001), “Microeconometrics,”Journal of Econometrics, 100, 33–35.
Heckman, J. J., and Hotz, V. J. (1989), “Choosing Among Nonexperimental Methods for the Estimating the Impact of Social Programs: The Case of Manpower Training,”Journal of the American Statistical Association, 84, 862–880.
Heckman, J. J., Ichimura, H., Smith, J., and Todd, P. (1996), “Characterizing Selection Bias Using Experimental Data,”Econometrica, 66, 1017–1098. Heckman, J. J., LaLonde, R. J., and Smith, J. A. (1999), “The Economics and
Econometrics of Active Labor Market Programs,” inHandbook of Labor Economics(3rd ed.), eds. O. Ashenfel and D. Card, Amsterdam: Elsevier, pp. 1865–2097.
Hujer, R., Maurer, K.-O., and Wellner, M. (1997), “The Impact of Training on Unemployment Duration in West Germany,” Discussion paper 74, Johann Wolfgang Goethe-University, Dept. of Economics.
Janz, N., Ebling, G., Gottschalk, S., and Niggemann, H. (2001), “The Mannheim Innovation Panels (MIP and MIP–S) of the Centre for European Economic Research,”Schmollers Jahrbuch—Journal of Applied Social Sci-ence Studies, 121, 123–129.
Klette, T. J., Møen, J., and Griliches, Z. (2000), “Do Subsidies to Commer-cial R&D Reduce Market Failures? Microeconometric Evaluation Studies,”
Research Policy, 29, 471–495.
Lach, S. (2000), “Do R&D Subsidies Stimulate or Displace Private R&D? Evidence From Israel,” Working Paper 7943, National Bureau of Economic Research.
LaLonde, R. J. (1986), “Evaluating the Econometric Evaluations of Training Programs With Experimental Data,”The American Economic Review, 76, 604–619.
Lechner, M. (1998), Training the East German Labour Force— Microeconometric Evaluation of Continuous Training After Unication, Heidelberg: Physica.
(1999), “Earnings and Employment Effects of Continuous Off the-Job Training in East Germany After Unication,”Journal of Business and Economic Statistics, 17, 74–90.
Lichtenberg, F. (1984), “The Relationship Between Federal Contract R&D and Company R&D,”American Economic Review, 74, 73–78.
Ragnitz, J. (2000), “Die Zukunft der Ost–F¨orderung,” Wirtschaftsdienst, 2000/IV, 225–229 (in German).
Rosenbaum, P. R., and Rubin, D. B. (1983), “The Central Role of the Propensity Score in Observational Studies for Causal Effects,”Biometrika, 70, 41–55.
Roy, A. D. (1951), “Some Thoughts on the Distribution of Earnings,”Oxford Economic Papers, 3, 135–146.
Rubin, D. B. (1974), “Estimating Causal Effects of Treatments in Randomized and Non-Randomized Studies,” Journal of Educational Psychology, 66, 688–701.
(1977), “Assignment to Treatment Group on the Basis of a Covariate,”
Journal of Educational Statistics, 2, 1–26.
Silverman, B. W. (1986),Density Estimation for Statistics and Data Analysis, London: Chapman and Hall.
Stiglitz, J. E., and Weiss, A. (1981), “Credit Rationing in Markets With Imperfect Information,” The American Economic Review, 71, 393–410.
Verbeek, M. (2000),A Guide to Modern Econometrics, New York: Wiley. Wallsten, S. J. (2000), “The Effects of Government–Industry R&D Programs
on Private R&D: The Case of the Small Business Innovation Research Program,”RAND Journal of Economics, 31, 82–100.