IOP Conference Series: Materials Science and Engineering
PAPER • OPEN ACCESS
The Cross-Sectional Investigation of Oxide Scale
FeCr Alloys and Commercial Ferritic Steel
Implanted with Lanthanum and Titanium Dopants
after Oxidation Test at 900°C
To cite this article: Hendi Saryanto et al 2018 IOP Conf. Ser.: Mater. Sci. Eng.343 012004
View the article online for updates and enhancements.
Related content
The Cross-Sectional Investigation of Oxide Scale FeCr Alloys and Commercial Ferritic Steel Implanted with Lanthanum and Titanium Dopants after Oxidation Test at 900°C
Darwin Sebayang, Hendi Saryanto, Pudji Untoro et al.
-Cross-Sectional Investigations of Oxide Scale Nanocrystalline FeCr Alloys after High-Temperature Oxidation Test at 900°C
H Saryanto, D Sebayang and P Untoro
-Influence of oxidation temperature on the oxide scale formation of NiCoCrAl coatings
E Sugiarti, K A Zaini, R Sundawa et al.
1234567890‘’“”
ICEAMM 2017 IOP Publishing
IOP Conf. Series: Materials Science and Engineering 343 (2018) 012004 doi:10.1088/1757-899X/343/1/012004
The Cross-Sectional Investigation of Oxide Scale FeCr Alloys
and Commercial Ferritic Steel Implanted with Lanthanum
and Titanium Dopants after Oxidation Test at 900
OC
Hendi Saryanto1, Darwin Sebayang2, Pudji Untoro3, Tjipto Sujitno4
1
Gajah Tunggal Polytechnic, Kel. Pasir Jaya, Tangerang-Banten, Indonesia
2
Mercu Buana University, Jln. Meruya Selatan, Jakarta Barat, Indonesia
3
Surya University, Jln. Boulevard Gading Serpong, Banten-Indonesia
4
Centre For Accelerator and Material Process Technology. BATAN JL. Babarsari, D.I Yogayakarta, 55281, Indonesia
Abstract. The cross-sectional examinations of oxide scales formed by oxidation on the surface of FeCr alloys and Ferritic Steel that implanted with lanthanum and titanium dopants were observed and investigated. Scanning electron microscopy (SEM) coupled with energy dispersive X-ray spectroscopy (EDS) has been used to study the cross-sectional oxides produced by specimens after oxidation process. X-ray diffraction (XRD) analysis was used to strengthen the analysis of the oxide scale morphology, oxide phases and oxidation products. Cross-sectional observations show the effectiveness of La implantation for improving thinner and stronger scale/substrate interface during oxidation process. The result shows that the thickness of oxide scales formed on the surface of La implanted FeCr alloy and ferritic steel was found less than 3 µm and 300 μm, respectively. The oxide scale formed on the surface of La implanted specimens consisted roughly of Cr2O3 with a small amount of FeO mixture,
which indicates that lanthanum implantation can improve the adherence, reduce the growth of the oxide scale as well as reduce the Cr evaporation. On the other side, the oxide scale formed on the surface of FeCr alloys and ferritic steel that implanted with titanium dopant was thicker, indicating that significant increase in oxidation mass gain. It can be noticed that titanium implantation ineffectively promotes Crrich oxide. At the same time, the amount of Fe increased and diffused outwards, which caused the formation and rapid growth of FeO.
1. Introduction
2
1234567890‘’“”
ICEAMM 2017 IOP Publishing
IOP Conf. Series: Materials Science and Engineering 343 (2018) 012004 doi:10.1088/1757-899X/343/1/012004
the oxygen electrode [4]. To enable practical application, two classes of technology can be approached to reduce the growth rate of the oxide scale, the first is to develop nanostructured alloys, and the other is to conduct surface treatment of the developed or available alloy with a reactive element [5,15]. FeCr alloys and ferritic stainless steels exhibit excellent properties as interconnect material in SOFCs [6]. The oxidation performance of FeCr used in high-temperature applications (such as Interconnector in SOFC) depends on their potential to form and maintain a Cr-rich protective oxide scale [7-8]. Technical requirements to be used as interconnect in SOFC should fulfill a number of specific requirements, i.e. a high oxidation resistance, a high electrical conductivity of the surface oxide scales, gas tightness, and a coefficient of thermal expansion matched to the electrolyte and the electrodes [9-10]. The role of the interconnect component in SOFC units is to electrically connect individual cells in series to form a multi-cell stack with higher power density. FeCr and Ferritic stainless steels have many desirable properties for use in solid oxide cell stacks and are the most common type of materials used as interconnect. When Cr based alloys and high-Cr ferritic steels are exposed to an oxidizing environment at elevated temperatures, an oxide layer is formed on the surface, acting as a barrier between the metal and the gas. Chromium increases the oxidation resistance of stainless steels by the formation of a chromia (Cr2O3) scale on the surface. Other oxides which are often encountered in the
layers are iron oxides (wüstite FeO, magnetite Fe3O4, or hematite Fe2O3) [8,11-12].
Refer to our previous study [8,13-14] the cross-sectional investigation of FeCr alloy with smallest crystallite sizes can significantly reduces the growth of oxide scale and improve the high-temperature oxidation and corrosion resistance of FeCr alloy that oxidized at 900oC, However, the research did not investigate the characterization of oxide scale on a cross-sectional analysis and the growth mechanism of the oxide scale of implanted specimens. Therefore, the objective of this study is to investigate the cross-sectional characterization of oxide scale formed on the surfaces of implanted specimens compare with un-implanted specimens oxidized at 900oC. Oxidation kinetics, and as well as the evolution of oxide scale composition and microstructure are systematically studied. The mechanism of the formation of oxide scale on both of steels is discussed.
2. Specimens and Experimental Procedure
2.1 Specimens
The selected FeCr alloy with smallest crystallite size (38.51 nm) as the best oxidation results in our previous study [8] were selected and implanted with lanthanum and titanium dopants. Implantation of lanthanum and titanium dopants with nominal doses1017 ions/cm2 was undertaken using 100 keV ion beam energy and 200 keV acceleration potential and the beam current density was maintained at 10
μA/cm2
. The depth concentration profiles of lanthanum and titanium dopants in to substrate of both type specimens were collective in Table. 1 [13-15].
Table 1. The depth concentration profiles of lanthanum and titanium dopants in to substrate of steels Sample Implanted with lanthanum Depth profile (Å) Implanted with titanium
FeCr alloys 297 706
Commercial FS 296 639
2.2. Oxidation Test
The samples of oxidation test were cut from the specimens to the size of 4x5x3 mm. The samples were subjected to oxidation tests in laboratory air at atmospheric pressure in a PROTHERM box furnace at 900oC for 100 h in laboratory air at the atmospheric pressure.
2.3. Preparation of cross-section specimens
1234567890‘’“”
ICEAMM 2017 IOP Publishing
IOP Conf. Series: Materials Science and Engineering 343 (2018) 012004 doi:10.1088/1757-899X/343/1/012004
samples were polished on the cross-sectional face up to 1500 grade SiC paper and final polishing
using 0.05 μm diamond paste.
2.4. Microstructure Characterization
The oxidized alloys were investigated by a BRUKER D8 Advance X-ray diffraction (XRD) equipped
with CuKα radiation and phase identification as referred to the ICDD PDF-2 database. The surface and cross-sectional morphology analyses of oxidized specimens were carried out with a JEOL JSM-6380 scanning electronic microscope (SEM) equipped with an energy-dispersive X-ray spectroscopy (EDS) analyzer. Furthermore, the best selected of oxidized specimens were analyses more detail using EDS line/mapping analysis.
3. Results and Discussion
3.1. Previous Results
The previous results on developed of FeCr Alloys, oxidation test, and parabolic rate were collected in Table 1 and Fig.1 [7, 8, 9, 10 & 11], where the parabolic rate constant (kp) is determined by the mass
gain (∆W) per unit surface area of a specimen (A) and exposure time (t) [10, 13-15].
(1)
Table 2. Mass gain change and parabolic rate constant (kp) of FeCr alloys after oxidized at 900oC Specimens Crystallite size
(nm) Mass Gain (mg/cm2) Parabolic Rate, k(mg2/cm4) p
FeCr “A” 53.33 21.81 6.191
FeCr “B” 38.51 7.72 0.794
FeCr “C” 76.60 35.18 13.58
Table 1 show the mass gain curves of the studied alloys with different crystallite size oxidized at 900oC. Mass gain change (mg/cm2) and parabolic rate (mg2/cm4) indicate that FeCr “B” as the smallest crystallite size was found as the lowest mass gain change and parabolic rate, which indicates as the best oxidation resistance.
3.2. Results of the current study
SEM morphologies of the cross-section of the oxide scale on the surface of implanted and the selected of un-implanted (FeCr ”B”) alloys after oxidized at 900°C for 100 h in air atmosphere are presented in Fig 1 below.
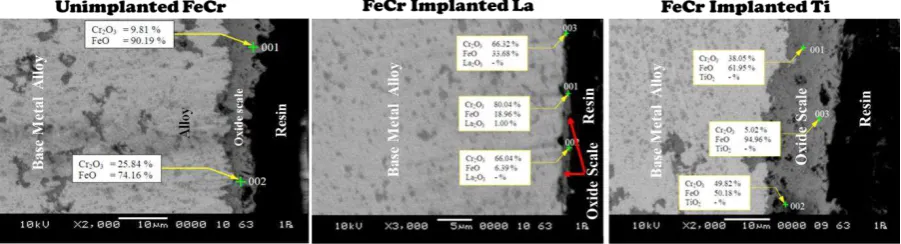
Figure 1. SEM morphologies of the cross-section of the oxide scale on the surface of implanted and un-implanted FeCr alloys oxidized at 900oC
Fig. 1 shows the cross-sectional morphology of oxide scale on the surface of implanted and un-implanted specimens oxidized at 900oC. A very thin oxide scale, less than 3 µm, had formed on the surface of FeCr alloy that implanted with lanthanum. While, the thickness of the oxide scale formed on the surface of un-implanted FeCr alloy and FeCr alloy that implanted with titanium was formed
4
1234567890‘’“”
ICEAMM 2017 IOP Publishing
IOP Conf. Series: Materials Science and Engineering 343 (2018) 012004 doi:10.1088/1757-899X/343/1/012004
about 8 and 15 μm, respectively. According to EDX analysis, it can be seen that the oxide scale on the surface of FeCr alloy implanted with lanthanum was dominated by the presence of Cr2O3 about
60.05-80.04 %, which indicates that lanthanum implantation can protect the Cr2O3 layer, reduce the rate of
Cr evaporation and reduce the growth of the oxide scale as evidenced by the thin layer of oxide scale. However, the oxide scale formed on the surface FeCr alloy that implanted with titanium dopant indicated covered and distributed evenly with the main composition of FeO approximately 50.18-94.96%. It can be noticed that titanium implantation ineffectively promotes Cr rich oxide. At the same time, the amount of Fe increased and diffused outwards, which caused the formation and rapid growth of FeO. Furthermore, Cr2O3 as the protective layer becomes non-protective, due to the formation of
volatile Cr2O3 upon exposure to oxidizing atmospheres for extended periods.
Figure 2. SEM morphologies of the cross-section of the oxide scale on the surface of implanted and un-implanted Ferritic Steel oxidized at 900oC
Fig. 2 shows the cross-sectional of oxide scale formed on the implanted and un-implanted ferritic steels oxidized at 900oC. The oxide scale on the surface of an-implanted ferritic steel is formed up to a
scale thickness of 600 μm, where the oxide scales show mainly consisted of Cr2O3 about 33.47 and
FeO 99.40 at%. However, the adherence between scale and a base metal reduced causes the occurrences of the largest crack along the scale. For the specimen that implanted with lanthanum show better oxide scale indicated by the thickness of the oxide scale was found about 300 μm thick, although the cracking also occurs but the presence of Cr2O3 as the protective layers is still significant
in the range of 34.53-36.83 %. While, the presence of Cr2O3 on the oxide scale of FeCr that implanted
with titanium was found in the range 10.38-29.43 at %. This phenomenon indicates that the implantation of lanthanum has influenced the formation stable layer of Cr2O3 and plasticity as well as
protects it from evaporation and cracks on high temperature oxidation. The results of the cross-sectional analysis as described above have been confirmed by the results of the oxidation kinetics of both type specimens oxidized at 900oC as shown by following picture.
1234567890‘’“”
ICEAMM 2017 IOP Publishing
IOP Conf. Series: Materials Science and Engineering 343 (2018) 012004 doi:10.1088/1757-899X/343/1/012004
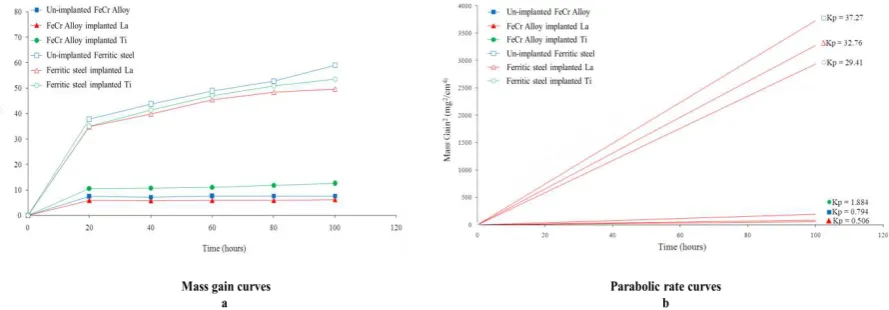
Figs. 3 show the mass gain curves and parabolic rate curves of the implanted and un-implanted of FeCr alloys and Ferritic steel oxidized at 900oC. Mass gain curves and parabolic rate curves indicates that ferritic steels displayed higher mass gain trend and exhibits poor oxidation resistance. The beneficial effect of lanthanum implantation is clearly visible, the oxidation behaviour being improved. In fact, the mass gain and parabolic rate more lowest, if compared with the un-implanted and Ti implanted specimens. The effect of lanthanum implantation for specimen of FeCr alloy that implanted with lanthanum is significantly to reduce the mass gain change and parabolic rate from 7.73 mg/cm2 and 0.794 mg2/cm4 to 6.29 mg/cm2 and 0.506 mg2/cm4, respectively, in comparing with un-implanted FeCr alloy. Furthermore, The effect of lanthanum implantation for specimen of ferritic steel that implanted with lanthanum is significantly to reduce the mass gain change and parabolic rate from 59 mg/cm2 and 37.27 mg2/cm4 to 49.7 mg/cm2 and 29.41 mg2/cm4, respectively, in comparing with un-implanted ferritic steel. While, the effect of titanium implantation becomes ineffective to reduce the growth of oxide scale which indicates by the highest mass gain change and parabolic rate for both type of specimens. In order to strengthen the analysis result described above, XRD analysis were applied to identified the oxide phase of both type of specimens. The XRD patterns for specimens oxidized at 900oC for100 h are presented in Fig.4.
Figure 4. X-rays diffractograms of unimplanted and implanted specimens oxidized for 100 h at 900oC
Fig. 4 above shows the diffraction patterns of FeCr alloys and ferritic steels oxidized at 900oC. For
unimplanted FeCr alloy, the signal peaks can be identified as α-(Fe,Cr)2O3, α-Fe2O3, and α-Cr2O3. The
FeCr phase is also shown, but only on as the developed specimen which indicates the thin of oxide
scale on the substrate surface. For the implanted specimens, the main oxide scale obtained were α-(Fe, Cr)2O3, α-Fe2O3, α-Cr2O3. The presence of the peak of the original alloy indicates that oxide scale was
formed as a thin layer which dominated by the presence of Cr-rich oxide and small peaks of solid solution chromium iron oxide (Fe,Cr)2O3 [10, 13-15]. On the contrary, FeCr alloy that implanted with
titanium dopant, all strong peaks were dominated by the presence of α-Fe9TiO15, hematite Fe2O3 and
small peaks of solid solution chromium iron oxide (Fe,Cr)2O3, although the presence of the peaks of
6
1234567890‘’“”
ICEAMM 2017 IOP Publishing
IOP Conf. Series: Materials Science and Engineering 343 (2018) 012004 doi:10.1088/1757-899X/343/1/012004
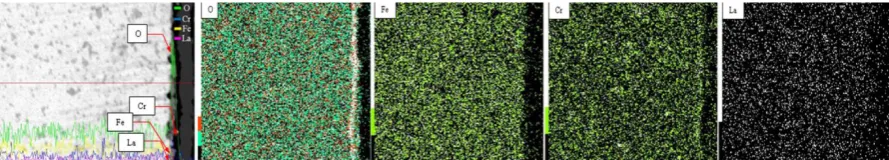
Figure 5. Cross-sectional EDS mapping analysis of FeCr implanted with La oxidized at 900oC
Fig.5 above shows that the scale formed on FeCr alloy that implanted with lanthanum consisted of corundum oxides layer of Cr2O3 wich confirmed by EDX mapping analyses which indicated by high
presence of Cr rich oxide on the inner of oxide scale, while, the EDX mapping analyses indicates that the presence of Fe was found on the outer of oxide scale with small amount of Fe on the formation of FeO. However, EDX mapping analyses is not clear to detect the presence of Lanthanum on the oxide scale due to low doses of Lanthanum that implanted in to substrate of the alloy. This phenomenon indicates that the lanthanum implantation significantly to reduce the growth of oxide scale by reducing the Cr3+ ions diffuses to the surface of the specimens. where the enhancement of Cr diffusion guarantee the stable growth of the Cr-rich in the inner of the oxide scales, which significantly improve oxidation resistance, even a Cr2O3 scale may be formed at higher temperatures owing to
the higher diffusion rate of Cr.
Figure 6. Cross-sectional EDS mapping analysis of ferritic steel implanted with La oxidized at 900oC
Fig.6 above shows that the Cr concentration in ferritic steel is still not sufficiently high to allow the formation of a more protective Cr2O3 layer, while the iron ions dissolve in and diffuse rapidly through
the Cr2O3 scale and eventually an outer layer of fairly pure iron oxides will result. It may be caused by
Fe and Cr ion transport is predominant then make the scale growth will proceed outwards, the oxygen transports through the FeO layer to the Cr2O3 layer and the Cr ions diffuse to the same layer; both of
them react with each other, which make the oxide scale become thicker. Furthermore, due to the loose and incompact scale, thus causing the crack in the surface of the specimen which increase the rate of Cr evaporation. The oxygen may diffuse to the oxidation/alloy interface through the cracks and pores in the oxide scale. This phenomenon was confirmed by XRD results as shown in Fig. 3, where the result shows that the oxide phase that formed on the surface of ferritic steel that implanted with lanthanum is dominated by the presence of Fe2O3. It’s also reinforcement by mass gain change and
parabolic rate constant (kp) as presented in Fig. 3. It can be noticed that a discontinuous Cr2O3 scale
was formed, but could not protect the alloy from internal oxidation. At the same time, Fe became enriched and diffused outwards, which caused the formation and rapid growth of FeO, although it has been implanted with lanthanum due to the higher crystallite size effect.
4. Conclusion
Based on the results obtained in the oxidation of implanted and un-implnted FeCr alloys and ferritic steel at 900oC for 100 h the following conclusions can be formulated:
1234567890‘’“”
ICEAMM 2017 IOP Publishing
IOP Conf. Series: Materials Science and Engineering 343 (2018) 012004 doi:10.1088/1757-899X/343/1/012004
scale/substrate interface during oxidation process which presents the homogenous structure with good adherence and a uniform inter-diffusion layer between substrate and oxide layer. 2. The specimens that implanted with lanthanum show better promoting the formation of Cr2O3
in large amount compositions which indicated that chromium preference diffused outward to form a Cr2O3 layer.
3. The oxide scale formed on the surface of FeCr alloys and ferritic steel that implanted with titanium dopant was thicker oxide scales indicating that significant increase in oxidation weight gain. It can be noticed that titanium implantation ineffectively promotes Crrich oxide. At the same time, the amount of Fe increased and diffused outwards, which caused the formation and rapid growth of FeO. Furthermore, FeO nucleated and grew at the discontinuous areas such as the incompact Cr2O3 scale or its micro-defective areas; leading to
some bulges and cracks.
5. References
[1] Kulekci, M. K. 2008. Magnesium and its alloys applications in automotive industry. The International Journal of Advanced Manufacturing Technology, 39(9), 851-865.
[2] Cooper, L., Benhaddad, S., Wood, A., & Ivey, D. G. 2008. The effect of surface treatment on the oxidation of ferritic stainless steels used for solid oxide fuel cell interconnects. Journal of Power Sources, 184(1), 220-228.
[3] Korsunsky, A. (Ed.). 2012. Current Themes in Engineering Science 2010. American Institute of Physics.
[4] Hui, R. 2013. Materials and Processing for Metal-Supported Solid Oxide Fuel Cells. Materials for High-Temperature Fuel Cells, 309-340.
[5] Saryanto, H., Deni, S. K., Untoro, P., Saleh, M. H., & Sebayang, D. 2010. Determination of Nanocrystalline Fe80Cr20 Powder based Alloys using Williamson-Hall Method. In Advanced materials research (Vol. 129, pp. 999-1003). Trans Tech Publications. [6] Sachitanand, R., Sattari, M., Svensson, J. E., & Froitzheim, J. 2013. Evaluation of the
oxidation and Cr evaporation properties of selected FeCr alloys used as SOFC interconnects. international journal of hydrogen energy, 38(35), 15328-15334.
[7] Ali-Löytty, H. 2013. Microalloying Mediated Segregation and Interfacial Oxidation of FeCr Alloys for Solid-Oxide Fuel Cell Applications. Tampereen teknillinen yliopisto. Julkaisu-Tampere University of Technology. Publication; 1114.
[8] Saryanto, H., Sebayang, D., & Untoro, P.2017, May. Cross-Sectional Investigations of Oxide Scale Nanocrystalline FeCr Alloys after High-Temperature Oxidation Test at 900° C. In IOP Conference Series: Materials Science and Engineering (Vol. 196, No. 1, p. 012030). IOP Publishing.
[9] Hilpert, K., Quadakkers, W. J., & Singheiser, L. 2003. Interconnects. Handbook of Fuel Cells. [10] Sebayang, D., Khaerudini, D. S., Saryanto, H., Othman, M. A., Sujitno, T., & Untoro, P.
(2011).
Effect of Nanocrystalline and Ti implantation on the oxidation behaviour of Fe80Cr20 alloy and commercial ferritic steel. In Key Engineering Materials (Vol. 474, pp. 2134-2139). Trans Tech Publications.
[11] Lessing, P. A. 2007. A review of sealing technologies applicable to solid oxide electrolysis cells. Journal of Materials Science, 42(10), 3465-3476.
[12] Akanda, S. R. 2012. Mechanical Characterization of Coating-Interconnect Interfaces and Anode-Electrolyte Interfaces for Solid Oxide Fuel Cells. The Ohio State University.
[13] Sebayang D et al Oxidation Resistance of Fe80Cr20 Alloys Treated by Rare Earth Element Ion
Implantation. Current Themes In Engineering Science 2010: AIP Conference Proceedings. 1394. No. 1 pp 90-102.
[14] Hendi, S., Darwin, S., Pudji, U, & Tjipto, S. 2009. Ion implantation process of Lanthanum and Titanium Dopants into a substrate of Fe80 Cr20.
8
1234567890‘’“”
ICEAMM 2017 IOP Publishing
IOP Conf. Series: Materials Science and Engineering 343 (2018) 012004 doi:10.1088/1757-899X/343/1/012004