Tooth Color Detection Using PCA and KNN Classifier
Algorithm Based on Color Moment
Justiawan, Riyanto Sigit, Zainal Arief
Dept. of Electrical Engineering, Magister Program of Engineering Technology Politeknik Elektronika Negeri Surabaya
Kampus PENS, Jalan Raya ITS, Sukolilo 60111, Surabaya E‐mail: [email protected],{riyanto,zar}@pens.ac.id
Abstract
Matching the suitable color for tooth reconstruction is an important step that can make difficulties for the dentists due to the subjective factors of color selection. Accurate color matching system is mainly result based on images analyzing and processing techniques of recognition system. This system consist of three parts, which are data collection from digital teeth color images, data preparation for taking color analysis technique and extracting the features, and data classification involve feature selection for reducing the features number of this system. The teeth images which is used in this research are 16 types of teeth that are taken from RSGM UNAIR SURABAYA. Feature extraction is taken by the characteristics of the RGB, HSV and LAB based on the color moment calculation such as mean, standard deviation, skewness, and kurtosis parameter. Due to many formed features from each color space, it is required addition method for reducing the number of features by choosing the essential information like Principal Component Analysis (PCA) method. Combining the PCA feature selection technique to the clasification process using K Nearest Neighbour (KNN) classifier algorithm can be improved the accuracy performance of this system. On the experiment result, it showed that only using KNN classifier achieve accuracy percentage up to 97.19 % in learning process using 10 fold cross validation while combining PCA with KNN classifier can reduce the 12 features to the 8 features which can improve the accuracy percentage up to 97.81 %. Adding PCA as the feature selection method can be improved the accuracy performance of this color matching system with little number of features.
Keywords: Color Matching, Feature Selection, Teeth Images, PCA, KNN, RGB, HSV, LAB, Color Moment
Volume 5, No. 1, June 2017 140
1. INTRODUCTION
Feature extraction and classification are the part of image processing system which have many application in medical fields. Color matching system is one of application which can be used for clinical dentistry. Presently, dentist use shade guides for describing tooth shades information about color reference standard. However matching the suitable color for tooth reconstruction is an important step that can make difficulties for the dentists due to the subjective factors of color selection. Traditionally, dentist usually select suitable shade tabs by their naked eyes which can make the results were unreliable and inconsistent. Color matching system using digital images can minimize the gap of color communication between the dentists to the patient teeth that can influence to the aesthetic value in dental care treatment [1][2]. However the almost same color of the teeth images, the lighting intensity environment will be influenced to the color matching system. A color description should be described in detail the color distribution of tooth surface. The central area of tooth are chosen for matching color on natural teeth and will be used as an effective content for shade comparison[1]. Therefore, providing a simple process with high accuracy level of teeth color matching is the main requirement in this system. Basically the color of teeth is a white color with different value. A color can be produced by a combination of its basic elements which is called color space parameter. Each color has at least three basic elements as RGB, CMY (K), HSV, CIE XYZ, Lab, Luv and YCrCb[3,4]. There are several color space that have been widely used in some research. According to the basic elements of color, RGB, HSV and Lab are the simplest parameter which are used in color analysis system [3]. However the color space properties of teeth are nonuniform and involve a complex layering of tooth structure[5], it is required addition technique for determining spesific feature of each tooth. Analysis technique using color moment with the simple mathematical calculation can be applied for determining the specific features based on its color space properties.
Images classification is a set techniques and method to identify images according to their content or feature [6]. In order to provide the suitable teeth color images based its spesific feature, it is required addition algorithm to classify the features based on formed features from each color space properties. In other side, due to the many features from each color space based on color moment calculation, reducing the features number is an essential step before any classification data can be performed. Principal Component analysis (PCA) is one of the popular methods used and can be reduced the features to preserve most of the relevan information of the original features according to some optimality criteria [7].
that have been taking before using digital camera in 288 lux lighting parameter. Combining the PCA and KNN classifier algorithm can be improved the accuracy level percentage which is also followed by reducing the features number of this system. In this paper will be compared the performance between only using KNN classifier algorithm and using combination from PCA and KNN classifier algorithm.
The rest of paper is organized as follows: related work of feature selection and tooth color matching system is explained in section II, section III shows the proposed feature selection to the images of tooth color, section IV shows the simulation result involve the performance analysis of the proposed system. Finally, we conclude the results in section VI.
2. RELATED WORKS
Feature selection or feature extraction is a process for creating new variables as combintions of others to reduce the dimensionality of selected features [8]. Dimensionality reduction of a feature set is a common preprocessing step used for pattern recognition and classification applications in compression schemes [7]. The most well‐known of dimensionality reduction algorithm is PCA. Using the covariance matrix and its eigenvalues and eigenvectors PCA finds the “principal components” in the data which are uncorrelated eigenvectors for each representing of proportion of variance data [8]. PCA and many variations of it have been applied as a way of reducing the principal features in face tracking and content‐based image retrival problem in [7].
Face recognition system based on skin detection using PCA as reduction method followed by KNN classifier has been proposed in [9]. The result show that the recognition rate is from 88% to the 90 % for RGB and YcbCr color space in this skin detection. The enhancement of face detection using skin color is proposed by [10]. Recogition part consist of three steps : Gabor feature extraction, feature selection using PCA and KNN based classification. This research show that having improvement of recognition rate up to 96 % for face detection system.
Feature selection for Network intrusion Detection System (NIDS) have been applied in [11]. Using Genetic Algorithms (GA) and Particle Swarm Optimization (PSO) can be significantly reduces feature number and improving the classification accuracy up to 99.7%.
Volume 5, No. 1, June 2017 142
Color moment as the indexing technique, is encoded in the color index by dividing the image horizontally into three equal non‐overlapping region. The three moments (mean, variance and skewness) are extracted from each region of the color space which is used. This technique is applied for improving the color indexing process and obtaining the specific features from the system. High accuracy result tooth color matching system which is followed by features reduction will be influenced by the kind of algorithm for modeling the system based its features. The output from modeling system will be applied to the matching system as the learning and the testing process. In this paper, we propose the feature selection for teeth images which is applied for color matching system. The performances anlysis are according to the kind of color space and the kind of modeling system algorithm that is using KNN or using PCA and KNN combination. From the result, we can analyze the performance based on its accuracy in learning and testing process. With the result, we can obtain the best color matching system which can be applied to the real hardware based on kind of color space and kind of modeling system.
3. ORIGINALITY
From some relatively researher, it has considered that there are many color matching system for dental application. In Indonesia there are many dentist still use the conventional method for shade matching system. Due to the difference characterictic colors of indonesian people teeth, and the others main factors which can be influenced to the result of shade matching system. combining and comparing the previous result, we proposed comperehensive comparison of color matching system by using 3 types of the color space which is followed by feature selection. The color spaces are RGB, HSV and LAB. The color indexing technique is using color moment which is suitable for digital image system. Combining the PCA algorithm for reducing the feature numbers with KNN classifier for determining the spesific type of teeth color is the main result of this sytem. Therefore the datasheet of the system is collecting valuable information from some collected information on dental shade guide database and also compared to the indonesian teeth color condition. The Indonesian teeth color are taken from digital camera to each patient teeth using 288 lux lighting. Than, it were compare to the suitable shade guide database from RSGM UNAIR Surabaya. There are 16 types shade guide color which are used to this system according to the real condition. This system is built to be able to be used on teeth recognition for color matching system which is useful for the dentist for taking the treatment to the patient and also for science according the performance of analysis result.
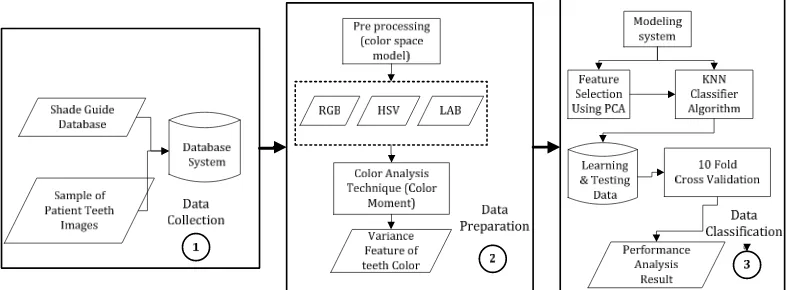
4. SYSTEM DESIGN
and also taking sample images teeth data from hospital (RSGM) patients. The images of this system, is obtained from digital camera with 288 lux lighting intensity. According to the sample images data will be compared to the shade guide database for determining the suitable color characteristic of the Indonesian pepople. From this step, it were obtained 16 images data from shade guide which was compatible with patient teeth condition. In database system, there are shade guide teeth images as the parameter and sample images teeth of RSGM patient.
Figure 1. System design of feature selection for teeth images in dental color matching
The second step is data preparation to determine the color space model of this system. There are 3 color space model which are used for this system. Those are RGB, HSV, and LAB. Each color system model should be applied at all images data. From the color model result we can analyze the characteristic of each color model using color moment technique. The output from this step is the variance feature of teeth color in database. In modeling system, there are two main process. Those are feature selection using PCA for reducing the number of features based its eigenvalue. After that, the variance feature result should be classified based on ID number of teeth from the shade guide database system using KNN classifier. Due to the advantage and disadvantage of color space and the modeling system step, we can compare based on the performance result from learning and testing process.
4.1 Parameter Data
This research uses patients data which are obtained from RSGM UNAIR Surabaya which have been adopted before using shade guide database. The color image of shade guide which are used for this system, are ilustrated at Figure 2.
Volume 5, No. 1, June 2017 144
Figure 2. Images of color shade guide database
There are 16 types color images of shade guide which are applied to this system. Each image should be converted to the 40 x 40 pixels size, as ilustrated in Fig. 3. The images are divided into 3 part for horizontal and vertical direction. The middle of intersection results is the images color that will be processed to the next step.
Figure 3. Images of color shade guide database at 40 x 40 pixel size
4.3 Color Analysis Technique
applied for tools in color matching system are RGB, HSV and LAB. RGB using basic element of Red, Green and Blue to produce the colors. All of the other colors is obtained from its combination. HSV is abbreviation from Hue, Saturation and Value. In some research, HSV color models is often used as the human color parameter. This is because HSV can be arrested easily using human eyes than RGB color models. The equation for calculating the HSV value from RGB value is described as:
(
)
(
)
(
R G B)
After calculating the value (V) of HSV it can be continued for determining the Hue (H) and Saturation (S) parameter from the value of r,g,b, which is
LAB is the color models based on the wavelength of the light. While the transformation of RGB color models to the LAB is calculated using this following equation[4]:
= 0,412453 + 0,357580 + 0,180423 (5)
= 0,212671 + 0,715160 + 0,072169 (6)
= 0,019334 + 0,119193 + 0,950227 (7)
The value of LAB can be defined as following equation:
Volume 5, No. 1, June 2017 146
f(q) function can be determined using this following equation:
!" = # !$%, & ! > 0,008856
7,787! + 16/116, *ℎ, -*ℎ,./ (11)
Xn, Yn, Zn value is obtained from R=G=B=1 with the range of R, G, B (0, 1) [4].
After obtaining the color model from the database, the moment feature colors can be determined from statistical calculation as mean, standard deviation, skewness and kurtosis. The mean value is giving the distribution size of this system based on this equation:
0 =231 ∑ ∑ 52681 3781 67 (12)
Variance is the area of distribution system, while the square root from variance is called standard of deviation. The equation of deviation standard is derived as:
The skewness is decleared the size of asymetry condition. The distribution to the left side when it have negative value of skewness, while the distribution to the right side when it have positive value of skewness. The normal distributrion or symetry condition is obtained from null value of skewness. The value of skewness can be calculated using this equation:
3
4.3 KNN Classification Algorithm
K‐Nearest Neighbors algorithm (KNN) is a non‐parametric method used for classification and regression. The data input of KNN consists of the k closest training examples in the feature space. KNN is included at the instace‐based learning group [15].
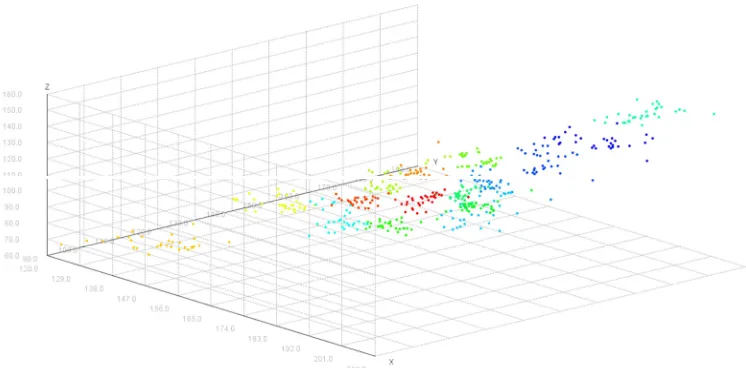
Figure 4. 3D scatter graph of 16 color teeth types using RGB color space
According to the data distribution in scatter graph Fig.4., It shows that there are some clusters or groups based its tooth type and there are some mixed group in there. KNN is the suitable algorithm for separating the cluster or group which is started from finding the group of k object in data training that is nearest data to the new data or testing data. There are many method for measuring the distance among the testing data as the new data and the training data as the old data. One of them is using euclidean distance [9,10]:
@&/*ABC, = D A1− E1"?+ A?− E?"?+ ⋯ + AG− EG"? (16)
an and bn are the features value from the two records. When the features
value of two record data are compared, and the value is 0 its means the data is almost same or same. While the value is 1, it means the data is not same. The simillarity value of feature can be calculated using following equation:
/&H&IA.&*J K, !" ∑NR$L MN,ON"P QN
QN (17)
Volume 5, No. 1, June 2017 148
show from the output of rapidminer simulator. The performance result will be explained in the next section.
4.4 PCA-KNN Tooth Color Detection
Principal Component Analysis (PCA) is a dimensionality reduction which is used for compresion and recognition problem [7‐10][16,17]. Tooth color images which have white as the main color are difficult for machines to classify each type of tooth. PCA creates reduced‐dimension images feature that have almost same features data. The reduced‐dimension images feature are obtained by indentifying a few most influential parameters. The parameters are eplained the greatest amount of variation in dataset.
Using the covariance matrix, eigenvalue and eigenvectors, PCA finds the “principal components” in the data which are uncorrelated eigenvectors each representing some proportion of variance in the data. The PCA basis vectors are defined as eigenvectors of the total scatter matrix ST of M images[9]:
ST = ∑ U2681 6 − V" U6 − V"T (18)
F is the features of each images based on color moment calculation as listed in eq. (12‐15), while xi(1,2,3,...,12) is the feature number with its coloumn
concatenated in vector. According to the ST basis vector, it can be determined
the threshold value based on the total of cummulative variance data. In this systme, the threshold of cummulative variance data is ± 95 % from the all of data. From the ±95 % choosen features, the projection matrix of WPCA is
formed from k eigenvectors which is corresponding to the k largest eigenvalues. PCA yields the projection which is the maximum data from the total scatter. It can be occured due to the environment condition such as the lighting noise from the captured result of the tooth. The new features vectors Ykare defined by this following linear transformations[9]:
W = XT W, Y = 1,2, … [ (19)
W is chosen for maximizing the determinant of the scatter matrix total from projected samples as[9]:
X = arg maxaXTSTXb → W = aSTXb → aX1X?… X2b (20)
W is the set of M‐dimensional eigenvectors of ST which is corresponding to
the M as the largest eigenvalues.
After determining the main parameter from PCA algorithm, the next step is training phase based on the tooth images database at each color moment value calculation. The training set of M tooth images can be represented as each color space type :
Vdef = a g hi j k g hi j h g hi j hbT
Vpqf= a g hi j k g hi j h g hi j hbT
m represent as mean, SD is the standard deviation, k is the kurtosis value and s is the skewness calculation. The training set of each color space will be calculated the average of tooth type images which is defined by:
Vr =21∑2G81Vdef,lhm,pqf (22)
Each images should be calculated from the average tooth color by the vector:
Φ6 = aVdef,lhm,pqf − Vrb (23)
Where i = 1 to M of captured images each tooth type with N x M dimension. M will be set to the orthogonal vectors for describing the input data using covariance matrix calculation as shown from following equation[9]:
t = 21∑ Φ2 TΦ
681 (24)
The eigenvalue λi and the eigenvectors ui are determined from covariance
matrix C which is the real and symmetric data as shown as:
u6=21∑ vA. w6. V def,lhm,pqf"2 T"
681 (25)
In PCA, we choose only the best k eigenvectors (with the highest k eigenvalues). The elimination of the smallest eigenvalues can be followed by minimum number of eigenvectors which is greater than cummulative variance threshold = 95 %. From the new features that was formed by PCA algorithm, we can reconstruct images in the new spaces with the best eigenvectors that is described to this equation:
aV def,lhm,pqf"− VrbL6Gyz= ∑ aVpW81 def,lhm,pqf"− Vrb6G6{6yz. w6W (26)
Volume 5, No. 1, June 2017 150
5. EXPERIMENTAL RESULT
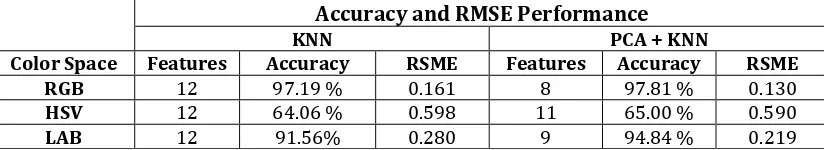
In this section will be described the performance analysis of this system. there are 3 kinds of performance that will explain. Those are performance system based on learning accuracy, validation accuraccy for each kind of color space and each modeling system scenario. There are two kinds of modeling system which will be analyzed in this section, those are using KNN as the classifier algorithm and using combination of PCA and KNN to this dental color matching. According to the color analysis phase, there are 640 total data and have 16 class data which will be classified using KNN at every color space (RGB, HSV and LAB). For the accuracy level evaluation of learning process, 10 fold cross validation will be used.
In the 10 fold cross validation process is using stratified sampling data which is built the random subset to arrange the distribution data as the real data. The function of cross validation method is avoid the overlapping condition at the testing process. There are two steps of cross validation method. First, Divided the data to the same of k subset and than using the each subset for testing data and the residue for training data. According to this system 10 fold cross validation will be iterated the result up to 10 times. When there are 640 total data, in the first iteration 64 data will be used for testing data and the 576 data will be used for learning data, and this process will be iterated up to 10 times. The result of the cross validation will be obtained from the average of 10 iterations process. The experimental result of this system is listed at Table 1. There are two parameter which will be analyzed in this system. Those are accuracy percentage and the error (RMSE).
Table 1. Experimental result accuracy and RMSE level performance in KNN and PCA+KNN combination using 10 fold cross validation
Accuracy and RMSE Performance
KNN PCA + KNN
Color Space Features Accuracy RSME Features Accuracy RSME
RGB 12 97.19 % 0.161 8 97.81 % 0.130
HSV 12 64.06 % 0.598 11 65.00 % 0.590
LAB 12 91.56% 0.280 9 94.84 % 0.219
After that, the feature number of each color space will be selected and reduced using PCA. In this system, the feature selection of PCA based on ±95% threshold of cummulative distributif variance value from the data. The features number of RGB and LAB can reduce from 12 features number to the 8 and 9 features number, while the HSV features is only reduced from 12 features to the 11 features. The features number will be influenced to the classification process using KNN as listed in Table 1. The result show adding feature selection using PCA can improve the accuracy percentage in learning although the feature number have been reduced. The RMSE value is influenced by the percentage which have inverse correlation. When the accuracy is increased the RMSE will be decreased. It prove from the result at Table 1.
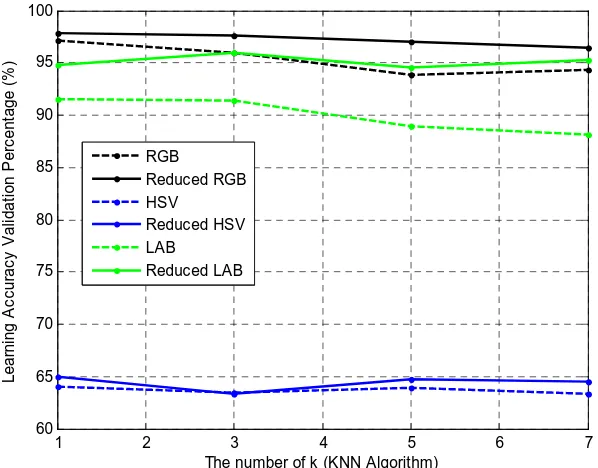
Figure 5. The Accuracy level performance of learning process based on the k value modification using 10 fold cross validation
The number of k in KNN classifier algorithm is also influenced to the accuracy perfomance of learning with 10 fold cross validation as shown in Fig. 5. The result show that the accuracy performance has fluctuative influence to the number of k. RGB color space has reduction performance from 97.19 % to the 94.38 % when the number of k increased in without feature selection process. Although adding the feature selection process the accuracy performance in k =1 is better performance up to 97.81 % than the accuracy performance in k = 3,,5,7. The HSV color space with k value = 1 in classification process have highest level accuracy in 65.00 %. While using LAB color space model is achieved highest level accuracy in 95.94 % with k value = 3 in adding PCA to the KNN classifier algorithm. This condition show
Volume 5, No. 1, June 2017 152
that the value of k in KNN classifier algorithm has saturation condition based on its data distribution.
The k value of KNN classifier algorithm is also influenced with fluctuative influence to the accuracy performance of learning with leave one out cross validation as ilustrated in Fig. 6. RGB, HSV and LAB color space have better performance in k value = 1 for all modelling system (without PCA). The LAB color space is achieved highest accuracy level in k value = 3 and RGB, HSV color space have better performance in k value = 1, when adding the PCA feature selection.
When the result is compared based on the kind of color model, RGB is achieved the best performance in using PCA+KNN algorithm. It is because capturing image of this system is always constant in 288 lux lighting. RGB color model will achieve better performance when the lighting is stable.
7. CONCLUSION
In this we propose the feature selection of teeth images for dental color matching system using PCA and KNN classifier algorithm. The compatible modeling system and color model can be influenced to the performance analysis of this system. there are 2 comparison analysis of this system. those are based on the kind of color model and based on modeling system. The best performance of color matching system at the stable lighting condition in 288 lux is achieved by using RGB color with combination of PCA and KNN algorithm. It has 97.81% accuracy of learning process and 0.130 RMSE value in 10 fold cross validation process.
REFERENCES
[1] W.K. Tam, H.J. Lee, Dental Shade Matching Using Digital Camera,
The Journal of Dentistry Elsevier, pp. e3‐e10, June 2012.
[2] Stephen J. Chu, Richard D. T., and Rade D. Paravina, Dental Color Matching Instruments and Systems (Review of Clinical and Research Aspects), Journal of Dentistry Elsevier, pp. e2‐e16, July 2010.
[3] S. Mangijao Singh, K. Hemachandran, Image Retrieval Based on The Combination of Color Histogram and Color Moment, International Jounal of Computer Applications, vol. 58, No.3, November 2012.
[4] Shuli Wang, Weiting Wang, and Fan Wu, A Computer-Aided Analysis on Dental Prosthesis Shade Matching, 4th International Conference on Biomedical Engineering and Informatics (BMEI), pp. 1950‐1954, 2011.
[5] Dan S., Marius D. P., Marius D. S., Vladimir B., Tudor C., and Simona B.,
A Software Application to Detect Dental Color, Applied Medical Informatics Journal, vol. 37, no. 3, pp: 31‐38, 2015.
International Conference Computer Graphics, Imaging and Visualization(CgiV), pp. 390‐393, April 2016.
[7] Fengxi Song, Zhongwei Guo, Dayong Mei, Feature Selection Using Principal Component Analysis, International Conference on System Science, Engineering Design and Manufacturing Informatization(ICSEM), pp. 27‐30, November 2010.
[8] Zena M. Hira and Duncan F. Gillies, A Review of Feature Selection and Feature Extraction Methods Applied on Microarray Data, Hindawi Publishing Corporation Advances in Bioinformatics, vol. 2015, 13 pages, 18 May 2015.
[9] Fatma zohra C., Noureddine C., and Amar D., Face Recognition System Using Skin Detection in RGB and YcbCr Color Space, 2nd World Symposium of Web Applications and Networking (WSWAN), 21‐23 March 2015.
[10] B. Dhivakar, C. Sridevi S. Selvakumar and P.Guhan, Face Detection and Recognition Using Skin Color, 3rd International Conference on Signal Processing, Communication and Networking (ICSCN), 2015. [11] Iwan Syarif, Feature Selection on Network Intrusion Data Using
Genetic Algorithm and Particle Swarm Optimization, Emitter International Jounal of Engineering Technology, Vol. 4, No. 2, 2 December 2016.
[12] Hasan Suat G., Bulent P., Dogan C., Sila M.,G., and Volkan A., Shade Matching Performance of Normal and Color Vision-Deficient Dental Professionals with Standard Daylight and Tungsten Illuminats, The Journal of Prosthetic Dentistry, vol. 103, Issue 3, pp. 139‐147, March 2010
[13] S. Mangjiao Singh, K. Hemachandran, Content-Based Image Retrieval Using Color Moment and Gabor Texture Feature, IJCSI Issues, Vol.9, No.1, September 2012.
[14] Riyanto Sigit, Achmad Basuki, Nana Ramadijanti, Dadet Pramadihanto,
Step By Step Pengolahan Citra Digital, 2014
[15] Jihong Liu, Na Zhao, Runnan H., Study of Color Matching System for Porcelain Teeth, ICMIPE, 19‐20 October 2013.
[16] Hongtan Sun, K-Nearest Neighbour and SVM Classifier with Feature extraction and Feature Selection, final project for CSCI 6967 : Foundation of Data Sciences, May 11, 2015.