! " #$ !
% & '( )
1 INTRODUCTION
The development of mapping technology based on applications, proposed by Hosse and Schilcher, 2002, to locate and excel superior commodities such as corn, sweet potatoes, cassava, soybeans, green beans, and peanuts on available land continues to be abundant. Accordingly, we as Indonesian society only know that the agricultural land which has good quality exist only in big cities. However, there are land in small towns which also produce the same quality of crops. Based on this problem, the author have an idea to do a research regarding the distribution of food crops. This research is based on Geographic Information System (GIS) that can locate the location of the distribution of food crops in Sulawesi and Maluku islands.
Geographic Information System (GIS) is a specialized information system that manages data which has spatial information (spatial reference). In other words, it is a computer system that has the ability to build, store, manage and display geographic information, such as data identified by location, which is provided in a database. GIS can be decomposed into several subsystems as follows: (1) Input Data. This sub1system is responsible for collecting, preparing, and storing spatial data and its attributes from various sources. This sub1system is also responsible for converting or transforming the
original data formats into a format that can be used by the GIS device in question. (2) Output Data. This sub1system is in charge of displaying or producing output (including exporting it to the desired format), all or part of the database (spatial) in both softcopy and hardcopy forms such as tables, report graphs, maps, and so on. (3) Data Management. This sub1 system organizes both spatial data and associated attribute tables into a database system in such a way to be easily recalled or retrieved, updated and edited. (4) Data Manipulation & Analysis. This sub1system determines the information that can be generated by GIS. In addition, this sub1system also manipulates (evaluation and use of mathematical functions and operators & logic) and data modeling to produce expected information (Prahasta, E. 2007).
2 RESEARCH METHOD
The objectives of the development of this application is the development of distribution area of the leading food crops in Sulawesi and Maluku region, namely are in the Sulawesi and Maluku Island. Previous research was already done which focused on the distribution of superior food crops throughout the province in Java, Sumatra and Kalimantan Island. In this research, the development of previous research method was done to accommodate Geographic Information System of
Development of Crops Featured Commodities Application in Sulawesi
and Maluku Island Based on Geographic Information System
Fenni Agustina
Emy Haryatmi
E. Susy Suhendra
Teddy Oswari
distribution of leading food plants in Sulawesi and Maluku region using Google Map and Fusion Database. The development of research method includes the development of database structure for all provinces in Sulawesi and Maluku Island. Data mapping was done in the territory of the State consisting of several Regions/Islands. Each Region has several provinces and each Province consists of several districts.
The research used waterfall methodology as a Software Development Life Cycle (SDLC) method. There are five stages that had been done in this research. The first stage is analysis requirement of the research. Data and the software are the main source in this research. The data used in this research is superior food crop data in all regencies in Sulawesi Island and Maluku such as Corn, Green bean, Peanut, Soybean, Rice, Sweet potato, and Cassava. The indicator of this data is based on harvests, production and productivity in 2012, 2013 and 2014. This data had been calculated and provided in the Ministry of Agriculture of Republic of Indonesia, including the data on distribution of all main crops in the provinces of North Sulawesi, South Sulawesi and Maluku. The average harvested area from 2012 to 2014 in South Sulawesi decreased in most districts and only a few areas increased. As a result, the indicator of production from year to year decreased and productivity generally fluctuated in the three years above. The average harvested area from 2012 to 2014 in Maluku decreased in most districts and only a few areas increased. The Data of Production and productivity indicators for 2013 and 2014 could not be obtained. For the system, we used google map API technology, PHP, MySql and web server.
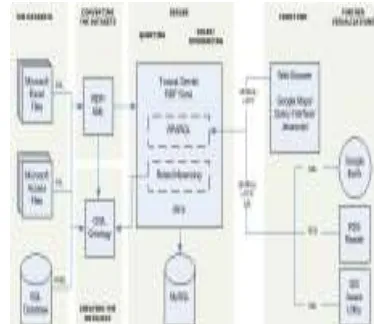
The second stage is system design. The methodology used in this study is the development of systems using Google Map technology and Database Fusion. Figure 1 is a workflow view of the method used. Frontend requests an interface to the server received by SPARQL. Data entered through TamCat servlet is matched and adapted to the available knowledge base in datasets based on its ontology, and the results (Ontology/Web Ontology Language/RDF) are transferred back into the server for queries based on the Ontology.
Figure 1. Database Connection Methodology
Based on the analysis of system development that was done previously, the implementation of the database required a table structure design that can cover the needs of the system. Figure 2 is a table structure that was used in the system which includes State Table, Region Table, Provincial Table, District Table, Plant Table, Indicator Table, and Year Table along with each attribute contained in the table.
Figure 2. Table Structure
The development of the database structure makes it easier for the developers if the data changes. If there is any change (addition, update, and or deletion) of data in a particular section, it will not affect the overall data structure. The following is an explanation of each table used in the system:
1. Country Table shows the location of country which consists of Id_ countries and Nm_countries. For example, table 1 contains N01: country code, with the name Indonesia.
Table 1. State Table Id_State Nm_State
N01 Indonesia
! " #$ !
% & '( )
is connected with id_new as a foreign key. For example, Table 2 contains R 01 04 as an Id_region. 01 is the state of Indonesia, 04 is the region / island of Sulawesi. For Id_region R 01 05 has meaning of 01 is Indonesia as Indonesia country, and 05 is Maluku Island.
Table 2. Region Table Id_region Id_State Nm_region R0104 N01 Sulawesi R0105 N01 Maluku
3. Provincial Table shows all provinces in Sulawesi and Sulawesi which consist of Id_provinsi, Id_region, and Nm_provincial. Provincial data connected with Id_region as foreign key. For example, table 3 contains P 01 04 24 as Id_province. 01 is the country of Indonesia, 04 is the region / island of Sulawesi, and 24 is the serial number of North Sulawesi Province. For Id_Province P 01 05 30 have meaning of 01 is Indonesia as a country, 05 is Maluku Island, and 30 is the serial number of Maluku Province.
Table 3. Table Province Id_province Id_region Nm_province P010424 R0101 Sulawesi
Utara P010428 R0101 Sulawesi
Selatan P010530 R0101 Maluku
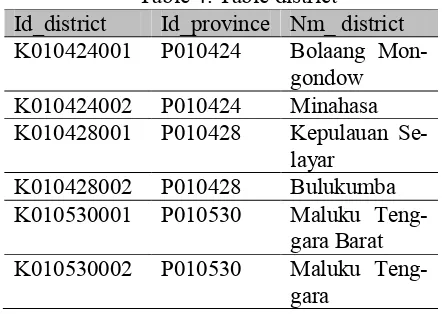
4. Regency Table, this table shows all districts in each province which consist of Id_kabupaten, Id_provinsi, and Nm_regency. The regency data is connected to the provincial Id_province as a foreign key. For example, table 4 contains K 01 04 24 001 as Id_district. 01 is the country of Indonesia, 04 is the region / island of Sulawesi, 24 is North Sulawesi Province, and 001 is the serial number of Bolaang Mongondow Regency and so on.
Table 4. Table district Id_district Id_province Nm_ district K010424001 P010424 Bolaang Mon1
gondow K010424002 P010424 Minahasa K010428001 P010428 Kepulauan Se1
layar K010428002 P010428 Bulukumba K010530001 P010530 Maluku Teng1
gara Barat K010530002 P010530 Maluku Teng1
gara
6. Table 6 is the indicator table used in the database. The Indicator table shows indicators on each plant which consists of Id_ indicator, Nm_ indicator, and Unit. For example, table 6 contains I01. I01 is the Area of Harvest in Hector Are (Ha) and so on.
Table 6. Indicator Table Id_indicator Nm_indicator Unit I01 Harvested
area HA
I02 Production TON I03 Productivity Ku/HA
7. Table 7 is Year table. It shows the year of the harvested area, production and productivity for each province. For example, tabel 7 contains Y01. Y01 is the year of 2012. of Geographic Information System was integrated with google map. Google map can show the distribution of main crops in Sulawesi and Maluku island. User can choose three categories such as harvested area, production, and productivity in 2012, 2013, and 2014. The user can also view the data from the table provided in the website.
The fourth stage is the testing of the system. The testing of the website of Geographic Information System was done using browser in PC which connected to internet. The testing was done to make sure that the system can run properly.
The last stage is maintenance of the system. In order to maintain the website, user guide book and operation book were made. The user guide book is for the users who visit the website. The operation book was made to maintain the system for administrator in order to update or change the data.
3 RESULT AND DISCUSSION
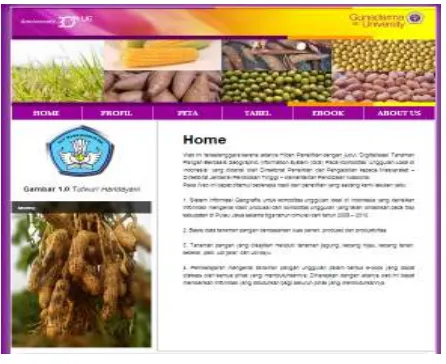
The description below is regarding the GIS Web Design Interface "Development of Food Crops Integration Application Based on Geographic Information System (GIS) in Main Commodities in Sulawesi Island and Maluku". (1) On Index page which provided in figure 3, there are 7 menu consisting of Home, Profile, Map, Table, E1book, and About Us.
Figure 3. Index Page
(2) On the Profile page, there is a detailed explanation of the Function and How it Works for all the content on the GIS Website. (3) On the map page, there is a standard view of the State of Indonesia. The accessible islands are Sulawesi and Maluku Islands. In addition, the user can also display data mapping of all districts based on Indicator, Plant, Region, and Year categories that can be selected first. (4) The display of data information of each district in table formed by category of Indicator, Plant, and Region which can be selected first. 5) In Figure 4, the About Us page displays information about the Implementing Geographic Information System (GIS) Food Crop1based Digitization in Local
Superior Commodities in Indonesia. 6) On the E1 book page displays information about some of the leading food plants in full, including corn, green beans, peanuts, soybeans, rice, sweet potatoes, and cassava. The information displayed starting from the type of plants, how to grow crops, harvest, until the benefits for humans. (E1book is using execute file as an extension so it can be viewed directly in the website. Another alternative is to create a link so that users can download and access the e1book).
Figure 4. About Us Page
4 CONCLUSION
The development of this application has provided information on harvested area, production and productivity of all crops in Sulawesi and Maluku Island. This application can be accessed via the internet or mobile phone to know the distribution of food crops in Sulawesi and Maluku Islands. Accordingly, people can easily observe where the location of the desired food crop is.
REFERENCES
Budiyanto, E., 2002, Sistem Informasi Geografis Menggunakan Arcview Gis, Penerbit Andi, Yogyakarta.
Hosse and Schilcher, 2002, Temporal Geographic Information System for Analysis and Visualiza1 tions of Cultural Heritage Institute of Geodesy, Geographic Information System and Land Man1 agement, Techno. University of Munich, Germa1 ny.
Mao, J, R. Dutton, W. Chen, and W. Watson, 2008, Parallel Job Scheduling with Overhead: A Benchmark Study, Proceedings of the IEEE In1 ternational Conference on Networks, Architec1 ture, and Storage (NAS), 3261333.
! " #$ !
% & '( )
Teddy Oswari, E. Susy Suhendra, Emy Haryatmi, Fenni Agustina, 2013, Prototype Geographic In1 formation Systems Mapping of Crop Products Featured Local Journal of Geographic Information System. Vol.5, No.3, June 2013. Z. Duran A, A. Garagon Doğru B, G. Toz, 2003,
Web1Based Multimedia Geographic Information System for Historical Sites, International Sympo1 sium CIPA, Turkey.