Attributes, and Performance: The Case of Agribusiness
Cooperatives in Greece
Theo Benos
Department of Marketing & Supply Chain Management, School of Business & Economics Maastricht University, Tongersestraat 53, 6211LM, Maastricht, The Netherlands.
E-mail: [email protected]
Nikos Kalogeras
Marketing-Finance Research Lab, Department of Marketing & Supply Chain Management & Department of Finance, School of Business & Economics, Maastricht University, Tongersestraat 53, 6211 LM, Maastricht, The Netherlands; Dept. of Economics & Management, MAICh-International Centre for Advanced Mediterranean Agronomic Studies (CIHEAM), Paris, France, EU.
E-mail: [email protected]
Frans J.H.M. Verhees
Marketing and Consumer Behavior Group (bode 87), Wageningen University, Postbus 8130, 6700EW, Wageningen, The Netherlands. E-mail: [email protected]
Panagiota Sergaki
Marketing of Agricultural Products, Agricultural Policy and Cooperatives Lab, Department of Agricultural Economics, School of Agriculture, Faculty of Agriculture, Forestry and Natural Environment, Aristotle University of Thessaloniki, 54124 Thessaloniki, Greece.
E-mail: [email protected]
Joost M.E. Pennings
Department of Marketing & Supply Chain Management, Department of Finance, Marketing-Finance Research Lab, School of Business & Economics, Maastricht University, Tongersestraat 53,
6211LM, Maastricht, The Netherlands; Marketing & Consumer Behavior Group, Wageningen University, The Netherlands; and, Office for Futures & Options Research (OFOR), University of Illinois at Urbana-Champaign, IL. E-mail: [email protected]
ABSTRACT
We develop a classification of traditional versus restructured cooperative organizational attributes based on an inductive approach. Using this classification and integrating concepts from the business literature (i.e., market and brand orientation), we hypothesize three types of relationships: (a) the influence of orga-nizational attributes, i.e., ownership, control and cost/benefit allocation, on orgaorga-nizational performance; (b) the influence of strategic, i.e., market and brand orientation, attributes on organizational performance, and (c) the influence of organizational attributes on market orientation. We examine these relationships empirically in two studies. In study 1, using data from 114 agribusiness cooperatives, we demonstrate that strategic attributes have a greater influence on organizational performance than organizational attributes. In study 2, we replicate the design from study 1, i.e., tracking attribute scores over time, with a subsample of 25 cooperatives 4 years later. This second study generally confirms the findings of study 1. Taken together, the results suggest that greater emphasis should be placed on strategic attributes both in the literature and in practice.C 2015 Wiley Periodicals, Inc.
1. INTRODUCTION
The drastic and global changes in agribusiness over the past two decades exposed producer-owned organizations like cooperatives to fierce competition of aggressive players such as whole-salers, investor-owned firms (IOFs) and retailers (Beverland, 2007). Despite creating value for their member-owners, cooperatives often fail to respond to market changes because they Agribusiness, Vol. 32 (1) 127–150 (2016) C 2015 Wiley Periodicals, Inc. Published online in Wiley Online Library (wileyonlinelibrary.com/journal/agr). DOI: 10.1002/agr.21429
lack a well-developed strategic focus (Borgen, 2011; Chaddad & Cook, 2004; Kyriakopou-los, 2000; Peterson & Anderson, 1996). The lack of connection to market demand limits their viability and requires the rearrangement of their organizational and strategic attributes (Kalogeras, Pennings, van der Lans, Garcia, & van Dijk, 2009; van Dijk, 1999). The choices cooperatives make regarding organizational (e.g., ownership, governance) and strategic at-tributes (e.g., market orientation, brand orientation) are thus crucial in dynamic markets or periods of transition in which product adaptations are required (Cechin, Bijman, Pascucci, & Omta, 2013). Not surprisingly, many cooperatives have undergone profound organizational and strategic changes in the last two decades (Hӧhler & K ¨uhl, 2014; Nilsson, Svedsen, & Svedsen, 2012).
The extent to which cooperatives modify their organizational attributes results in organiza-tional forms that range from tradiorganiza-tional, collectively organized, equality-based to restructured models (i.e., proportional or IOF alike) (Kalogeras et al., 2009). These restructured models are purported to facilitate improved adaptation of cooperatives to agricultural industrializa-tion and to market challenges (Chaddad & Cook, 2004; Hendrikse, 2011; Hӧhler & K ¨uhl, 2014).
Besides organizational attributes, the business literature identifies several strategic attributes to align firms with their markets, among which are market and brand orientation (e.g., Berthon, Ewing, & Napoli, 2008; Matsuno, Mentzer, & Ozsomer, 2002; Urde, Baumgarth, & Merrilees, 2013). Market orientation reflects a firm’s propensity to adopt the marketing concept, which is the belief that the best way for firms to achieve their own objectives is to satisfy customers more effectively and efficiently than competitors do (Jaworski & Kohli, 1993; Kumar, Jones, Venkatesan, & Leone, 2011). Consequently, market orientation emphasizes responsiveness to changes in customer needs and competition and thus encourages continuous changes in the firm’s offer (Morgan, Vorhies, & Mason, 2009). Brand orientation refers to a firm’s processes revolving around the creation, development, and protection of brand identity (Urde, 1994). Brand identities are created in customers’ minds over a long period of time and thus brand orientation emphasizes stability (Wong & Merrilees, 2005).
This article explores the influence of restructured organizational attributes on the market orientation and performance of cooperatives, as well as the influence of the strategic attributes (market and brand orientation) on performance. The need to gain a better understanding of the influence of organizational attributes on strategic attributes and the performance of coop-eratives has been recognized (Kalogeras, Pennings, Benos, & Doumpos, 2013; Kyriakopoulos, Meulenberg, & Nilsson, 2004; Mauget & Declerck, 1996), yet limited research has been devoted to the examination of these relationships. Researchers have utilized a rich spectrum of theories, such as agency theory (Cook, 1995) and property rights theory (Fulton, 1995), in their attempts to explain the problems inherent in agricultural cooperatives (e.g., horizon, portfolio,1 see Vitaliano, 1983). Moreover, many studies have focused on cooperative performance primarily through financial analysis, such as balance sheet ratio assessments (e.g., Gentzoglanis, 1997; Parliament, Lerman, & Fulton, 1990) or have maintained an analytical focus (e.g., Meulenberg, 2000; Nilsson, 1998; Peterson & Anderson, 1996). Nevertheless, few, if any, account for the be-havioral aspects of cooperative entrepreneurship and the broader implications of restructuring cooperatives’ core attributes (Kalogeras et al., 2009; Salavou & Sergaki, 2013). Scholars need to study the interplay of organizational attributes, strategic attributes, and performance in order to offer a more holistic understanding of cooperative viability and provide guidance on how cooperative organizations may navigate through turbulent times. To the best of our knowledge, only the study of Kyriakopoulos et al. (2004) shed light on the influence of structural at-tributes on cooperative outcomes. The authors introduced and empirically tested a conceptual
framework regarding the influence of organizational attributes and entrepreneurial culture on the market orientation and performance of agribusiness cooperatives in the Netherlands.
We examine the attribute—performance relationships empirically with two studies from Greece: one conducted in 2006 (study 1) and a smaller scale replication conducted in 2010 (study 2). Due to the introduction and enforcement of a new law (Law 2810/2000) several legal barriers were lifted and the restructuring of cooperative attributes was permitted in Greece. In fact, the flexibility of the new law challenged cooperatives to abandon their traditional orga-nizational form and passive market role (Iliopoulos, 2001). Our decision context thus presents a unique opportunity to follow an inductive approach (McKelvey, 1982), using empirically groundedobservations for the classification into “traditional” versus “restructured” attribute elements (see Table 2), and empirically testing this classification against strategic attributes and performance. We used the policy reform as the turning point, as such changes in the legal and institutional environment typically affect cooperatives’ structure and market behavior (Chaddad & Cook, 2004; Iliopoulos & Theodorakopoulou, 2014; Oustapassidis, Sergaki, Vlachvei, & Baourakis, 1995). In general, studies into the influence of legal changes— organizational, regulatory or tax laws—on organizational innovations and business strategies are called for (Cook, 1995; Hansmann, 1996).
The remainder of the article is organized as follows. We first describe the development of a classification of organizational attribute elements ranging between “traditional” and “re-structured,” followed by an elaboration on strategic attributes. Subsequently, hypotheses are formulated that show the influence of organizational attributes and strategic attributes on performance. After explaining the survey design and operationalization of the measures, the empirical findings are presented, for study 1 and study 2. Finally, conclusions, implications, and suggestions for future research are offered.
2. BACKGROUND: COOPERATIVE ATTRIBUTES AND PERFORMANCE 2.1. Organizational Attributes
A cooperative can be defined as a “user-owned and controlled business from which benefits are derived and distributed on the basis of use” (Dunn, 1988, p. 85). This definition is broadly accepted in the international community of agricultural economists (van Dijk, 1999) and by the European Commission (cf. Bijman et al., 2012). The cooperative structure may be organized along the following three principles: user-ownership, user-control, and user-benefit, ranging from “traditional” to “restructured” (van Bekkum, 2001). The traditional organizational model of agribusiness cooperatives entails exclusive members’ ownership, democratic control, and a uniform pricing policy (Barton, 1989). In contrast, the restructured cooperative model is composed of individualized equity, nonmember funding, proportional decision control, and the allocation of benefits through price differentiation and personal shares (see Chaddad & Cook, 2004).
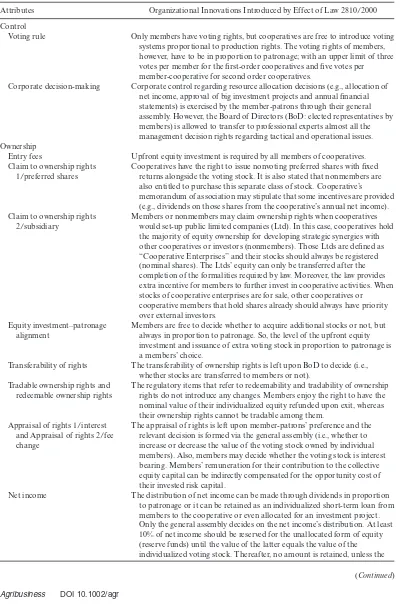
TABLE 1. Organizational Attributes of Cooperatives in Greece
Attributes Organizational Innovations Introduced by Effect of Law 2810/2000
Control
Voting rule Only members have voting rights, but cooperatives are free to introduce voting
systems proportional to production rights. The voting rights of members, however, have to be in proportion to patronage; with an upper limit of three votes per member for the first-order cooperatives and five votes per member-cooperative for second order cooperatives.
Corporate decision-making Corporate control regarding resource allocation decisions (e.g., allocation of net income, approval of big investment projects and annual financial statements) is exercised by the member-patrons through their general assembly. However, the Board of Directors (BoD: elected representatives by members) is allowed to transfer to professional experts almost all the management decision rights regarding tactical and operational issues. Ownership
Entry fees Upfront equity investment is required by all members of cooperatives.
Claim to ownership rights 1/preferred shares
Cooperatives have the right to issue nonvoting preferred shares with fixed returns alongside the voting stock. It is also stated that nonmembers are also entitled to purchase this separate class of stock. Cooperative’s memorandum of association may stipulate that some incentives are provided (e.g., dividends on those shares from the cooperative’s annual net income). Claim to ownership rights
2/subsidiary
Members or nonmembers may claim ownership rights when cooperatives would set-up public limited companies (Ltd). In this case, cooperatives hold the majority of equity ownership for developing strategic synergies with other cooperatives or investors (nonmembers). Those Ltds are defined as “Cooperative Enterprises” and their stocks should always be registered (nominal shares). The Ltds’ equity can only be transferred after the completion of the formalities required by law. Moreover, the law provides extra incentive for members to further invest in cooperative activities. When stocks of cooperative enterprises are for sale, other cooperatives or cooperative members that hold shares already should always have priority over external investors.
Equity investment–patronage alignment
Members are free to decide whether to acquire additional stocks or not, but always in proportion to patronage. So, the level of the upfront equity investment and issuance of extra voting stock in proportion to patronage is a members’ choice.
Transferability of rights The transferability of ownership rights is left upon BoD to decide (i.e., whether stocks are transferred to members or not).
Tradable ownership rights and redeemable ownership rights
The regulatory items that refer to redeemability and tradability of ownership rights do not introduce any changes. Members enjoy the right to have the nominal value of their individualized equity refunded upon exit, whereas their ownership rights cannot be tradable among them.
Appraisal of rights 1/interest and Appraisal of rights 2/fee change
The appraisal of rights is left upon member-patrons’ preference and the relevant decision is formed via the general assembly (i.e., whether to increase or decrease the value of the voting stock owned by individual members). Also, members may decide whether the voting stock is interest bearing. Members’ remuneration for their contribution to the collective equity capital can be indirectly compensated for the opportunity cost of their invested risk capital.
Net income The distribution of net income can be made through dividends in proportion
to patronage or it can be retained as an individualized short-term loan from members to the cooperative or even allocated for an investment project. Only the general assembly decides on the net income’s distribution. At least 10% of net income should be reserved for the unallocated form of equity (reserve funds) until the value of the latter equals the value of the individualized voting stock. Thereafter, no amount is retained, unless the
TABLE 1. Continued
Attributes Organizational Innovations Introduced by Effect of Law 2810/2000
value or the amount of individualized voting stock is increased. In this situation the unallocated equity has to be re-adjusted and the retained earnings mechanism has to be reintroduced. Hence, net income allocation cannot be applied as a price supplement and can only be returned as a dividend in proportion to patronage.
Exit barriers The new act states that the memorandum of cooperative association may set a
minimum period of time that a member has the right/obligation to patronize the cooperative.
Cost/benefit allocation Delivery agreement nature and
sanctions
The intra-organizational supply management is determined also through the regulations which specify the delivery rights agreement. The latter may be obligatory whereas cooperatives are free to take a stance on the imposition of sanctions against members not fulfilling their delivery obligations. Differential pricing & differential
cost pricing
Cooperatives are free to adopt a differentiated pricing policy in terms of volume, quality, and produce content to reflect as much as possible the handling costs and market returns of each member’s produce. The price level may be cross-subsidized with returns on transaction-based investment (e.g., account for product quantity and certain quality standards) or reflect the market equilibrium price paid through separate dividends (i.e., returns on capital invested).
2.2. Strategic Attributes
Strategic attributes refer to fundamental choices of cooperatives regarding their marketing approach (Meulenberg, 2000; van Dijk, 1999). To be successful, a firm’s offer (i.e. positioning and marketing mix) should be aligned with the needs of the markets served (i.e., market segmentation and targeting) (Kotler & Keller, 2012). Two prominent strategic attributes that describe a firm’s marketing approach are market- and brand orientation (Urde et al., 2013).
Market orientationis a central concept in the marketing literature (Gebhardt, Carpenter, & Sherry, 2006; Ozkaya, Droge, Hult, Calantone, & Ozkaya, 2015), representing the implemen-tation of the marketing concept, an important cornerstone of the marketing discipline (Grewal & Tansuhaj, 2001). Academics first began connecting the marketing concept with market ori-entation in the 1990s (see Kohli & Jaworski, 1990; Narver & Slater, 1990) and developed a substantive body of research ever since (Kumar et al., 2011). This research illustrated that market orientation leads to improvements in customer value (Slater & Narver, 2000), customer satisfaction (O’Cass & Ngo, 2011), employee commitment (Matsuno et al., 2002), financial performance (Kirca, Jayachandran, & Bearden, 2005), even business performance under high competitive intensity (Kumar et al., 2011). It comes as no surprise that market orientation has received scrutiny from marketing scholars and has become increasingly relevant to scholars in other fields such as management (e.g., Morgan et al., 2009).
(Day, 1998; Grewal & Tansuhaj, 2001). Hence, a robust market orientation enables a firm to anticipate market threats and opportunities, and thereby enhances its ability to adopt and implement a winning strategy ahead of competition over time (Day, 1998; Kumar et al., 2011; Ozkaya et al., 2015). Consequently, market dynamics, such as changes in customer needs and competitive behavior, guide a firm’s marketing strategies and tactics.
Brand orientationis a younger paradigm than market orientation (Louro & Cunha, 2001). It refers to the creation, development, and protection of brand identity for the achievement of positional advantage in the market in an ongoing interaction with target customers (Urde, 1994). Customers use brands as a guide for their buying decisions, especially in environments of increasing information flows and product assortments, e.g., the agri-food industry (Hanf & K ¨uhl, 2005). Thus, brand orientation increases both customer loyalty and entry barriers for competitors (Kotler & Keller, 2012). Adopting brand orientation is a strategic choice (Urde, 1999). The management of brand identity should take a long-term perspective because consumers’ knowledge about brands changes slowly. As a result, brand identities also guide marketing strategies and tactics over time (Davis, 2002; Urde, 1999; Urde et al., 2013).
2.3. Performance
The performance of agribusiness cooperatives as organizations can be viewed as a volatile factor resulting from the rapidly changing agri-food environment. Evaluating whether a cooperative achieves its objectives is far more complex than using simple market-based performance mea-sures as in the case of IOFs (Cook, 1994; Soboh, Lansink, Giesen, & van Dijk, 2009). Sexton and Iskow (1988) and Katz (1997) contend that, due to the absence of secondary markets for cooperative-issued stocks, and this is a relevant element for our decision context, simple market-based measures (e.g., financial ratio analysis) may mask crucial insights when studying cooperative performance. In addition, objective measures of performance are often difficult to obtain (Dess & Robinson, 1984), let alone for individual cooperative members (Kalogeras et al., 2009). These arguments prompted us to view cooperative performance as a subjective concept comprised of market and financial indicators proposed by previous studies in business litera-ture, such as sales volume, market share, and new market entry (Cadogan, Diamantopoulos, & Siguaw, 2002; Deshpande, Farley, & Webster, 1993). Moreover, considering that cooperatives have a dual performance mission of meeting organizational goals and satisfying member objec-tives at the same time (Soboh et al., 2009), we also integrated elements of member perceptions on cooperative organizational performance. That is, members expect their cooperative to grow, become highly competitive, and hence increase its organizational performance. The latter can be achieved when a cooperative increases its market shares, advances its processing capacities and technologies, and raises the price paid to its members. Thus, members may perceive their cooperative as of high-quality when they believe that the latter’s performance enhances their own economic interests (Fulton & Giannakas, 2001). In sum, in view of the ongoing debate on cooperative performance (Chaddad & Iliopoulos, 2013; Kalogeras et al., 2013; Soboh et al., 2009), we use subjective measures based on past business literature, while in partly integrating members’ perspective, we assess their perceptions on organizational performance indirectly (see more on paragraph 4.2).
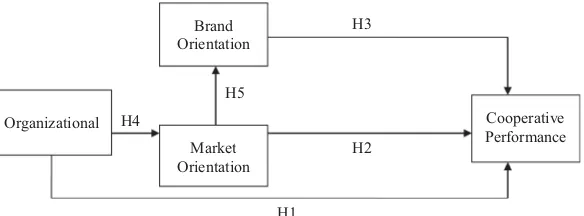
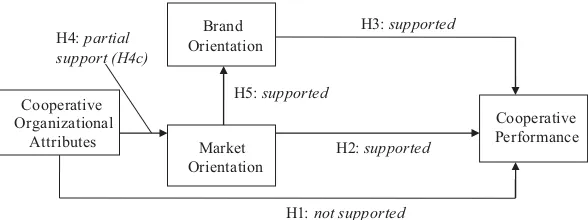
3. CONCEPTUAL MODEL
Organizational
Market Orientation
Brand Orientation
Cooperative Performance H3
H2
H1 H5
H4
Figure 1 Relationships Between Organizational Attributes, Strategic Attributes, and Performance.
discuss each specific hypothesis.
3.1. Organizational Attributes—Performance
Control arrangements pertain to decision control rights and decision management (Chaddad & Iliopoulos, 2013). Restructured decision rights like proportional voting may motivate members, especially large-sized producers, whose capital and patronage is instrumental in business success, to invest further in cooperative activities (Kyriakopoulos et al., 2004). In other words, large-sized members (in terms of produce marketed and firm size) often own the resources to invest in cooperative activities and projects that require a significant capital contribution and/or have a long-term pay-off. Their membership is, therefore, essential to the continued cooperative success (Reynolds, 1997). However, cooperative practice has shown that they often feel their economic interests not being represented by the traditional “one-member one-vote” rule (Royer, 1995). Moreover, cooperative members of any size often lack market expertise and management capabilities to exercise decision management (Bijman, Hendrikse, & van Oijen, 2013). As cooperatives expand and diversify, the need to employ professionals for making strategic, tactical and operational decisions increases (Cook, 1994; Iliopoulos, 2001; Hueth & Marcoul, 2009). Increasing the responsibilities assigned to professional management makes cooperatives more viable and efficient, allowing them to serve their members’ needs better (Adrian & Green, 2001). Therefore, we hypothesize that:
H1a: Restructured control arrangements in cooperatives positively influence cooperatives’ performance.
Restructured cooperatives relax the traditional ownership arrangements with the aim of re-inforcing the investment incentives for their members. The increased willingness of members to invest in cooperative activities is then expected to influence performance positively (Cook & Il-iopoulos, 1999). That is, the establishment of internal capital markets provides opportunities for investing further risk capital in cooperative operations (Hendrikse, 2011). These investment in-centives are further enhanced by the introduction of member-commitment arrangements, such as exit barriers (van Dijk, 1999), which provide a longer investment orientation for all members, thus facilitating long-term cooperative plans that in turn influence long-term performance. Of course, exit barriers should be introduced with care, as they might discourage new members from joining, especially in newly established cooperatives.3 Research has demonstrated that restructured ownership features enhance cooperatives’ performance (Cook & Iliopoulos, 1999; van Bekkum, 2001). More formally:
H1b: Restructured ownership arrangements in cooperatives positively influence coopera-tives’ performance.
Cooperatives are continuously challenged to respond in a timely manner to markets with a constant supply of products bearing specific quality standards (Hendrikse, 2011). The control of supply has been discussed in cooperative literature as a significant determinant of opera-tional success (Cook & Iliopoulos, 2000). Besides, the foodstuffs produced by cooperatives are, typically, subject to value decay over time and require a well-synchronized value chain (Hanf & K ¨uhl, 2005). Enforceable delivery agreements and differential pricing schemes can thus be important means of achieving the goals of constant supply and synchronization (Jia & Huang, 2011). In several traditional cooperatives, members may act opportunistically and shirk on quality and deliveries because they are not held liable for such behavior (Borgen, 2011; Harris, Stefanson, & Fulton, 1996). Cooperatives may better satisfy the needs of different groups of members by adopting a differentiated pricing policy, which reflects as much as possible the han-dling costs and market returns of each member’s produce (Kalogeras et al., 2009). Therefore, we hypothesize:
H1c: Restructured cost/benefit allocation arrangements in cooperatives positively influence cooperatives’ performance.
3.2. Strategic Attributes—Performance
Overwhelming evidence of a positive influence of market orientation on performance has been reported and analyzed in the business and marketing literature (Ben Brik, Rettab, & Mellahi, 2011; Morgan et al., 2009; Ozkaya et al., 2015). Market orientation provides the firm with market-sensing and customer-linking capabilities (Grewal & Tansuhaj, 2001). Understanding and anticipating customer needs subsequently increases firm innovativeness, new product suc-cess, customer-perceived product quality, customer satisfaction, customer loyalty and ultimately performance (e.g., Kirca et al., 2005). The relationship between market orientation and perfor-mance seems particularly strong for manufacturing firms, like most agribusiness cooperatives (Kyriakopoulos, 2000; Meulenberg, 2000; van Dijk, 1999). Moreover, the relationship seems to hold for medium-sized firms (Pelham, 2000), like most cooperatives in Greece (Iliopoulos, 2012; Salavou & Sergaki, 2013). We hypothesize that:
H2: Market orientation positively influences performance in cooperatives.
H3: Brand orientation positively influences performance in cooperatives.
3.3. Organizational Attributes—Market Orientation
The voting principle of restructured cooperatives often appeals to members’ incentives. For instance, members of differing sizes may be motivated to contribute more to the collectively allocated equity, as they realize that their investment strategy is now represented and rewarded proportionately to their patronage and financial contribution (i.e., residual rights) (Chaddad & Iliopoulos, 2013). Members’ willingness to invest further in cooperative activities enhances the cooperative attempts to achieve a timely and well-organized response to the rapidly changing demands of final markets and, therefore, allows for the creation of more market-driven gover-nance structures (Royer, 1995). Moreover, the assignment of decision rights to hired managers is expected to stimulate a market orientation in cooperatives. The decision making in tradi-tionally organized cooperatives is more time consuming than in other organizational forms. It reduces flexibility and creates inertia with respect to the reaction to changing market circum-stances (Nilsson, 2001). Professional managers are expected to be aware of the importance of being market oriented and retain more resources for the cooperative (Russo, Weatherspoon, Peterson, & Sabbatini, 2000). Sufficient resources and an awareness of their importance seem to suffice in rendering the cooperative more market oriented (Meulenberg, 2000). Furthermore, restructured cooperatives are expected to be more flexible and if they wish to be market ori-ented, they have to allow their management more entrepreneurial freedom (van Dijk, 1999). Flexibility stimulates market orientation (Grewal & Tansuhaj, 2001; Jaworski & Kohli, 1993). More formally:
H4a: Restructured control arrangements in cooperatives positively influence the market ori-entation of cooperatives.
Producers have to be willing to fund the cooperative’s market orientation (e.g., market re-search), as well as its market-oriented responsiveness (e.g., branding, new product development, and product differentiation) to achieve distribution on grocery store shelves and generate rev-enues in the long run (Borgen, 2011; Narver & Slater, 1990). The nature of the ownership structure of a cooperative significantly affects members’ incentives to invest in the organiza-tion (Cook & Iliopoulos, 2000). In fact, the introducorganiza-tion of restructured ownership principles, such as entry fees and exit barriers, reduces apathy among members toward making long-term investments and eventually reinforces their commitment (Hardesty, 2005; Nilsson, 2001). More-over, restructured cooperatives allow for nonmember investments, particularly in projects that maintain a long-term focus, for instance through preferred stock offerings and subsidiaries. This additional capital increases cooperatives’ potential to gather market intelligence, respond timely to market needs and therefore implement ambitious marketing plans. We hypothesize that:
H4b: Restructured ownership principles in cooperatives positively influence the market ori-entation of cooperatives.
2006), without sacrificing quality. These arrangements enhance the loyalty and operational efficiency of members and, thus, guarantee resources and enforcement mechanisms that enable a cooperative to engage in value-added activities (e.g., market-oriented activities) and develop products with a good reputation. Therefore, we hypothesize that:
H4c: Restructured cost/benefit allocation processes in cooperatives positively influence the market orientation of cooperatives.
3.4. Market Orientation—Brand Orientation
A market orientation is a prerequisite for brand orientation (Reid et al., 2005; Wong & Merrilees, 2007). First, strong brands are favorable (Kotler & Keller, 2012), which requires knowledge about what customers want (i.e. a market orientation). Second, strong brands are unique (Kotler & Keller, 2012), which requires knowledge about what competitors offer (i.e., a market orientation). Third, brands are created in customers’ minds (Kotler & Keller, 2012) and thus information about customers’ perceptions is required (i.e., a market orientation). Finally, insights in customers’ buying behavior (i.e., a market orientation) is instrumental for firms to realize the power of brands (O’Cass & Ngo, 2011), which initializes the development of a brand orientation. Therefore, we hypothesize that:
H5: Market orientation positively influences brand orientation in cooperatives.
3.5. Decision Context
Cooperative business firms are abundant in the Greek agri-food industry. They have amongst the largest memberships in Europe, accounting for almost 750.000 member-producers (Iliopoulos, 2012). They are involved in activities, such as farm input supplies, product processing, market-ing of agricultural produce and exports (Baourakis, Doumpos, Kalogeras, & Zopounidis, 2002; Iliopoulos, 2012). They play a crucial role in uplifting the socioeconomic conditions of their members as well as local communities, as they act as important development drivers, especially in less wealthy areas (Salavou & Sergaki, 2013). Their organizational pyramid consists of three levels. Those that integrate farmers from the same geographical area are defined as first-order cooperatives. They are responsible for marketing their farmers’ production, although other services, such as supplies and technical support, are also offered. Their local orientation, how-ever, limits the volume and product range they are able to offer to their clients. Second-order cooperatives, unions of agricultural cooperatives (henceforth UACs), were therefore established to commercialize all, or portions of the production of the vast majority of first-order coopera-tives.4At the peak of the pyramid is the Panhellenic Confederation of Agricultural Cooperatives (PA.SE.GES), an umbrella organization whose objective is to support and promote the activ-ities of all agribusiness cooperatives as well as represent them on a national and international level.
Our decision context (i.e., cooperatives in Greece) serves a dual goal. It facilitates both our inductive approach and the empirical testing of the hypothesized relationships. Mid-1990s, the majority of agribusiness cooperatives in Greece were traditionally organized and had weak marketing approaches (Oustapassidis et al., 1995; Sergaki, 2010). In 2000, however, the Greek law on agribusiness cooperatives (Law of Greece, number 2810/2000) was introduced permitting
the organizational restructuring of cooperatives to enhance their market position. It thus offered cooperatives a unique opportunity to overcome their structural inefficiencies, as well as to enhance their strategic focus and competitiveness. The institutional change provide us the opportunity to adopt an inductive approach, using empirical observations based on the articles of the law, relevant literature dealing with agribusiness cooperatives (in Greece) and discussions with cooperative experts and policy makers, both in Greece and abroad, as inputs for the classification explained above and presented in Table 2 below.
Our informed theoretical considerations were then empirically tested against a representative sample of cooperatives from Greece. The hypotheses are first tested in study 1. Study 2 replicates study 1 four years later, with a subset of the original sample, providing us the opportunity to monitor the restructuring progress over time and indirectly control for any lag effects, as changes in cooperative structure resulting from institutional reforms often take time to materialize (Kalogeras et al., 2013). This longitudinal research design also lends greater external validity to the findings.
4. METHODOLOGY AND RESULTS: STUDY 1 4.1. Research Design
The sample was drawn from the official list of cooperatives in Greece as compiled by PA.SE.GES. We first selected all UACs. We then included first-order cooperatives that commer-cialize all or part of their production themselves instead of solely through UACs.5This yielded a total of 155 cooperative associations: 45 first-order cooperatives and 110 UACs, virtually accounting for all agribusiness cooperatives in Greece. Following the key-informant method, we considered that the general managers (CEOs) of these cooperatives were likely to be the most knowledgeable about restructuring as well as strategic issues. A formal, structured ques-tionnaire was developed and mailed to them, after a pre-test with six cooperatives, five UACs, and one first-order cooperative, in which no issues were raised. The response rate to our mail survey was 82%, including 89 UACs and 37 first-order cooperatives. Only respondents without missing values were included in the analyses and, as a result, 12 were excluded. In total 114 responses (from 80 UACs and 34 first-order cooperatives) were used for the following analyses.
4.2. Measures and Measurement Assessment Procedures
Cooperative attributeswere measured with direct questions to determine whether the control, ownership as well as cost/benefit allocation elements are traditional or restructured. For re-structured attribute elements, these questions were answered affirmatively—with a yes (coded as 1)—and for traditional these questions were answered negatively—with a no (coded as 0). Thecontrol attributewas measured using two questions: one about voting rights, henceforth termed “voting rule,” and one about decision-making responsibility (explained below). The votingelement can either be the traditional “one member one vote” (0) or restructured “pro-portional voting based on patronage” (1). Theownership attributewas measured using seven questions about the alignment of equity with patronage, termed “equity-patronage alignment,” and transferability of ownership rights, termed “transferable ownership rights”; two questions on the appraisal of ownership rights, termed “appraisal 1/interest” and “appraisal 2/change in fee”; one for exit barriers, termed “exit barriers”; and two questions on outside capital, termed “claim 1/preferred shares” and “claim 2/subsidiary.” For restructured elements, these questions were answered with a yes (1) and for traditional these questions were answered with a no (0). Finally,cost/benefit allocation was measured by asking four questions: two about
the prices paid to members, termed “differentiated pricing” and “differentiated cost pricing”; and two about the obligatory delivery agreements, termed “nature of delivery agreement” and “sanctions.” The obligatory delivery agreements were determined by asking whether mem-bers are obliged to deliver their entire production to the cooperative, based on contractual arrangements, and by asking whether members face sanctions in the case of nondelivery of the quantities set by the agreement. The answers to these two questions were highly associated (Chi-squaredX2 =47.979,p<0.001; Cramer’s6=0.622,p <0.001). If cooperatives had adopted either of the two arrangements, the newly formed variable termed “nature of delivery agreement/sanctions” was assigned a value of 1 (restructured), whereas if cooperatives had adopted neither of the two, this variable was assigned a value of 0 (traditional) (Kyriakopoulos et al., 2004).
Strategic attributeswere measured with multiple-item scales from prior studies.7All responses were made on a 7-point Likert-type scale ranging from 1=strongly disagree to 7=strongly agree. In assessing the validity of the constructs, we first conducted an exploratory factor analysis (EFA) that assessed the underlying factor structure of the scale items. The results revealed 5 factors with eigenvalues greater than 1.0, which accounted for 62% of the total variance. Further, the results of Harman’s one-factor method revealed that the first factor did not account for the majority of the variance (only 25%) and there was no general factor in the unrotated factor structure. These results suggested that common method bias was not a likely threat (Podsakoff & Organ, 1986).
We then ran principal axis factoring (PAF)8for each construct separately, making use of the multiple criteria method to decide upon the underlying factor structure (Conway & Huffcutt, 2003; Hair, Anderson, Tathem, & Black, 1998). A priori determination, the total variance explained, the scree plot, the Kaiser criterion, formal testing as well as the more elaborate procedures of parallel analysis and Velicer’s minimum average partial (MAP) test were used (O’Connor, 2000). Following the validity checks, we ran reliability tests, for which we used Cronbach’s alpha.
Market orientation, pertaining to the cultural perspective on market orientation, was mea-sured using seven items. We used the cultural perspective rather than the behavioral perspective on market orientation because it provides a better explanation for the variations in business per-formance than the behavioral perspective (Gebhardt et al., 2006; Oczkowski & Farrell, 1998). The cultural perspective on market orientation has been conceptualized as a one-dimensional construct (Narver & Slater, 1990). Multiple criteria (i.e., MAP, scree plot, parallel analysis, a priori determination) suggested that a one-factor solution was appropriate. All the items had a loading higher than 0.602. The construct was sufficiently reliable; the Cronbach’s alpha was equal to 0.795. The mean score of the seven items was used for further analysis. An example item is “Our business objectives are driven primarily by customer satisfaction.”
Brand orientation was measured using five items adopted from Matear, Gray, and Garrett (2004). An additional item was added to measure the extent to which cooperatives invest in new brands according to member perceptions. Matear et al. (2004) suggest that the perceptions of all actors involved, e.g., investors, managers and employees, should be in harmony to serve as a basis for a truly brand-oriented company. All the criteria suggested that a one-factor solution was appropriate. All the items had a loading higher than 0.78 and Cronbach’s alpha was 0.89. The mean score of the items was used for further analysis. The brand-orientation scale was also checked for consistency with the existing percentage of branded products marketed by coop-eratives. The correlation between the percentage of branded products and brand orientation
6Cramer’sis a statistic measuring the strength of association or dependency between two (nominal) categorical variables in a contingency table (Field 2009).
7The survey measures as used in the final questionnaire are available from the authors upon request.
was good (Pearson’sr=0.416,p<0.001). An example item is “In our cooperative, we invest significantly in managing and promoting our brand(s).”
Performancewas assessed using a three-item scale developed by Cadogan et al. (2002) mea-suring the respondents’ level of satisfaction with respect to three performance indicators in the last three years: sales volume, new market entry, and market share. The items of the scale were modified slightly for the purpose of this study because the original ones related to export activities. We generated four additional items: organizational performance as perceived by man-agement, organizational performance as perceived by members in terms of growth and in terms of turnover, and performance in relation to profitability. Multiple criteria, i.e., total variance explained, formal testing, MAP, and a priori determination, suggested a one-factor solution. One reverse-coded item had a rather low loading of 0.182 and was consequently excluded from further analyses. Cronbach’s alpha for the remaining six items equaled 0.831. The mean score of the six items was used for further analyses.
Finally, fordecision-making responsibility, i.e., the construct measuring part of the control attribute, the scale of Adrian and Green (2001) was used, albeit adapted to the context of this study. The managers were provided with 11 activities and asked to determine whether the responsibility for these activities lies with the BOD or the manager. An example item is “Managing the day-to-day operations of the cooperative.” Each activity was scored on a 5-point scale ranging from 1 (“board most responsible”) to 5 (“manager most responsible”). Multiple criteria, including the scree plot, a priori determination, MAP and formal testing, suggested that a one-factor solution was suitable. All the items had a loading higher than 0.563, with a mean factor loading of 0.76, while this factor accounted for 58% of the variance. Cronbach’s alpha equaled 0.93. The mean score of the 11 activities was used for further analyses.
4.3. Model Estimation and Results
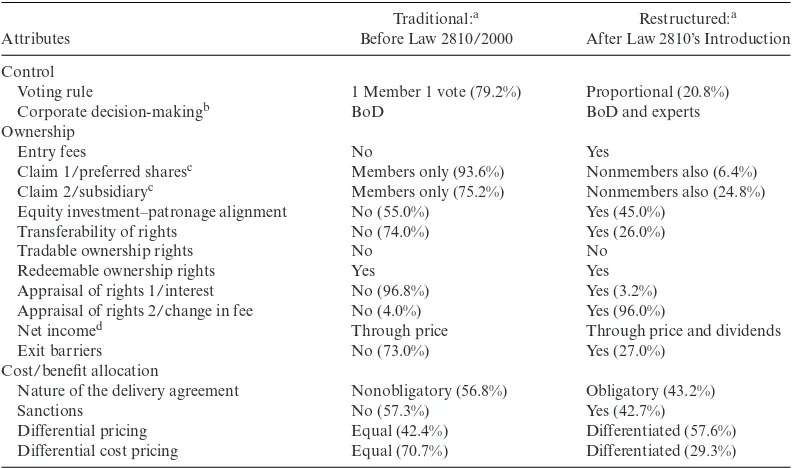
In Table 2, the percentages relating to the adoption of organizational innovations appear next to each attribute element. Clearly, at the time of study 1, agribusiness cooperatives in Greece had only partially adopted organizational innovations. The majority of them had retained a traditional voting system (80.0%) and had a members-only policy for claiming rights on preferred shares (93.6%) and making downstream investments in subsidiaries (75.2%). Also, most cooperatives did not allow the transferability of rights (74.0%) or the appraisal of rights based on interest remuneration (96.8%). A total of 73% of cooperatives had not yet created exit barriers, and 70.7% had not implemented a differential cost-pricing policy. Slightly more than half of the cooperatives imposed obligatory delivery agreements (56.8%) and sanctions (57.3%) and applied equity investment alignments (55.0%). In fact, only a few among the plethora of organizational innovations had been widely adopted by marketing cooperatives. For example, 60% of them used a differential pricing policy.
Tables 3a and b show the results for the hypothesized relationships developed in the previous section. The results were obtained by ordinary least squares regression.F-tests were used to test specific hypotheses regarding groupings of explanatory variables, i.e., cooperative attributes (Maddala, 1989). We tested for collinearity among the variables by calculating the variance inflation factor (VIF)9 for each of the regression coefficients. The VIF ranged from a low of 1.097 to a high of 1.673, well below the cut-off of 10. This shows that it is possible to separate the effects of individual variables on performance. In the first column of Table 2, the explanatory variables are presented. The second column in Table 3 indicates the coefficients of the variables hypothesized to explain cooperatives’ performance. Overall, the results showed that the regression model was significant (F =4.87, p<0.001, adjusted R2 =0.35), which indicates that strategic attributes and organizational attributes partly explain performance.
TABLE 2. Classification of Greek Cooperatives’ Organizational Attributes
Traditional:a Restructured:a
Attributes Before Law 2810/2000 After Law 2810’s Introduction
Control
Voting rule 1 Member 1 vote (79.2%) Proportional (20.8%)
Corporate decision-makingb BoD BoD and experts
Ownership
Entry fees No Yes
Claim 1/preferred sharesc Members only (93.6%) Nonmembers also (6.4%)
Claim 2/subsidiaryc Members only (75.2%) Nonmembers also (24.8%)
Equity investment–patronage alignment No (55.0%) Yes (45.0%)
Transferability of rights No (74.0%) Yes (26.0%)
Tradable ownership rights No No
Redeemable ownership rights Yes Yes
Appraisal of rights 1/interest No (96.8%) Yes (3.2%)
Appraisal of rights 2/change in fee No (4.0%) Yes (96.0%)
Net incomed Through price Through price and dividends
Exit barriers No (73.0%) Yes (27.0%)
Cost/benefit allocation
Nature of the delivery agreement Nonobligatory (56.8%) Obligatory (43.2%)
Sanctions No (57.3%) Yes (42.7%)
Differential pricing Equal (42.4%) Differentiated (57.6%)
Differential cost pricing Equal (70.7%) Differentiated (29.3%)
aThe percentages relate to each attribute of the three organizational principles.
bThere is no percentage for this attribute, as corporate decision making was measured on a five-point Likert scale.
cThe attribute “claim to ownership rights” was divided into two attributes: (1) claim through preferred shares and (2) claim through
subsidiaries—as members (and external investors) can claim ownership rights through these two different routes.
dNet income is allocated through price and dividends in all cooperatives (unless the General Assembly decides that net income is
retained for other purposes, e.g., an investment project).
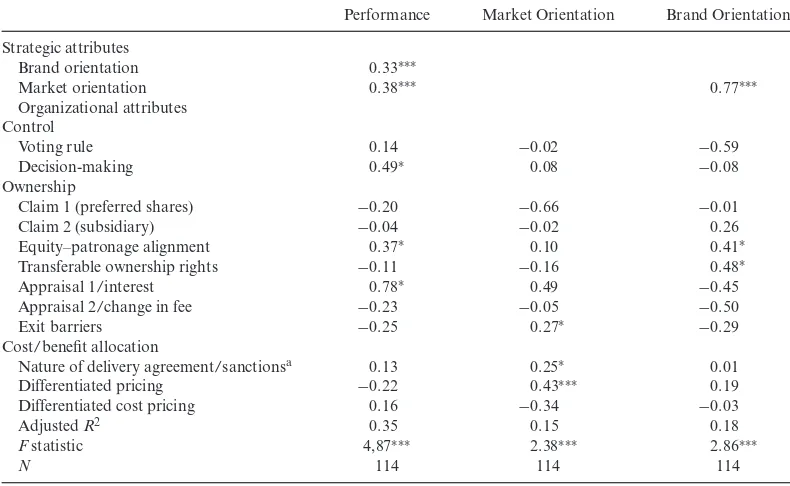
TABLE 3a. F-Tests for Groups of Parameters
Performance Market Orientation Brand Orientation
Organizational attributes
Control 0.82 0.38 1.22
Ownership 0.79 1.34 0.49
Cost/benefit allocation 0.48 2.99∗∗∗ 0.47
∗p<0.1,∗∗p<0.05,∗∗∗p<0.01.
TABLE 3b. Regression Parameter Estimates
Performance Market Orientation Brand Orientation
Strategic attributes
Brand orientation 0.33∗∗∗
Market orientation 0.38∗∗∗ 0.77∗∗∗
Organizational attributes Control
Voting rule 0.14 −0.02 −0.59
Decision-making 0.49∗ 0.08 −0.08
Ownership
Claim 1 (preferred shares) −0.20 −0.66 −0.01
Claim 2 (subsidiary) −0.04 −0.02 0.26
Equity–patronage alignment 0.37∗ 0.10 0.41∗
Transferable ownership rights −0.11 −0.16 0.48∗
Appraisal 1/interest 0.78∗ 0.49 −0.45
Appraisal 2/change in fee −0.23 −0.05 −0.50
Exit barriers −0.25 0.27∗ −0.29
Cost/benefit allocation
Nature of delivery agreement/sanctionsa 0.13 0.25∗ 0.01
Differentiated pricing −0.22 0.43∗∗∗ 0.19
Differentiated cost pricing 0.16 −0.34 −0.03
AdjustedR2 0.35 0.15 0.18
Fstatistic 4,87∗∗∗ 2.38∗∗∗ 2.86∗∗∗
N 114 114 114
∗p<0.1,∗∗p<0.05,∗∗∗p<0.01 (one-sided tests).
aAs mentioned in the section “Measures and Measurement Assessment Procedures,” the two attributes “nature of delivery agreement”
and “sanctions” were combined into a new variable.
the performance of agribusiness cooperatives. Also, in support of H5, market orientation positively influences brand orientation (β =0.77,p<0.001).
The third column in Table 3b presents the results regarding the determinants of market orientation. We tested again for collinearity among the variables by calculating the VIF for each of the regression coefficients. The VIF ranged from a low of 1.081 to a high of 1.483, well below the cut-off of 10. This shows that it is possible to separate the effect of individual variables on market orientation. The results show that the model is significant (F=2.55,p<
0.01), with anadjusted R2 equal to 0.15. This indicates that organizational attributes partly explain market orientation. Thus, restructured organizational attributes influence performance by influencing the cooperative’s market orientation. However, the findings indicate no support for H4a (restructured control attributes positively influence market orientation; F = 0.38, p=0.88), nor for H4b (restructured ownership positively influences market orientation;F= 1.34,p =0.21). Only the ownership element regarding exit barriers10 (β =0.27, p =0.095) has a marginally significant and positive influence on market orientation when a one-sided test is performed. H4c (restructured cost/benefit allocations influence the market orientation of cooperatives) receives support (F=2.99,p<0.05). Particularly, obligatory delivery agreements (β =0.25, p=0.085) and differentiated prices paid to members (β =0.43,p<0.01) have a positive influence on market orientation when one-sided significance tests are performed. In
Cooperative Organizational
Attributes Market
Orientation Brand Orientation
Cooperative Performance H3: supported
H2: supported
H4: partial support (H4c)
H1: not supported
H5: supported
Figure 2 Hypothesis Testing Summary for Study 1.
contrast, differential cost pricing has an unexpected marginal negative influence (β = −0.34, p<0.1). Figure 2 summarizes the results of study 1.11
5. METHODOLOGY AND RESULTS: STUDY 2 5.1. Research Design
We selected 35 UACs that had participated in study 1, representing approximately 1/3 of the total active agribusiness cooperatives in Greece today. We once again followed the key-informant method, which again led us to approach the general managers for information. To control for any response pattern bias, only UACs with the same key informants as in study 1 were included. The research instruments (e.g., a formal structured questionnaire) were identical to those of study 1. Questionnaires were mailed to the 35 general managers and 30 were returned, equaling a response rate of 86%. Only respondents without any missing values were included in the analyses, leading to the exclusion of three respondents; two questionnaires were further dismissed, as the respondents differed from those in study 1. Consequently, 25 responses were used for further analyses.
5.2. Analysis and Results
We examined the differences in the adoption of the attribute elements over time (i.e., from study 1 to study 2). We assigned a value of “0” to all the traditional elements, while all the restructured ones received a value of “1”. We subsequently summed all the values to generate an overall “restructuring score,”12 which suggested that the vast majority of cooperatives had enhanced their degree of restructuring over time, as it was higher at the time of study 2. A Mann–Whitney U-test13 revealed a statistically significant difference between the restructuring scores of study 1 and study 2, respectively (z= −2.83,p<0.01). Moreover, the score was higher for 17 out of 25 examined cooperatives, while it decreased in only 2 cooperatives.
The enhanced restructuring was primarily driven by attribute elements relating to nonvoting voluntary capital, member commitment and delegation of decision-making responsibility. As far as nonvoting capital is concerned, at the time of study 2 almost one-third of the cooperatives had opted for this form of capital, whereas at the time of study 1 none in our sample had issued preferred shares. Regarding the attribute elements relating to member commitment, one-third of the cooperatives had introduced a basic form of exit barrier, while only two had done so
11We included the type of cooperative (i.e., first-order or UAC) as a control variable, but no difference was found.
12The detailed scores and related data are available upon request.
TABLE 4. Correlation Matrixaof the Examined Constructs in 2010
X1 X2 X3 X4
X1—Restructuring score 1
X2—Market orientation 0.301+ 1
X3—Brand orientation 0.343∗ 0.339∗ 1
X4—Performance 0.196 0.395∗∗ 0.576∗∗ 1
aKendall’s tau b14
∗∗Correlation is significant at the 0.01 level. ∗Correlation is significant at the 0.05 level. +Correlation is significant at the 0.10 level.
at the time of study 1. Moreover, more than one-third had introduced sanctions to dissuade members from defaulting on their delivery agreements and cooperative patronage. As a result, even though at the time of study 1 only two cooperatives had adopted either feature, at the time of study 2 there was a clear move toward the restructured type, reinforcing member loyalty and actively discouraging members from free-riding at the expense of inherently loyal members. Finally, the merits of allocating decision-making responsibility to professionals seems to have been realized as by the time of study 2 only one-fifth of the cooperatives in question were primarily managed by nonprofessionals.
Despite the overall enhanced restructuring, it is also striking that cooperatives re-adopted traditional characteristics. This was particularly demonstrative for attribute elements relating to member investment and pricing. First, in the case of “equity alignment with patronage,” the number of cooperatives that had opted for a return to the traditional type of initial member capital exceeded those that had chosen to link member equity capital to actual physical delivery. Second, quite a few cooperatives had re-adopted equal treatment in terms of cost pricing. In other words, differential charges on the basis of various criteria, e.g., production volume, were discontinued in some cooperatives. This was not really surprising as differential cost pricing even had a negative effect on market orientation in study 1. In sum, it seems that the re-adoption of traditional characteristics was almost exclusively related to elements of internal capital arrangements, i.e., member equity and pricing.
As far as strategic attributes are concerned, no statistically significant differences were ob-served across time. The Mann–WhitneyU-tests suggest that the higher mean scores of market orientation and brand orientation in 2010 were not largely different from those in 2006 (z= −1.253,p=0.210 andz= −0.282,p=0.778, respectively). In other words, the cooperatives did not significantly enhance their strategic attributes over time. Nevertheless, the correlation coefficients presented in Table 4 show that performance is still driven by strategic elements. Both market and brand orientation correlate strongly with performance (τ =0.395,p <0.01 and
τ=0.576,p<0.01, respectively), lending support to our hypotheses H2 and H3. Also, market and brand orientation correlate with each other (τ =0.339,p<0.05) to a good extent, offering support to H5. In contrast, the correlation between the restructuring score and performance does not reach statistical significance (τ =0.196,p=0.204), failing to support H1. However, restructuring correlates with market orientation (τ =0.301,p<0.10), offering support to H4. It should be noted, though, that the sample size did not allow for a separate investigation of sub-hypotheses H1a, H1b, H1c, H4a, H4b, and H4c, respectively.
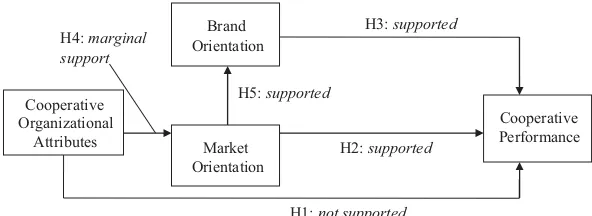
Figure 3 summarizes the results of study 2. It can be concluded that performance is driven by strategic attributes, but not by organizational restructuring. Similar to study 1, organizational attributes exercise some influence on market orientation.
Cooperative Organizational
Attributes Market
Orientation Brand Orientation
Cooperative Performance H3: supported
H2: supported
H4: marginal support
H1: not supported
H5: supported
Figure 3 Hypothesis Testing Summary for Study 2.
6. GENERAL DISCUSSION 6.1. Discussion and Implications
This article is among the first to examine systematically the relationships between the orga-nizational attributes, strategic attributes, and the performance of cooperatives. We developed an empirically grounded classification scheme for providing detailed perspectives on whether and how re-structured cooperative attributes influence market orientation and performance. We further examined the influences of strategic attributes on performance.
The finding, in the two studies conducted here, that organizational restructuring does not seem to influence cooperative performance directly is striking. The picture is somewhat different when the influence of organizational attributes on market orientation is considered. Study 2, for example, shows a positive, albeit marginal, overall effect of restructured organizational attributes on market orientation. Similarly, in study 1, some attribute elements have been shown to exert some influence. Differentiated pricing, delivery agreements and the establishment of exit barriers all have a (marginally) positive influence on the market orientation of cooperatives. As Reynolds (1997), Cook and Iliopoulos (2000), Nilsson (2001), and Kalogeras et al. (2009), among others, have analyzed, ownership and cost/benefit agreements that tie up members’ economic resources in corporate operational (e.g., delivery agreements and exit barriers) and functional activities (e.g., pricing policies) help cooperatives stabilize their supply flows to serve specific market segments.
Our results suggest that any reform of cooperative structures should be geared toward stim-ulating member commitment in the long run in order to serve and target their existing and potential customers effectively and efficiently. Although building market-oriented coopera-tive structures requires capital-intensive strategic plans and tactics that may result in reduced member proceeds in the short run (Borgen, 2011; Hardesty, 2005), these types of investments often reinforce cooperatives’ performance in the long run and provide sustainable competitive advantages (Nilsson, 2001; Salavou & Sergaki, 2013).
changes that, in turn, facilitate these strategic choices. Also, market-oriented decisions (e.g., response to customer demand for more environmental-friendly production) might require changes or extra effort on the part of members and, thus, encounter member skepticism. Nevertheless, as full owners of their farm business and partial owners of the cooperative organization, members do not lack the autonomy to advance their own agenda, with differing degrees of success in achieving their desired outcomes however.
Actually, agribusiness cooperatives in Greece seem to be reluctant to adopt organizational innovations introduced by policy reforms. As study 2 shows, organizational restructuring was enhanced over time, yet quite a few attribute elements still reflect the traditional form. In some cases, elements were even reverted to the traditional type. In general, obligatory member investment instruments such as equity–patronage alignment seem to be disfavored, in sharp contrast to optional capital tools like preferred shares, which are open to external investors and, thus, to outside, nonmember capital. Also, nonmember involvement in decision control (i.e., professional management) seems to gain increasing support, as both studies show. This is not surprising as having a professional management with a high degree of market expertise has been established in the cooperative literature as a critical success factor for performance (Adrian & Green, 2001; Cook, 1994; Hueth & Marcoul, 2009). The delayed adoption of restructured characteristics and the re-adoption of traditional ones raise two fundamental questions: first, whether policy reforms on cooperatives reflect the widely accepted preferences of the market participants. Second, whether and to what extent organizational change drives, or is driven by, legal change.
Overall, the results confirm and extend previous work on the relationships between the orga-nizational attributes, strategic attributes, and the performance of cooperatives (e.g., Chaddad & Cook, 2004; Kalogeras et al., 2009; Kyriakopoulos et al., 2004). Of course, care should be taken not to generalize these results due to our decision context’s specific institutional and market-related characteristics. Yet, our results may have some implications for the continu-ing research on cooperative organizational and strategic attributes. For researchers, this study may stimulate the use of empirical methodologies accounting for qualitative and quantitative observations/inputs in determining and providing detailed perspectives on cooperatives’ re-structuring and strategic behavior under differing institutional and environmental conditions. For policy makers and managers of cooperatives, the findings of the current study might pro-vide some useful guidance. That is to say, aggressive marketing strategies eventually add value to the product–market combinations of cooperatives and, hence, value-focused thinking and market orientation on the part of cooperatives may lead to substantial profits that benefit the members in the long run.
6.2. Limitations and Future Research Suggestions
The current study is subject to the limitations inherent in this type of research. The use of an inductive approach for constructing a classification scheme may redeem the inherent weakness of the limited scope of our second empirical study. Longitudinal research allows for the inves-tigation of causal relationships, yet our overall empirical design cannot be strictly classified as such. Nonetheless, the empirically grounded classification scheme used partly compensates for the inability to establish causality between the various relationships. At this juncture, future research may re-examine the hypotheses put forward in this study by using a more parsimonious longitudinal research design.
self-reported) performance primarily through market indicators such as sales volume, profits and new market entry seems to match our decision context performance idiosyncrasies. Of course, our study has only partly addressed the nature of the cooperative as an organization with a dual performance target, that of satisfying member objectives (e.g., member profitability) next to meeting organizational goals (e.g., sustaining financial growth). We therefore suggest that future empirical studies might benefit from reaching consensus on the issue of performance measurement and develop a uniform measure, comprising both subjective (self-reported) and objective indicators (e.g., financial ratios), but also accounting for the interests/benefits of mem-bers. A uniform and clearly defined performance measure will also allow members, particularly in cooperatives with a large and/or a heterogeneous membership, to monitor management resourcefully and assess whether their interests are taken into account (Chaddad & Iliopoulos, 2013).
In general, as cooperatives are increasingly challenged by divergent member interests, the is-sue of heterogeneity in member preferences and profiles warrants special research and practical attention. The diversity in member preferences regarding cooperative attributes and strate-gic focus may be caused, for instance, by differences in member characteristics (e.g., large vs. small sized members) and thus signal the emergence of a multistring organizational structure (Kalogeras et al., 2009). Such a governance structure may embody a wide range of ownership agreements that satisfy the expectations of member segments regarding cooperative’s as well as their own performance. Cooperatives may also need to implement microgovernance mech-anisms (e.g., relationship management programs) to be in a position to better understand the tangible and latent member preferences (Chaddad & Iliopoulos, 2013).
Finally, we contended that more market- and brand-oriented businesses were best positioned for success under all environmental conditions. However, this study did not aim to investigate whether or not the hypothesized relationships were moderated by other micro- or macro-economic conditions. For example, the instability in the macro-economic environment resulting from the economic crisis, which started between our data-collection points, might have influenced cooperative managers’ and members’ decisions. This might also partly explain why strategic attributes were not reinforced over time, as study 2 showed. Perhaps further strategic enhance-ment might have been inhibited by the adverse general economic climate. Future research may consider the influence, direct or otherwise, of other environmental conditions such as the impact of external competitive forces on the restructuring and strategic behavior of cooperatives.
ACKNOWLEDGMENTS
The authors are grateful to the anonymous reviewers for their very helpful comments. The first author gratefully acknowledges the financial support from the State Scholarships Foundation IKY (Greece).
REFERENCES
Adrian, L.A.J., & Green, T.W. (2001). Agricultural cooperative managers and the business environment. Journal of Agribusiness, 19(1), 17–33.
Baourakis, G., Doumpos, M., Kalogeras, N., & Zopounidis, C. (2002). Multicriteria analysis and assessment of financial viability of agribusinesses: The case of marketing cooperatives and juice producing companies. Agribusi-ness, 18(4), 543–558.
Barton, D. (1989). What is a cooperative? In D.W. Cobia (Ed.), Cooperatives in agriculture (pp. 1–20). Englewood Cliffs, NJ: Prentice Hall.
Ben Brik, A., Rettab, B., & Mellahi, K. (2011). Market orientation, corporate social responsibility, and business performance. Journal of Business Ethics, 99, 307–324.
Berthon, P., Ewing, M.T., & Napoli, J. (2008). Brand management in small to medium-sized enterprises. Journal of Small Business Management, 46(1), 27–45.
Bijman, J., Hendrikse, G.W.J., & vanOijen, A. (2013). Accommodating two worlds in one organisation: Changing board models in agricultural cooperatives. Managerial and Decision Economics, 34, 204–217.
Bijman, J., Iliopoulos, C., Poppe, K.J., Gijselinckx, C., Hagedorn, K., Hanisch, M., . . . vander Sangen, G. (2012). Support for farmers’ cooperatives. Final Report. W a geningen, T he Netherlands: Wageningen UR.
Borgen, S.O. (2011). Product differentiation and cooperative governance.The Journal of Socio-Economics, 40, 327–333. Cadogan, J.W., Diamantopoulos, A., & Siguaw, J.A. (2002). Export market-oriented activities: Their antecedents and
performance consequences. Journal of International Business Studies, 33(3), 615–626.
Cechin, A., Bijman, J., Pascucci, S., & Omta, O. (2013). Decomposing the member relationship in agricultural cooper-atives: Implications for commitment. Agribusiness, 29, 39–61.
Chaddad, F.R., & Cook, M.L. (2004). Understanding new cooperative models: An ownership-control rights typology. Review of Agricultural Economics, 26(3), 348–360.
Chaddad, F.R., & Iliopoulos, C. (2013). Control Rights, governance and the cost of ownership in agricultural cooper-atives. Agribusiness, 29(1), 3–22.
Chaudhuri, A., & Holbrook, M.B. (2001). The chain of effects from brand trust and brand affect to brand performance: The role of brand loyalty. Journal of Marketing, 65(2), 81–93.
Conway, J.M., & Huffcutt, A.I. (2003). A review and evaluation of exploratory factor analysis practices in organizational research. Organizational Research Methods, 6(2), 147–168.
Cook, M.L. (1994). The role of management behaviour in agricultural cooperatives. Journal of Agricultural Coopera-tion, 9, 42–58.
Cook, M.L. (1995). The future of US agricultural cooperatives: A neo-institutional approach. American Journal of Agricultural Economics, 77(5), 1153–1159.
Cook, M.L., & Iliopoulos, C. (1999). Beginning to inform the theory of the cooperative firm: Emergence of the new generation cooperative. Finnish Journal of Business Economics, 4, 525–535.
Cook, M.L., & Iliopoulos, C. (2000). Ill-defined property rights in collective action: The case of US agricultural Cooperatives. In C. Menard (Ed.),Institutions, contracts and organisations: Perspectives from new institutional economics(pp. 335-348). Cheltenham, U.K. and Nort h ampton, MA: Elgar Publishing.
Davis, S. (2002). Brand asset management: How businesses can profit from the power of brand. Journal of Consumer Marketing, 19(4), 351–358.
Day, G.S. (1998). What does it mean to be market-driven? Business Strategy Review, 9(1), 1–14.
Deshpande, R., Farley, J.U., & Webster, F.E. (1993). Corporate culture, customer orientation, and innovativeness in Japanese firms—A quadrat analysis. Journal of Marketing, 57(1), 23–27.
Dess, G.G., & Robinson, R.B. (1984). Effectively measuring organizational performance in the absence of objective measures: The case of the privately-held firm and conglomerate business unit. Strategic Management Journal, 5, 265–273.
Dunn, J.R. (1988). Basic cooperative principles and their relationship to selected practices. Journal of Agricultural Corporation, 3, 83–93.
Fabrigar, L.R., Wegener, D.T., MacCallum, R.C., & Strahan, E.J. (1999). Evaluating the use of exploratory factor analysis in psychological research. Psychological Methods, 4(3), 272–299.
Field, A. (2009). Discovering statistics using SPSS. Thousand Oaks, CA: Sage.
Fulton, M.E. (1995). The future of cooperatives in Canada: A property rights approach. American Journal of Agri-cultural Economics, 77, 1144–1152.
Fulton, M.E., & Giannakas, K. (2001). Organizational commitment in a mixed oligopoly: Agricultural cooperatives and investor-owned firms. American Journal of Agricultural Economics, 83(5), 1258–1265.
Gebhardt, G.F., Carpenter, G.S. & Sherry, J.F., Jr. (2006). Creating a market orientation: A longitudinal, multifirm, grounded analysis of cultural transformation. Journal of Marketing, 70(4), 37–55.
Gentzoglanis, A. (1997). Economic and financial performance of cooperatives and investor-owned firms: An empirical study. In J. Nilsson & G. vanDijk (Eds.), Strategies and structures in the agro-food industries (pp. 171–182). Assen, the Netherlands: van Gorcum.
Grewal, R., & Tansuhaj, P. (2001). Building organizational capabilities for managing economic crisis: The role of market orientation and strategic flexibility. Journal of Marketing, 65(2), 67–80.
Hair, J.F., Anderson, R.E., Tathem, R.L., & Black, W.C. (1998). Multivariate data analysis. Englewood Cliffs, NJ: Prentice Hall.
Hanf, J.H., & K ¨uhl, R. (2005). Branding and its consequences for German agribusiness. Agribusiness, 21, 177–189. Hansmann, H. (1996). The ownership of enterprise. Cambridge, MA: The Belknap Press of Harvard University Press. Hardesty, S.D. (2005). Cooperatives as marketers of branded products. Journal of Food Distribution Research, 36(1),
1–6.
Harris, A., Stefanson, B., & Fulton, M. (1996). New generation cooperatives and cooperative theory. Journal of Cooperatives, 11, 15–28.
Hendrikse, G.W.J. (2011). Pooling, access and countervailing power in channel governance. Management Science, 57(9), 1692–1702.
Hendrikse, G.W.J., & Bijman, J. (2002). On the emergence of new growers’ associations: Self-selection vs. market power. European Review of Agricultural Economics, 29(2), 255–269.