Environ Resource Econ (2009) 44:203–230 DOI 10.1007/s10640-009-9280-x
Municipal Waste Kuznets Curves: Evidence
on Socio-Economic Drivers and Policy Effectiveness
from the EU
Massimiliano Mazzanti· Roberto Zoboli
Accepted: 27 February 2009 / Published online: 20 March 2009 © Springer Science+Business Media B.V. 2009
Abstract Waste generation and waste disposal are becoming increasingly prominent in the environmental arena, from a policy perspective and in the context of delinking analysis. In general, waste generation is still increasing proportionally with income, and economic and environmental costs associated to landfilling are also increasing. This paper provides a comprehensive analysis of waste generation, incineration and landfill dynamics based on panel data for the EU25, to assess the effects of different drivers (economic, structural, policy) and the eventual differences between Western and Eastern EU countries. We show that for waste generation there is still no Waste Kuznets Curve (WKC) trend, although elasticity to income drivers appears lower than in the past. Landfill and other policy effects do not seem to provide backward incentives for waste prevention, and in terms of landfill and inciner-ation, as expected, they are respectively decreasing and increasing, with policy acting as a strong driver. Eastern countries appear to be performing generally quite well, thus benefiting from EU membership and related policies in terms of environmental performance. We can conclude that although absolute delinking is far from being achieved for waste generation, there are some first positive signs of an increasing relative delinking for waste generation and robust landfill diversion, and varying evidence of a significant role of the EU waste policies implemented in the late 1990s and early 2000s. Our evidence suggests that if while landfill diversion is currently associated to a delinking partly explained by EU policies, waste prevention must be the next objective of waste regulation efforts.
M. Mazzanti (B)
Department of Economics Institutions and Territory, University of Ferrara, Via Voltapaletto 11, 44100 Ferrara, Italy
e-mail: [email protected] M. Mazzanti
National Research Council CERIS-CNR, Milan, Italy R. Zoboli
204 M. Mazzanti, R. Zoboli
Keywords Waste Kuznets Curves·Delinking·Waste management·Waste policies· Policy evaluation·Landfill diversion·Waste generation·Incineration·Waste prevention
JEL Classification C23·Q38·Q56
1 Introduction
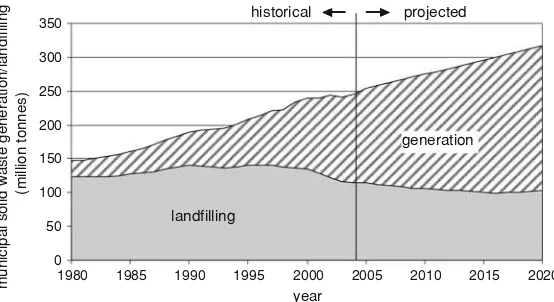
Indicators of ‘decoupling/delinking’ are used to measure improvements in environmental/ resource efficiency with respect to economic activity. The European Union’s (EU) ‘thematic strategies’ on resources and waste, include reference to ‘absolute’ and ‘relative’ delink-ing indicators (EC 2003a,b;Jacobsen et al. 2004). The former are a negative relationship between economic growth and environmental impacts associated to the descending side of an inverted U shape according to the Environmental Kuznets Curves (EKC) framework. The achievement of delinking is of prime importance for waste, which plays as important a role in environmental impact and economic costs as climate change (Fig.1).
TheEEA(2007) acknowledges that “It is increasingly important to provide answers to these questions because waste volumes in the EU are growing, driven by changing produc-tion and consumpproduc-tion patterns”.EEA(2006) also highlights the importance of market-based instruments for achieving a stronger degree of delinking in waste indicators.
From a ‘waste accounting’ perspective, waste generation (WG), or the amount of col-lected waste, can be managed in three ways: recycling (R) and materials recovery, including composting (C), and incineration (I) with energy recovery; incineration (without energy recovery); and landfilling (L, which might also involve energy recovery). Incineration is a hybrid option. If we exclude the possibility of incineration without energy recovery, the net social benefits of incineration should be positive, categorising it within waste recovery rather than final disposal. Treated amounts of waste from the recycling and incineration processes will then need to be disposed of in (regulated) landfills; this is defined as disposal although
generation
landfilling
0 50 100 150 200 250 300 350
1980 1985 1990 1995 2000 2005 2010 2015 2020
year
municipal solid waste generation/landfilling
(million tonnes)
historical projected
Municipal Waste Kuznets Curves 205
incineration with energy recovery other recovery operations
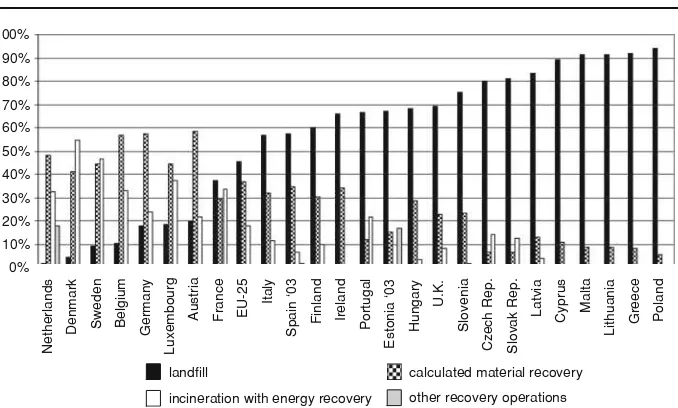
Fig. 2 Landfilling, incineration and materials recovery in 2004.SourceEEA(2007), Eurostat Structural Indicators on municipal waste generated, incinerated and landfilled, supplemented with national statistics
it involves some energy recovery. The mass balance equation is: WG=WR(C+R+I)+L, or WG=WR(C+I)+I+L.1
EEA(2007) shows that countries can be categorised under three waste management ‘groupings’, according to their strategies for diversion of municipal waste away from land-fill, and the relative shares of landfilling, materials recovery (recycling and composting) and incineration. The first group comprises countries with high levels of materials recovery and incineration, and relatively low landfill levels. The second group includes countries with high materials recovery rates, medium incineration levels and medium level dependence on land-fill. The third group includes those countries with low materials recovery and incineration levels and relatively high dependence on landfill (see Fig.2).
The environmental impacts of landfilling are massive (Pearce 2004;El-Fadel et al. 1997; Eshet et al. 2004;DEFRA 2005). Landfilling should not become the default best economic practice in all situations; its costs and benefits are influenced by economic and technolog-ical factors. For examples of economic assessments of different waste disposal strategies, see, among others,Pearce(2004);Dijkgraaf and Vollebergh(2004). It should be noted that reducing waste generation at source through the imposition of policy targets in terms of waste generated per capita, is probably the most effective and efficient way of handling the problem in the long run. Given its potential high cost in the short run, the first phase of policy implementation at EU level has focused on landfill diversion and increased levels of recycling/recovery, including incineration. There is a need to analyse empirically whether
1If we include the possibility of waste prevention/reduction occurring through the implementation of ‘closed
206 M. Mazzanti, R. Zoboli
these policies are being effective in terms of changing the endogenous relationship between economic growth and waste trends.2
This paper provides empirical evidence on delinking trends and Waste Kuznets Curves (WKC) for municipal solid waste (MSW). The primary aim is to provide preliminary robust empirical evidence for a vast regional area (the EU) on the economic and policy drivers of waste dynamics. Although waste policies have been in force for some time in the EU, and are a pillar of EU environmental policy, they have not been studied using quantitative meth-ods. Empirical evidence on WKC dynamics for waste is scarce. Research on delinking for materials and waste is far less developed than research on air pollution and greenhouse gas emissions. This limited research could be a problem for policy.
In addition, analyses using cross country, highly disaggregated panel data on waste are also very scarce, with most studies involving single countries at the regional, provincial or municipal levels. In spite of the significant environmental, policy and economic relevance of waste issues, there is very little empirical evidence on delinking even for major waste streams, such as municipal waste, packaging and other waste.
Analyses of policy effectiveness are also scarce, and generally dominated by studies of waste management optimization schemes or evaluation of externalities. Economic analy-ses are predominantly focused on cost benefit asanaly-sessment of waste site externalities (fixed and variable) and on their acceptability to local communities, with or without compensation (Gallagher et al. 2008). This focus on costs and benefits of siting decisions is due in part to the lack of reliable country level and within country data (Pearce 2004).3
Our first objective is to provide new empirical evidence on WKC and waste policy effec-tiveness in the EU, distinguishing between socio-economic and policy factors. The WKC is appropriate for assessing the effects of socio-economic and structural factors in the business as usual scenario, and the role of policy levers in explaining the eventual delinking between environmental pressure and growth, without which we can expect a lower or even no delink-ing. A secondary objective is to identify differences between the EU15group of countries and new entrants to the EU, with respect to waste drivers, delinking trends and policy effects, depending on the actions taken in response to implementation of the 1999 Landfill Directive4 and even earlier ‘policy actions’ by some countries (e.g. Germany).
The paper is structured as follows. Section2presents evidence on WKC, which high-lights the urgent need to intensify research in this area to enable policy evaluation. Section3
defines the conceptual framework, the empirical model and comments on the empirical results regarding waste generation, incineration, and landfill options. Section 5 concludes.
2EEA(2007) provides a qualitative assessment of landfill and incineration policy tools at EU and country
level.
3We quote, among others,Powell and Brisson(1995);Miranda et al.(2000);Eshet et al.(2004);Brisson and Pearce(1995);Dijkgraaf and Vollebergh(2004). RecentlyCaplan et al.(2007) provides an example of how economic evaluation techniques inform landfill siting process, whileJenkins et al.(2004) provides sound and very interesting econometric analyses of the socio-economic factors explaining the levels of monetary compensation paid to communities hosting landfills.
4“The Landfill Directive pursues two approaches: firstly to introduce stringent technical requirements for
Municipal Waste Kuznets Curves 207
2 Delinking Analysis and WKC: Empirical Evidence
Since the pioneering works of Grossman and Krueger (1994), the World Bank (1992),
Holtz-Eakin and Selden(1992), interest in the so-called Environmental Kuznets Curve (EKC) has increased.
Theoretical studies of EKC are rather scarce although there are some contributions which try to establish some empirical foundations for EKC. These studies generally try to explain EKC dynamics in terms of types of technological investments, endogenous growth spillovers, changing preferences, and policy factors (Chavas 2004).Andreoni and Levinson(2001) is a seminal work that suggests that EKC dynamics quite simply may be technologically micro-founded, and not strictly related to growth and externality issues. At a more macroeconomic level,Brock and Taylor(2004) integrate the EKC framework and the Solow model of eco-nomic growth. Notwithstanding the increasing relevance of theoretical studies on EKC, it is quantitative analysis that dominates, but there is scope for more research at the margins. In the waste realm,Highfill and McCasey(2001) andHuhtala(1997) are some out of a few studies which provides a theoretical underpinning for WKC dealing with dynamic optimal ‘investments’ in waste management and waste disposal options.
We argue that future empirical work should concentrate on using newly constructed, more heterogeneous and longer datasets, either at country level or for samples of countries in homogenous relevant areas, rather than at the cross country international level, where the results of analyses are rather general and whose ‘average’ figures can hide some important features arising from the econometric analysis.
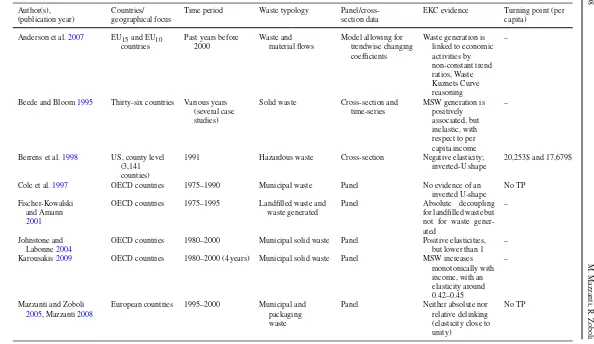
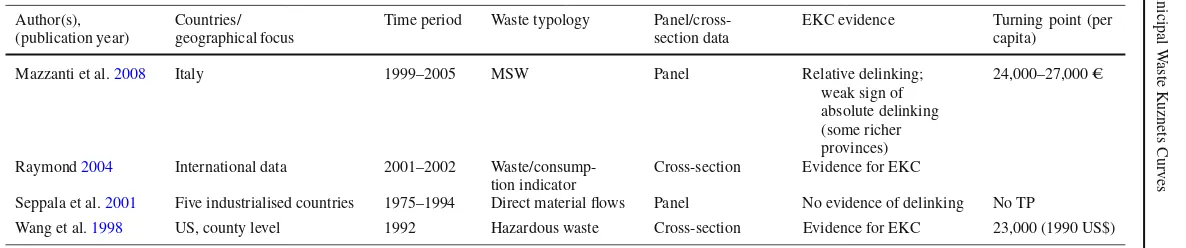
Below we briefly review the evidence on waste delinking, WKC, and model-based waste policy evaluation. Table1presents a summary of the main works.
The report that gave birth to the EKC literature (World Bank 1992) presented some evi-dence based on cross country regression analysis of data from the 1980s; no WKC were found. A more recent report (DEFRA/DTI 2003) highlights the positive elasticity of waste generation to income as a primary concern for policy: waste generation seems still to be characterised by a strict positive relationship with economic drivers.
One of the earliest WKC studies was byCole et al.(1997), who found no evidence of an inverted U-shape for municipal waste. They found no turning point (TP) in their study, which exploited data on MSW, for the period 1975–1990, for 13 OECD countries. Similarly,
Seppala et al.(2001), in a study of five industrialised countries including Japan, the US and Germany, over a similar time period (1970–1994), also found no evidence of delinking regarding ‘direct material flows’. However, there is some emerging evidence of delinking, although for quite specific (waste) indicators.Raymond(2004) presents evidence of a WKC based on a waste/consumption indicator derived from environmental sustainability indexes (ESI).Berrens et al.(1998) andWang et al.(1998), focusing on stocks of hazardous waste in the US and exploiting a county-based cross sectional dataset also find evidence in favour of a negative elasticity.
2
Table 1 Literature survey on waste-related studies
Author(s),
Anderson et al.2007 EU15and EU10 countries
Beede and Bloom1995 Thirty-six countries Various years (several case
Berrens et al.1998 US, county level (3,141 counties)
1991 Hazardous waste Cross-section Negative elasticity; inverted-U shape
20,253$ and 17,679$
Cole et al.1997 OECD countries 1975–1990 Municipal waste Panel No evidence of an
inverted U-shape
No TP
Fischer-Kowalski and Amann 2001
OECD countries 1975–1995 Landfilled waste and waste generated
OECD countries 1980–2000 Municipal solid waste Panel Positive elasticities, but lower than 1
–
Municipal
W
aste
K
uznets
Curv
es
209
Table 1 continued
Author(s), (publication year)
Countries/ geographical focus
Time period Waste typology Panel/cross-section data
EKC evidence Turning point (per capita)
Mazzanti et al.2008 Italy 1999–2005 MSW Panel Relative delinking;
weak sign of absolute delinking (some richer provinces)
24,000–27,000e
Raymond2004 International data 2001–2002 Waste/consump-tion indicator
Cross-section Evidence for EKC
Seppala et al.2001 Five industrialised countries 1975–1994 Direct material flows Panel No evidence of delinking No TP
Wang et al.1998 US, county level 1992 Hazardous waste Cross-section Evidence for EKC 23,000 (1990 US$)
210 M. Mazzanti, R. Zoboli
Few WKC studies incorporate waste policy analyses.Karousakis(2009) deals with policy evaluation, and presents evidence on the determinants of waste generation and the driving forces behind the proportions of paper/glass recycled, and the proportion of waste going to landfill. The data are for a panel of 30 OECD countries and the results show that MSW increases monotonically with income, and that urbanisation exerts an even stronger effect on waste generation, while the time-invariant policy index is not significant.
Other studies have investigated policy actions, but at the level of single countries, exploit-ing rich regional data, which however allows moderate generalisation of results.Mazzanti et al.(2008) find some WKC evidence and signs that waste management instruments do have an effect on reducing waste generation in Italy, where trends are affected by economic, policy and structural geographical differences.5There are also some studies on specific evaluations
of the Landfill Directive—the main driver of regulatory actions in the EU, and the UK landfill tax—introduced in 1996 and one of the few cases of a real environmental tax based on eval-uation of the marginal external costs. They include, among others, work byMartin and Scott
(2003), which stresses that tax aimed at reducing landfilling of waste in favour of recovery, recycling, re-use and waste minimisation has failed to significantly change the behaviour of domestic waste producers.
For countries outside the EU, analyses are rare.Taseli(2007) recently presented an assess-ment of the EU Landfill Directive on Turkey, a potential EU member that is comparable to some of the eastern European country new member states. This study highlights the immense difficulties in such countries of achieving even long run targets. Outside Europe, there are numerous studies on landfill diversion and waste generation in Far Eastern countries where land values are especially high and population densities are peaking at world levels (Lang 2005;Ozawa 2005;Yang and Innes 2007). Population density and waste policies emerge as complementary drivers of stronger delinking of both waste generation and landfilling, through more active recycling.
The literature on waste drivers and WKC, therefore, underlines that waste generation still generally tend to increase with income or other economic drivers, such as population, and that, in general, an inverted U-shape curve is not in line with the data. Some authors have suggested that for stock pollution externalities, e.g. waste, the pollution-income relation-ship difficulty shows a WKC shaped curve, with pollution stocks monotonically rising with income (Lieb 2004).
A decreasing trend (negative elasticity) for land filling is found in industrialised countries with more developed waste management and waste policies. Nevertheless, there is a risk that WKC trends (absolute delinking) are associated with a few rich countries or areas, and can divide countries in terms of waste performance indicators. Another structural reason for the lack of evidence on waste might be that the change in the sign of income elasticity of the environment/income function will occur at relatively lower income levels for pollutants whose production and consumption can be easily spatially separated, e.g. by exporting the associated pollution or relocating the activities. This will likely be more difficult for waste flows.
The literature survey highlights the need for and value of in-depth investigations on driv-ers of waste policy and its effectiveness: what is required is WKC analyses combined with studies of policy effectiveness and an extensive evaluation of waste drivers. The general added value of delinking analysis is not (only) to show whether economic drivers produce decoupling effects, but more especially, to assess whether and to what extent, there are addi-tional factors that influence this core relationship, and increase the explanatory power of the
Municipal Waste Kuznets Curves 211
model proposed. Our work on the EU allows some generalisation since it focuses on a large regional area that is relatively homogenous and has common waste policy references in the form of EU Directives. Most existing studies analyse circumscribed local situations, with a focus on specific waste streams and waste management instruments and unit based pricing among other aspects (Sterner and Bartelings 1999;Ferrara and Missios 2005).
3 Empirical Analyses
3.1 The Empirical Model and the Data
In order to verify the delinking relationships between waste indicators (from generation to disposal) and the economic, socio-economic/structural6 and policy drivers, we refer to the established EKC framework.
The main methodological problem for applied analysis in this delinking-related frame-work is how to specify the WKC functional relationship. Some authors estimate second order polynomial, others estimate third or even fourth order polynomials, comparing different spec-ifications for relative robustness. N shapes are not relevant here given that the evidence for waste shows that even bell shapes are rare.7
We test our hypotheses by specifying the proper reduced form usual in the EKC field (Stern 1998,2004;Cole 2005;Cole et al. 1997;Dinda 2005)8:
log(WI)=β0i+βt+β1log (C)it+β2log(C)2it+β3(Xi)+β4(Zi)+e9it,10 (1)
where the first two terms are intercept parameters, which vary across countries and years. X refers to all other structural and socio-economic drivers that are added to the baseline specifi-cation in order to correct for the omission of relevant variables. Z is a vector of policy related variables (see Tables2,3for the variables).11In order to mitigate collinearity flaws, when
highly correlated to each other, the variables included in the vectors X and Z are tested sepa-rately. The error term has the usual properties in panel settings, although obviously differing between fixed effects (FE) and Random Effects Model (REM) settings.
6We define these factors as structural since, with respect to waste trends, they are a set of exogenous potential
drivers that are influenced by the historical, institutional and cultural development of the country and also are relevant for waste management and disposal based on idiosyncratic geographical aspects (e.g. population density).
7Cubic specifications for waste are not conceptually or empirically relevant and, as would be expected, are
not significant.
8The panel data model presented here refers to a baseline fixed effects model (FEM) with FE and time
dummies.
9Waste Indicator: MSW—GEN, MSW—INC, MSW—LAND—see Table2.
10All the analyses specify consumption as the main economic driver, since it is the most plausible in waste
dynamics given its strict link to MSW (Mazzanti and Zoboli 2005). However, the results do not change if we use GDP. We took household expenditure (consumption) per capita as the main economic driver, based on the hypothesis that consumption is a better independent variable for waste collection and disposal (Rothman 1998;Jacobsen et al. 2004;Gawande et al. 2001).
11The model is based on a framework derived from the EKC literature. All variables are specified in
2
1
2
M
.
M
az
za
n
ti,
R
.
Z
o
b
o
li
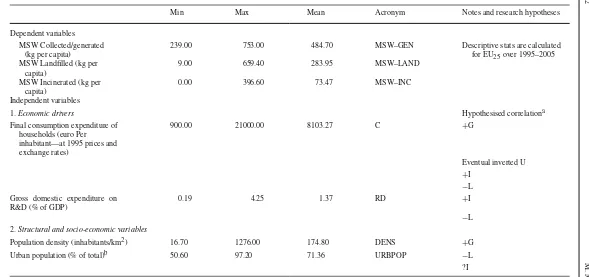
Table 2 Descriptive statistics and a summary of research hypotheses
Min Max Mean Acronym Notes and research hypotheses
Dependent variables MSW Collected/generated
(kg per capita)
239.00 753.00 484.70 MSW–GEN Descriptive stats are calculated
for EU25over 1995–2005 MSW Landfilled (kg per
capita)
9.00 659.40 283.95 MSW–LAND
MSW Incinerated (kg per capita)
0.00 396.60 73.47 MSW–INC
Independent variables
1.Economic drivers Hypothesised correlationa
Final consumption expenditure of households (euro Per inhabitant—at 1995 prices and exchange rates)
900.00 21000.00 8103.27 C +G
Eventual inverted U
+I
−L
Gross domestic expenditure on R&D (% of GDP)
0.19 4.25 1.37 RD +I
−L
2.Structural and socio-economic variables
Population density (inhabitants/km2) 16.70 1276.00 174.80 DENS +G
Urban population (% of total)b 50.60 97.20 71.36 URBPOP −L
?I
Municipal
W
aste
K
uznets
Curv
es
213
Table 2 Continued
Household size 1.9 3.4 2.62 SIZE −G
Single households (%) 10.12 38.30 25.04 SINGLE +G
Age index or ‘elderly ratio’ (population 60 and over to population 20–59 years) 0.3 0.5 0.358 OLDNESS ?G
Share of manufacturing value added 9.10 36.30 18.54 VAMAN −G
3.Policy variables
Decentralised waste management policy drivers (dummy) 0 1 0.24 DECPOLIND ?G,L,I
Incineration directive (dummy: years/country in which Directive is transposed) 0 1 0.24 INCDIR −G
+I
−L
Landfill directive (dummy: years/country in which directive is ratified) 0 1 0.27 LANDIR −G
Waste strategy policy index (range 0–1) 0.00 0.95 0.34 POLIND +I
Landfill strategy policy index 0.00 0.25 0.09 LANDPOLIND −L
All values in non log format
aThe sign on the hypothesised correlation is shown, as well as the level at which this is most relevant (G for generation, L for land-filling, R for recycling, I for incineration).
The element (?) means that the hypothesis is ambiguous either because opposing forces may be influencing the link or because economic theory and other scientific fields do not provide clear insights
bGiven high correlation, population density and urban population are used alternatively in estimations
214 M. Mazzanti, R. Zoboli
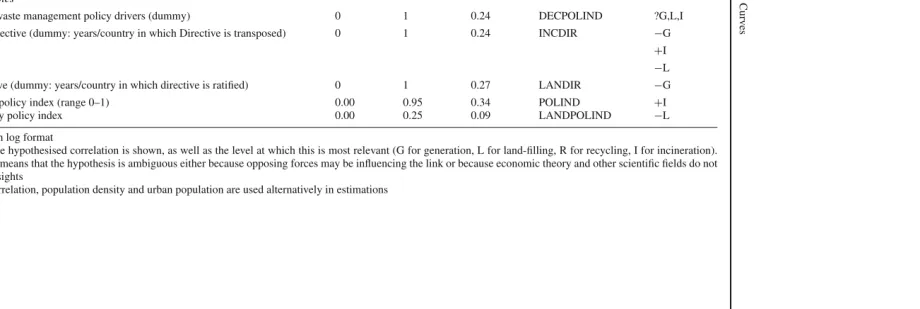
Table 3 Main figures (1995–2005 values)
Countries C MSW–GEN MSW–LAND MSW–INC
Austria 12700–14500 438–630 204.7–112.6 54.3–147
Belgium 11400–13000 456–464 218.4–43.4 162.8–154.9
Cyprus 6900–8800 600–739 599.6–653.1 0–0
Czech Republic 2100–2800 302–289 301.9–208.7 0–36.7
Denmark 13400–15600 567–737 96.4–38.3 294.1–396.6
Estonia 1100–2300 368–436 365.3–274.1 0–0.1
Finland 9700–13200 414–468 267.9–275.8 0–40.7
France 11200–13500 476–543 213.6–195.7 178.3–183.5
Germany 13300–14500 533–601 245.3–88.8 97.1–147.9
Greece 6100–8200 302–438 311–380.5 0–0
Hungary 1700–2800 460–459 346–361.8 31.9–29.1
Ireland 7300–11300 514–740 398.1–443.9 0–0
Italy 8800–9900 454–542 422.2–296.4 23.9–62
Latvia 1000–2000 263–310 246.7–243.2 0–3
Lithuania 900–1900 424–378 424.4–340.2 0–0.1
Luxembourg 16300–21000 592–705 160.6–126.7 312.2–252.5
Malta 4900–5100 338–611 311.2–542.8 0–0
Netherlands 10100–12300 549–624 157.5–9.0 138.5–207.5
Poland 1600–2500 285–245 279.5–225.9 0–1.2
Portugal 5500–6900 385–446 200.3–278.1 0–98.5
Slovakia 1400–2200 295–289 168–227.8 28.2–34
Slovenia 4600–6000 596–423 456.6–329.7 0–0.6
Spain 6900–9000 510–597 308.4–317.5 24.3–34.9
Sweden 10500–13000 386–482 136.1–23.3 148.6–242.1
United Kingdom 9200–12500 499–584 414–374.9 45–48.9
SourceEurostat
In order to test the hypotheses, we exploit information on waste collected and waste land-filled and incinerated in a group of European countries for 1995–2005 (Eurostat sources).12
The standard WKC specification includes two groups of variables—socio-economic/struc-tural variables and policy indexes—to control for inter-country heterogeneity. The first group controls for the socio-economics factors that might differ between countries, such as pop-ulation density, urban poppop-ulation, household size, share of manufacturing in the economy based on data mainly from EUROSTAT structural indicators datasets. Variables for policy indexes are constructed based on the country fact sheets available at EIONET,13and public information on the ratification of the EU Landfill and Incineration Directives.
12Table3provides a summary of country heterogeneity for the main variables.
13EIONET is the information network of the European Environment Agency (EEA) and its member countries,
Municipal Waste Kuznets Curves 215
Below we provide specifications for the three waste indicators investigated,14highlighting which factors and hypotheses are linked to the three different levels of the waste chain, from generation to disposal. A concise discussion of the main hypotheses and the variables used in specific regressions is provided for each level (see also Table2).
3.1.1 Waste Generation
This level of analysis provides direct evidence regarding the usual WKC hypothesis in terms of the waste generation-income relationship. Waste generation reduction (i.e. ‘waste preven-tion’) is the ultimate objective of any social policy targeted towards waste flows, although for the most part explicit policy actions (targets for waste generated per capita) do not exist. Although waste prevention is at the top of the waste hierarchy in the EU, there are no directives so far that include actions oriented specifically towards waste prevention. Waste management (separated collection, recovery/recycling) and landfill diversion are the focus of existing waste policies, probably because of their presumed relatively lower implementation and compliance costs.
Let us analyse the various research hypotheses we may formulate for waste generation. Regarding economic drivers, a WKC oriented structure of the model allows the estimation of an eventual TP for waste generation. This is generally not observed. The TP hints at the GDP/consumption level beyond which the relationship (in this case, between waste produc-tion and income) turns negative. Existing econometric and descriptive empirical evidence shows that only a relative delinking is observed. We aim to provide new evidence based on official EU data.
We also test various hypotheses on the possible effects exerted by socio-economic and structural variables, which represent a diverse set of factors (see Table2).
Population density (or urban population)15is likely to have a positive impact on waste generation. In more densely populated areas, only economies of scale spurred by urbanisation could invert the trend and reduce generation. Household features may matter at this level. In fact, we expect that the larger the size of the household, the less waste will be generated per capita. Nevertheless, even a positive link could be plausible if waste management at the domestic level (composting) is poorly developed on average. Thus, more single person households should increase waste generation.
We use age as a control variable. From a socio-economic point of view, there may be opposite forces at play: if, on the one hand, older people produce less waste than younger residents, it is also true that older people may be less accustomed or committed to collection and recycling of waste. On the other hand, the opportunity cost of time is lower for older people, and waste collection/recycling efforts require time. The sign of the relationship, then, is unpredictable. Interaction with data on education level would be interesting, but this would be the subject for micro-based studies, which would probably test these other factors more robustly. We use them here (given their availability) as controls to mitigate for problems of omitting relevant variables. Some of these socio-economic variables capture more than one of the structural/institutional elements characterising a country.
We also include in our analysis two types of policy proxies. The first is related to the European Landfill and Incineration Directives and their implementation in member states.
14Waste generation, incineration and landfill disposal. Waste generation is measured by waste collection, the
observable factor. We do not present results for recycling (although they are available) because recycling is only calculated as a residual (MSW generation—MSW landfilled—MSW incinerated).
216 M. Mazzanti, R. Zoboli
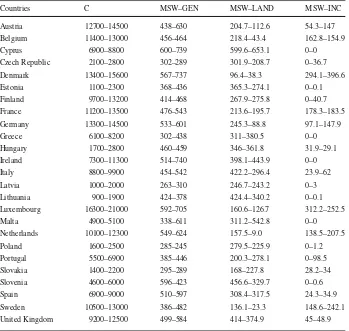
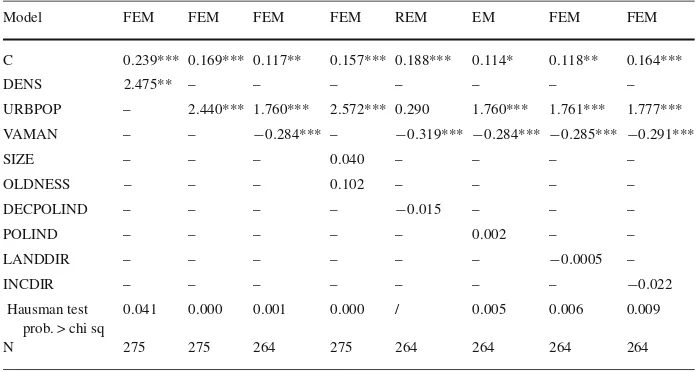
Table 4 MSW generation regression (EU25)
Model FEM FEM FEM FEM REM EM FEM FEM
C 0.239*** 0.169*** 0.117** 0.157*** 0.188*** 0.114* 0.118** 0.164***
DENS 2.475** – – – – – – –
URBPOP – 2.440*** 1.760*** 2.572*** 0.290 1.760*** 1.761*** 1.777*** VAMAN – – −0.284*** – −0.319*** −0.284*** −0.285*** −0.291***
SIZE – – – 0.040 – – – –
OLDNESS – – – 0.102 – – – –
DECPOLIND – – – – −0.015 – – –
POLIND – – – – – 0.002 – –
LANDDIR – – – – – – −0.0005 –
INCDIR – – – – – – – −0.022
Hausman test prob. > chi sq
0.041 0.000 0.001 0.000 / 0.005 0.006 0.009
N 275 275 264 275 264 264 264 264
(–) means not included. Significance at 90%, 95% and 99% is denoted by *, ** and ***; TP (e, consumption per capita); F test show overall significance for all regressions at 1% significance; R squared present reason-ably high value for panel settings. All variables are in logarithmic form when possible. The constant term in REM and the overall constant/individual fixed effects in FEM are not shown
These proxies are built as dummy variables that take the value 1 in a given year between 1995 and 2005 if a country has transposed these Directives into its national law. We expect implementation to be positively correlated with delinking performance.
The second group of policy indexes is more country specific. We first exploit a ‘decen-tralised waste management index’ that reflects the degree of waste policy decentralisation across countries.16Decentralisation may positively affect waste generation, via prevention
and better waste management performance, because of higher flexibility and specificity in policy implementation, which may account for local idiosyncratic cost and benefit elements related to policy (Pearce 2004).17Although decentralisation may improve policy implemen-tation in the EU, including policies for waste prevention, it may have some drawbacks in terms of exploitation of local rents by public and private agents. In principle, rents are neither good nor bad in the environmental realm. What matters is their effects on static and dynamic elements such as value creation and innovation. Waste ‘markets’, such as land-filling and even recycling, may be associated with rents that could lock in a local system to less than optimal equilibrium. This aspect required further research.Watson et al.(2008) discuss some policy decentralisation and environmental policy integration issues, focusing on waste management and governance in the UK.
Finally, we also include an environmental policy index. This is a proxy for national policies implemented over the time period examined. It captures all possible information regarding national implementation of waste related policies (MSW, biodegradable solid waste, pack-aging waste, end of life vehicles, other). We used the country studies available on EIONET
16This discrete index variable captures the extent to which a country is decentralised in (waste) policies,
and more generally is structured as a federal state. Actually, 4 countries are associated to the value 1: Italy, Germany, Austria, Spain, 2 have the value 0.5 (UK and Belgium), all others have the value 0.
17Fredriksson(2000) studies the pros and cons of decentralisation versus centralised management options
Municipal Waste Kuznets Curves 217
as our information source. The index is both very comprehensive with regard to Landfill Directive related variables,18 and also may capture some of the waste prevention features of national policies.19It should be noted that, contrary to the decentralised policy index, all other proxies vary across countries and over time.
Introducing policy proxies is crucial in the waste arena and could constitute a contribution of our work. Their role is very relevant because many European policies have been enacted quite recently, and their inclusion in a WKC framework could produce a sort of ex-post effectiveness evaluation. Both structural indicators and policy variables could be important drivers of WKC shapes; their omission could overestimate the ‘pure’ economic effect.
The specification we test in this case then is:
log(MSW−GEN)=β0i+βt+β1log(C)it+β2log(C)2it+β3(Xi)it
+β4(Zi)it+eit (2)
where X denotes the above discussed socio-economic/structural factors (DENS or URBPOP, SIZE, SINGLE, OLDNESS, VAMAN) and Z the policy levers (DECPOLIND, INCDIR, LANDIR, POLIND). For a summary of the covariates related to the level of waste genera-tion see Tables2,3.
3.1.2 Landfill Diversion
The second level of the empirical model focuses on the disposal stage in the waste chain, i.e. landfilling. The economic driver is hypothesised to have an impact on landfilled waste and to show a bell shape. In fact, although some countries are continuing to increase their share of landfill and there is wide heterogeneity across Europe, on average, shares of landfilled waste and landfilled waste per capita have been constantly decreasing over the last decade. We can also expect to find a negative relationship, not a bell shape. From the viewpoint of the EU average, the period 1995–2005 may already be at the ‘right’ descending side of an inverted U shaped landfill-economic growth relationship. It is possible that testing for N shapes will be more relevant in the future. For example, a major country, such as Italy, following a decade of focusing on landfill diversion, has seen a slight increase in waste landfilled per capita in 2006 with regard 2005.
In terms of socio-economic and structural factors, we assume that population density and urbanisation will be negatively related to landfilled waste. Both the opportunity costs linked to the higher value of land in densely populated and urban areas (value of land, of commer-cial activities crowded out by landfill sites, and other public investments), and the higher externality costs that arise in areas of higher residential occupation should, ceteris paribus, drive down the use of landfill as a disposal option and as a real ‘investment’ opportunity in terms of rents, compared to other market rents (André and Cerda 2004). However, since such
18Thus, in any given year, each country is associated with an index value, which assigns 1 to the maximum
potential value (among all the considered policies). We differentiate between the presence of only strategy (low value), and an effective regulatory policy (high value). The latter is assigned a stronger weight (0 for no policy, 1 only strategy, 2 policy). Prominent examples of overall environmental policy performance index setups for many countries based on a synthesis of diverse policy performances can be found inEliste and Fred-rikkson(1998).Cagatay and Mihci(2003;2006) provide an index of environmental sensitivity performance for 1990–1995, for acidification, climate change, water and even waste management.
19We can hypothesise that the backward effects of landfill policies and waste management actions on the
218 M. Mazzanti, R. Zoboli
opportunity costs and environmental costs may vary across regions (e.g. EU15versus EU10) we need a careful case by case investigation of this hypothesis.
The core factors we test at this level are policy levers. This is a crucial step in our analysis. By exploiting both the binary indexes and the continuous synthetic index, which it should be noted both vary over time and across countries, we can verify the extent to which the policy experiences of European countries in the last decade (primarily the 1999 Landfill Directive), have affected the waste-income relationship. Since the synthetic policy index also captures the general commitment of a country over the period, actions that occurred prior to 1999 and the actual implementation of the Directive, are taken account of in the econometric investigation.
The specification tested then is:
log(MSW−LAND)=β0i+βt+β1log(C)it+β2log(C)2it+β3(Xi)it
+β4(Zi)it+eit (3)
where X (DENS or URBPOP) and Z (DECPOLIND, INCDIR, LANDIR, POLIND) refer to the socio-economic and policy variables linked to this stage of the investigation, as summa-rised in Table2.20
3.1.3 Incinerated Waste
The WKC-like relationship here assumes a different character. In fact, we can expect that incineration, at least in the EU15(data availability confines our analysis to the EU15, given that EU countries show incineration level close to zero), is positively related to economic growth over recent years. This is evident from the descriptive analysis and is obviously linked to the trend towards landfill diversion. Nevertheless, the non-linearity of the relation-ship could assume an exponential or a bell-shaped dynamics. We would expect the latter as being more plausible given that incineration is associated, to some extent, with dimin-ishing marginal returns and increasing external costs. The interpretation is different from the usual EKC hypothesis for waste generation and landfilling. It is related to the fact that our analysis includes other options, such as recycling and composting, which are treated as ‘residuals’ here. The increasing role of these options, common to most countries, should lead to and make compatible scenarios of landfill diversion and increasing, but not exponentially, incineration, independent of the delinking dynamics of waste generation at source. As many quantitative applied studies show, in the waste arena corner solutions are seldom (never) optimal strategies, given the increasing marginal costs—financial and social—of landfilling, incineration and recycling.
Linked to the above comments, we assume here that we cannot formulate a clear hypoth-esis on the role of density. The resulting sign is ambiguous depending on the alternative to landfill disposal, if any, that is chosen. If we assume that densely populated areas move away from landfilling, the opportunity costs and environmental costs of incineration could represent a relatively better scenario. If, instead, the country moves away from landfilling primarily to recycling and incineration then population density/degree of urbanisation may be negatively linked.
20For landfill diversion and incineration we test two stage regressions, including the predicted values of waste
Municipal Waste Kuznets Curves 219
We also test R&D intensity, exploited as a country specific effect. Although some outliers may exist, i.e. countries with high R&D/GDP shares and low incineration levels, eventually because of their more determined pursuit of recycling strategies, on average we would expect a dynamic, strong correlation between a country’s technological intensity and its incineration level. The example of Germany may be a paradigmatic case in Europe. We test whether this anecdotal evidence may represent a general statistical regularity. Given the potential corre-lation with GDP, R&D is tested as an alternative to consumption. Eventual non-linearity is tested to account for the diminishing marginal effects of R&D on incineration technology strategies.
The reasoning related to policy levers is similar, but with the opposite expected sign, as for landfill diversion. At this stage we can expect a robust specific link between implementation of the Incineration Directive and incinerated waste dynamics.
The specification for incinerated waste then is:
log(MSW−INC)=β0i+βt+β1log(C)it+β2log(C)2it+β3(Xi)it+β4(Zi)it+eit (4a)
or
log(MSW−INC)=β0i+βt+β1log(R&D/GDP)it+β2log(R&D/GDP)2it
+β3(Xi)it+β4(Zi)it+eit (4b)
where X (DENS or URBPOP) and Z (DECPOLIND, INCDIR, LANDIR, POLIND) refer to the socio-economic and policy variables.
3.2 Methodological Issues and Estimation Procedures
We present the regression results for EU25, given their higher statistical robustness and gen-erality. Specific outcomes for the sub samples (EU15and EU10) are commented on. Because of the large number of cases involved, Table4reports only the EU25regressions. All analyses are available upon request.
The analyses are conducted in three steps: (i) a traditional WKC specification, including only the main economic driver; (ii) the specification with the structural and socio-economic drivers relevant at each level of the waste chain; (iii) the regression including the economic driver, the significant structural factors and the different policy indexes.
For all levels, the variables included in vectors X and Z are inserted separately to mitigate collinearity flaws. Only the more robust results are shown. The exception is for incineration, which is 0 for most east European countries; we therefore focus on the EU15.
All regressions are estimated first by FEM and REM, and the best specification is selected following the Hausman test.21
21REM is generally more appropriate for datasets derived from larger statistical populations, while the FEM
220 M. Mazzanti, R. Zoboli
In addition, we test the extent to which random coefficient models and dynamic models add insights.22First, we test the relevance of theSwamy (1970) random-coefficients lin-ear regression model, and then we focus on two different types of dynamic model, GMM (General Method of Moment) and Least Square dummy variable correction (LSDVC,Bruno 2005). This further level of analysis aims to test whether models that take account of differ-ent aspects omitted in the simple FEM and REM analysis (e.g. heterogeneity of slopes and dynamics) confirm our results.
3.2.1 MSW Generation
The analyses (Table4) do not show overall WKC evidence for MSW generation. The linear term shows a significant and positive coefficient for consumption, with an elasticity in the range 0.114–0.23 across specifications.23The EU
15and EU25analyses are similar, but with higher elasticity (around 0.70–0.80) in the case of the former. These elasticities are slightly lower than found in previous analyses of Europe using waste data for the 1990s (Mazzanti 2008), and also seem to imply more active delinking for the EU10countries.24In general, then, our evidence is of a ‘relative delinking’ in the relation. This result is interesting and partially confirms our expectations, but with some positive signs in terms of currently lower elasticities.
The introduction of socio-economic controls does not alter the results. The results pro-vide epro-vidence of relative delinking, and elasticity equal to 0.72 in the EU15sub-sample and lower than 0.20 for EU25(see Table4). The most significant and robust control variables are population density (or share of urban population) and share of manufacturing in total economic activities. Share of manufacturing has a negative sign which is in line with our expectations: wealthier and more services oriented economies produce more waste per capita. This questions whether relatively better environmental performance is always associated with services, especially if we focus on pollution-related aspects: composition effects for waste (MSW includes some commercial and business waste), could show counterintuitive results. Population density or urban population in these economies instead impacts positively on waste generation: scale effects prevail over possible economies of scale in waste prevention and waste management/collection activities. All other factors are never significant.
To sum up, socio-economic structural factors provide useful pointers to what drives waste generation although they do not impact on the core relationship. Household related structural
Footnote 21 continued
(General Least Squares) and LSDV (Least Square Dummy Variables) estimators. As noted byList and Gallet
(1999), the parameter estimates of FEM and REM converge as Time and cross section observations increase, which also confirms our findings.
22We estimated the relationship in first differences to take account of possible serial correlations in the data,
but the results were similar to those for the FE estimation. A FEM with time FE proved to be not significant in terms of time dummies and overall robustness.
23Table4presents linear specifications only. The results do not change overall if we run quadratic
specifi-cations, showing no EKC evidence, but with a linear term with a negative coefficient and the quadratic term with a positive one. This is due to the nature of the data, and captures the effect of the low-income countries (e.g. Lithuania, Czech Republic, Slovakia, Poland and Slovenia), which registered a reduction in total MSW collected in the period under study. This slight anomaly generates a downwardly sloped relationship between MSW collected and consumption, in the first phase.
24This may be interpreted in terms of the (observed even in other contexts) delinking in some east
European countries (Hungary among others), which may be driving the general empirical picture. Even the EU25quadratic analysis shows a U shaped curve affected by delinking in low income eastern European
Municipal Waste Kuznets Curves 221
variables seem not to have a major influence. Average household behaviour and characteristics are not correlated (either negatively or positively) to the amount of waste generated/collected. This might indicate that policy efforts are having more effect on post-consumer activities, such as recycling and landfilling operations.
We next exploit our policy proxies adding these variables to the set of explanatory factors. Neither the Landfill Directive nor the environmental policy indexes are statistically signifi-cant.25This means that the efforts made so far have not promoted strong delinking between waste generation/collection and domestic consumption.26The results are the same when we analyse the smaller samples. Overall, policy levers appear to have a marginal, if any, impact on waste generation. This reflects the weakness of policies aimed at waste prevention and the negligible effects of landfill policies on waste generation. These results point to the need for waste policies that target waste reduction at source by incentivising firms to make greater efforts perhaps in the form of different product characteristics and reduce product weights (Glachant 2004), and encouraging households to change their consumption patterns in order to reduce waste collection and increase collection of separated waste materials and composting. Behaviour may change through a shift towards more environmentally minded consumption also driven by income and (sustainable consumption) policy. In addition, policy can affect behaviour by influencing the relative prices of market and non-market goods in favour of partial or total internalisation of environmental diseconomies (Choe and Fraser 1999).27Efforts to reduce waste at source have been lacking so far; initially, policies focused on waste disposal were perceived as being less costly and may continue to be so if there is no clear decision about which type of policy fits best with net present value in the medium-long run, thereby leading to clearer efficiency assessments (Pearce 2004).
3.2.2 Landfilled Waste
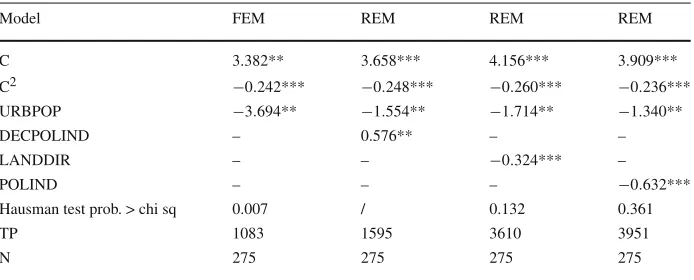
The analysis of landfilled waste presented in Table5, as expected, supports the existence of a WKC. The process of diverting waste from landfill in the EU began around 1995. Thus, our data register mainly the downward-sloped part of the relationship and the TP. This is in line with the seeming relatively better performance of the EU10for waste generation, but further investigation is needed to confirm this difference.28
The introduction of socio-economic/structural variables does not alter the previous results, and again shows a trend towards absolute delinking in relation to waste landfilling in Europe. Other significant factors are density and degree of urbanisation (EU25/EU15, respectively
25Although, when implementing a two stages regression, estimating the fitted values of POLIND in the first
stage (covariates URBPOP, C) and using those values as covariates in the second stage regression with MSW generation as the dependent variable (without C), POLIND emerges with a positive sign. This signals the potential ‘endogeneity’ of policy commitment with regard to income/consumption levels. When incomes are higher, MSW is also higher, and given that there is no absolute delinking in the EU, waste policy actions are stronger or more extensive.
26The underlying correlation between the dummies for adoption of the Landfill and Incineration Directives
is 0.66.
27Who show first and second best optimum solutions from the imposition of environmental taxes on firms
and waste charges on households, and including the monitoring of illegal waste dumping.
28The evidence may be driven by effective good performance by those countries experiencing a period of
economic growth since the late 1990s associated with the implementation of environmental policies in line with the richer EU countries (a requirement for joining the EU). From a development point of view, we could claim that the EU10countries have more opportunity to be more efficient, at the same income levels, since
222 M. Mazzanti, R. Zoboli
Table 5 Landfilled MSW (EU25)
Model FEM REM REM REM
C 3.382** 3.658*** 4.156*** 3.909***
C2 −0.242*** −0.248*** −0.260*** −0.236***
URBPOP −3.694** −1.554** −1.714** −1.340**
DECPOLIND – 0.576** – –
LANDDIR – – −0.324*** –
POLIND – – – −0.632***
Hausman test prob. > chi sq 0.007 / 0.132 0.361
TP 1083 1595 3610 3951
N 275 275 275 275
(–) means not included. Significance at 90%, 95% and 99% is denoted by *, ** and ***; TP (e, consumption per capita); F test show overall significance for all regressions at 1% significance; R squared present reasonably high value for panel settings. All variables are in logarithmic form when possible. The constant term in REM and the overall constant/individual fixed effects in FEM are not shown
positive and negative signs).29The EU
15 shows a stronger statistical significance associ-ated with the negative sign. There is an economic rationale for this result: the significance of density and urban population (shown to be positively correlated to waste generation), is expected for waste landfilling, and shows that where opportunity costs are higher (in urban areas, densely populated areas) and externalities affect higher numbers of people, landfill diversion is stronger. For example, there are numerous landfill studies on areas where the value of land and population densities are very high, e.g. in the Asian countries (Lang 2005;
Ozawa 2005).30The size of the coefficient and its statistical significance are similarly high. Such factors might explain the degree of delinking and landfill diversion in the endogenous scenario, i.e. without policy intervention.
Finally, our analysis shows that the policy levers, i.e. the policy indexes, the Landfill Directive and the Incineration Directive, are highly significant and negatively correlated to waste landfilling, i.e. they favour diversion. These results are confirmed for both coun-try sub-samples. The main relationship persists for the different specifications and levels of significance, while the TP is slightly higher than the above estimates. These results are important as they underline the effectiveness achieved by European policy, as an additional lever to those described above, in terms of diverting waste from landfill. Policies promote endogenous delinking driven by mere economic drivers.
In terms of the other environmental policy proxies analysed, the index for Decentralised Waste Management (DWM) (taking three values, low/medium/high), is significant at 1% and has a positive coefficient. This seems to suggest that the more that waste management is decentralised within countries the more difficult is diversion from landfill. Interpretation of this result remains open, but the evidence is not necessarily counterintuitive: in DWM sys-tems (e.g. Italy) there are often incentives for local waste management actors (municipalities)
29Both become positive for the EU
10. For degree of urbanisation this may imply a different influence or
level of opportunity cost linked to urbanisation. Urbanisation trends in the EU10countries are in their infancy but quite relevant for forecasting and planning future scenarios, given their impacts on environmental per-formances and their high growth rates. High opportunity costs in terms of land use and land prices have not probably emerged yet. The link between land prices and landfill diversion is better and fully analysed at micro level.
Municipal Waste Kuznets Curves 223
to increase waste disposal in terms of landfill or recycling, depending which option produces the higher rent in the local ‘market’. Since landfill rents are often very high, DWM could favour biased dynamics. We are not suggesting negative effects from DWM overall. We would underline that this variable is time invariant and captures only cross country heterogeneity, as opposed to other policy proxies we exploit in our analyses.31
We would underline that from a statistical viewpoint policy dummies (unlike the policy index) are not affected by endogeneity issues, being positively but not highly correlated to income variables (below 0.10). Early movers are likely to be the wealthier countries, e.g. Germany.32We note that as far as the index POLIND is concerned, two stage instrumental variable (IV) regression using consumption as driver of the index in the first stage and then including the predicted values of the index in the specification analysing waste indicators, confirms the results. In this case, POLIND is highly and negatively related to landfilled MSW per capita. This potential endogeneity, which characterises only this comprehensive index and captures a country’s overall waste policy commitment and actions, does not undermine our evidence and also is accounted for.
3.2.3 Incinerated Waste
In this case we drop all country observations with missing or zero value data for the ana-lysed period.33The result is a sub-sample comprising the EU
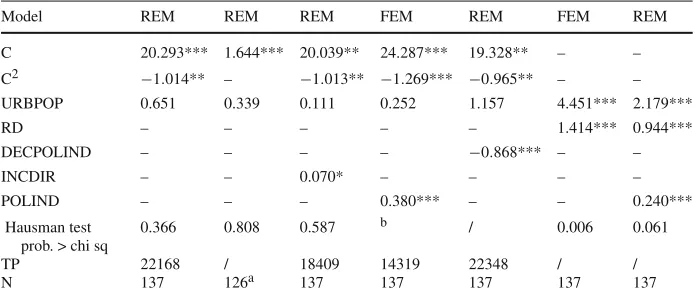
15countries minus Ireland and Greece.34Missing data can be zero data because incineration is a relatively new management option and has been adopted mostly by the EU15countries. In the first regression (Table6) we observe the joint significance of the linear and quadratic terms for consumption (model 4a). This is due to the presence of an outlier, Luxembourg, which has high income and a relatively low level of incinerated waste. It is the only country with a consumption level in line with the TP, which in turn appears quite high. When this country is excluded from the dataset, the quadratic term loses its significance and the relation becomes linear and with an elasticity greater than 1 (1.67).35
Based on this first step we can conclude that in the analysed period the trend in Europe is towards including incineration in waste management options. The meaning of the TP,
31The fact that the more the country is decentralised the more that landfill is the preferred option may be
driven by countries such as Italy, Spain, Belgium and the UK, which present medium-low landfill diversion performance in comparison to the other EU15countries.
32Recent studies have focused on analysing the drivers of environmental regulation, defining endogenous
factors (Cole et al. 2006;Alpay et al. 2006). Consistent with reasoning in the innovation and EKC-related lit-erature, policies may result endogenous at various level of analysis (firms, industry, country levels) and driven by income, strategic and regional factors (Cagatay and Mihci 2006;Cole et al. 2005). For (paper) waste, in more developed, wealthier countries, the evidence supports higher demand for waste management and envi-ronmental policies (Berglund and Soderholm 2003). At the micro levelCallan and Thomas(1999,2006), who study the drivers of unit pricing and estimated disposal and recycling demand elasticities at municipal level, provide evidence of policy (economic instrument) and unit price endogeneity with regard to demographics, fiscal capacity and socio-economic determinants. This type of endogeneity also characterises management of the water sector.
33Some regressions are performed using a semi log model to deal with the large number of zero values. The
semi log specifications are not shown, but the results differ only slightly. Analyses that take account of zero values (no incineration) provide scope for further research.
34The result is an unbalanced panel, since Portugal and Finland have missing data for the years between 1995
and 1998.
35The somewhat high values of the coefficients in the incineration regression may be driven by the nature of
224 M. Mazzanti, R. Zoboli
Table 6 Incinerated MSW (EU15)
Model REM REM REM FEM REM FEM REM
C 20.293*** 1.644*** 20.039** 24.287*** 19.328** – –
C2 −1.014** – −1.013** −1.269*** −0.965** – –
URBPOP 0.651 0.339 0.111 0.252 1.157 4.451*** 2.179***
RD – – – – – 1.414*** 0.944***
DECPOLIND – – – – −0.868*** – –
INCDIR – – 0.070* – – – –
POLIND – – – 0.380*** – – 0.240***
Hausman test prob. > chi sq
0.366 0.808 0.587 b / 0.006 0.061
TP 22168 / 18409 14319 22348 / /
N 137 126a 137 137 137 137 137
(–) Means not included. Significance at 90%, 95% and 99% is denoted by *, ** and ***; TP (e, consumption per capita); F test show overall significance for all regressions at 1% significance; R squared present reasonably high value for panel settings. All variables are in logarithmic form when possible.aExcluding Luxembourg.
bThough the test fails to meet the asymptotic assumptions, REM and FEM provides very similar economic
and statistical results. The constant term in REM and the overall constant / individual fixed effects in Fem are not shown
although probably contingent as explained above, is different in this case. Since incinera-tion is associated with costs and benefits that need to be evaluated case by case (Dijkgraaf and Vollebergh 2004), and could change over time, we can expect in the future to observe eventual decreasing trends as income grows. This potential dynamic, which is the reverse of the current one, may be explained by ‘diminishing returns’. Ultimately, all waste recovery options are subject to non-increasing returns to scale, and to problems of land scarcity (e.g. incinerator sites).
Other covariates are not relevant: both density and URBPOP have the expected positive but not significant coefficient in most cases.
The introduction into the regression of the environmental policy index and the Incineration Directive dummy gives very important results. Both indicators are statistically significant at 1% and (only) 10% respectively, but in this case they are positively correlated to the amount of waste incinerated, as we would expect based on our analysis of landfilling trends and the development of European policies. This is a common development among the countries analysed. The index for decentralised policy actions, on the other hand, has a negative effect on incineration dynamics. On average, then, our regressions show that where waste policy is more decentralised, incineration is undermined and landfilling is ‘preferred’. The fact that landfill diversion is not favoured by the decentralisation of policy is a significant result and requires further investigation given the importance of decentralisation in many EU countries (e.g. Italy, Germany and Spain).
Municipal Waste Kuznets Curves 225
of Table6) R&D effects prevail from an economic perspective (coefficient size), somewhat decreasing the importance of policy (POLIND), which is nevertheless highly significant in statistical terms.36This is a very interesting result. It could be interpreted as meaning that, overall, innovative dynamics (and landfill diversion), as well as policy levers, have spurred incineration trends over the last decade. Future assessments of the relative role of technolog-ical and policy levers, and their possible complementarities, should be the subjects of future research.
3.2.4 Model Extensions: Slope Heterogeneity and Dynamic Models
We also provide additional evidence from random coefficient and dynamic panel models. We focus only on the main specifications related to landfilling and waste generation, given the restricted data on incineration.
First, we perform the Swamy random-coefficients linear regression model including a test for parameter (slopes) constancy. The aim is to test our previous results for the presence of heterogeneity among slopes for different individuals (countries). We estimate the previous EKC model (model 1) now considering the coefficientβasβi=β+ξi, with i = 1,…,N.
Secondly, regarding the dynamic analysis we estimate the dynamic effect with a traditional GMM. The estimated model becomes:
log(WI)=αlog(WI)t−1+β1log(C)it+β2log(C)2it+β3(Zi)it+eit (5)
where WI is the waste indicator, Z refers to the policy variables andα is the coefficient of the lagged dependent variable. We include in our results, for every different estimation technique, the basic EKC specification (i.e. step 1 in the above), and a further specification including policy indicators.
Table7presents the results for MSW–GEN. We can see that accounting for slope hetero-geneity generates an increase in the elasticity of the relationship. As in the previous cases, the policy drivers are not significant. When we apply GMM the scenario is very similar: the relationship is still monotonically increasing. The main difference from the previous models is the significance of the policy index.37Overall, there are some differences in these models, although the core evidence on delinking is unaffected.38
36We note a difference between FEM and REM in this respect. The FEM model (not shown) shows a 10%
significance for POLIND, and a very large coefficient for R&D.
37We note here and below that the use of a LSDV correction à laKiviet(1995) as an alternative to GMM
(Arellano and Bond 1991) produces less significant results. SeeBruno(2005) for a recent and thought pro-voking discussion and comparison of different dynamic panel models.
38An alternative to Swamy estimations is SUR (seemingly unrelated regression) estimations, which account
for correlations across potentially related regressions in the panel. SUR estimation is appropriate for situations where the panel is characterised by long time series (List and Gallet 1999) and/or some hypothesis on corre-lations between specific units in the data are the aim of the analyses (e.g. UK versus Germany). We therefore believe this is not the best framework for our study since we focus on statistical pooled based regularities across the EU25, over a decade. Such panel/time series analysis provides scope for further research investigating the
226 M. Mazzanti, R. Zoboli
Table 7 MSW generation regression results (EU25); Swamy random-coefficients linear regression model and dynamic analysis
Model Random-coefficient GMM-diff one step GMM-diff one step
C 0.714*** 0.129*** 0.158***
MSW–GEN(−1) 0.817*** 0.783***
POLIND −0.116 – −0.140***
Slope test 0.0000 – –
Sargan test – 0.000 0.000
N 275 250 250
(–) means not included; significance at 90%, 95% and 99% is denoted by *, ** and ***; TP (e, consumption per capita), F test show overall significance for all regressions at 1%
Table 8 MSW landfilled regression results (EU25); Swamy random-coefficients linear regression model and
dynamic analysis
Model
Random-coefficient
Random-coefficient
Random-coefficient
GMM-diff one step
GMM-diff one step
C 2.220*** 2.699*** 2.017*** −0.122*** −0.397***
C2 −0.173∗ ∗∗ −0.225*** −0.149*** – –
MSW–LAND(−1) – – – 1.190*** 0.495***
LANDDIR −0.182∗ ∗∗ – – – –
POLIND – −0.019 – – −0.033**
LANDPOLIND – – −0.443 – –
Slope test 0.0000 0.0000 0.0000 – –
Sargan test – – – 0.0000 0.0000
TP 605 349 849 – –
N 275 275 275 250 250
(–) means not included; significance at 90%, 95% and 99% is denoted by *, ** and ***; TP (e, consumption per capita), F test show overall significance for all regressions at 1%
As far as waste landfilled is concerned, Table8presents the results. The random-coeffi-cient model shows the Landfill Directive dummy highly significant and negatively correlated with the amount of waste landfilled. On the other hand, the policy index keeps its explan-atory power, but only in the non-quadratic specification,39which are not shown since less significant.
The introduction of the dynamics leads to a monotonically decreasing relationship between waste landfilled, and consumption. This is to be expected considering that in all the previous specifications the TP is always related to low levels of consumption. In the EU, for waste landfilled, we observe here the descending part of the inverted U shaped relationship. Further-more, in the dynamic models, both the landfill policy index and the presence of the Landfill Directive (the latter not shown) are highly significant variables and are negatively correlated with the amount of waste landfilled.
39LANDPOLIND is a sub-specification of POLIND, which is more general: it accounts only for waste
Municipal Waste Kuznets Curves 227
4 Conclusions
Our study aimed to establish a sound framework to analyse delinking for diverse waste related trends, within a WKC conceptual framework that encompasses the policy evaluation stage. The paper provides new evidence on waste generation and disposal delinking, exploiting a rich, updated EU-based dataset that allows various analyses on the relative roles of economic drivers, structural socio-economic factors and policy drivers in the waste system. The core WKC hypothesis was tested and its robustness confirmed by the inclusion of explanatory variables.
First, the results show that regarding waste generation in EU25we can detect no WKC trend, although elasticity to income drivers appears lower than in the past, pointing to the presence of a current relative delinking. For the EU10, there are stronger delinking signals, although this aspect should be investigated further in order to have a more robust validation. No landfill or other policy effects seem to provide backward incentives for waste prevention, a result that calls for the introduction of waste policies targeted at the sources of the waste generated. This confirms the lack of policy action on waste prevention relative to landfill diversion, at the EU level. We note that even the revised 2008 Waste Framework Directive, which might be expected to include some per capita targets for waste generation, although it explicitly reassesses the objective of delinking and the necessity for using economic policy instruments to tackle waste externalities according to relative social costs, does not ultimately fix waste prevention targets. Article 9 on waste prevention sets future actions only in terms of stating that by the end of 2014, waste prevention and decoupling objectives for 2020 will be presented, and article 29 indicates that countries should prepare waste prevention programmes by 2013 (the EEA is required to report annually on this evolution from 2008 to 2013), with delinking performance to be evaluated every six years. It would seem clear that absolute delinking is not present for MSW generation and EU member countries have managed to postpone specific waste generation per capita targets.
Second, our study provides evidence confirming that landfill and incineration are respec-tively significantly decreasing and increasing in relation to income/consumption, i.e. along the endogenous cycle of economic development, but with policy effects also significantly driving these trends: both policy dummies linked to EU directives and the comprehensive policy index we defined, were negatively correlated to landfilled waste, across specifications. Some additional factors, such as urbanisation and density among others, appear to be playing a role. In the absence of policies, delinking of landfilling seems to be driven by the increas-ing opportunity costs and environmental costs associated with the use of land resources for waste disposal. Interestingly, as far as incineration dynamics are concerned, they seem to be explained by R&D, an income-related country specific factor, and by policy levers. Com-plementarities between innovation and policy dynamics in affecting waste (incineration) is scope for further research.
We thus find that socio-economic and policy factors impact on waste trends, confirming that EKC analyses cannot rely on a mere and somewhat rough environment-income relation-ship. It should also be noted that the effects of policy may in part be endogenous in terms of economic indicators, which are particularly relevant in the waste arena.