Pekanbaru,13 November 2018
Oil Palm Plantation Land Suitability Classification using
PCA-FCM
Siska Kurnia Gusti
1, Rahmad Abdillah
2Teknik Informatika, Fakultas Sains & Teknologi, UIN Sultan Syarif Kasim Riau 12 Jl. H.R. Soebrantas Km. 15 Panam Pekanbaru, Telp. 0761-8359937 [email protected] 1, [email protected] 2
Abstract
Classification of land suitability is very important for oil palm plantation for oil palm and quality of oil palm yield. This classification depends on soil properties and climate characteristic of Pelalawan district, Riau province. Soil properties are combinations of soil characteristics which are known to occur in soils and which are considered to be indicative of present or past soil-forming processes. In addition to soil properties, land suitability also is influenced by the climate in that area. Climate components that influence the growth of palm oil are the air temperature, rainfall and humidity. Furthermore, to classify land suitability will be variables. While comparative study, PCA-FCM can achieve 98.890% for training process and 98.655% for testing respectively. By applying PCA to classify land suitability, the accuracy of classification can be maintained with less of the number of variables.
Keywords: Classification, FCM, Land Suitability, PCA
1. Introduction
Evaluation of land utilization is used to assess land performance. Therefore, Land evaluation as a guide for decisions making on land utilization in order to classify land suitability. The land suitability approach also concerned to appraisal and clustering of specific areas of land in terms of their suitability [1]. Food and Agriculture Organization (FAO) in years 1984 proposed a general framework for the land suitability classification involving suitability (S) and not suitability (N). Nevertheless, this framework, does not provide a specific method for doing this classification.
Pelalawan Regency is one of the oil palm producing areas in Indonesia. This area has a condition of the soil and climate which suitable for oil palm cultivation, thus this area is necessary to classify of land suitability of this area need to be classifier in order to facilitate the process of planting oil palm and determine where the land suitable for oil palm cultivation. This study will focus, assess on the land how to performance based on land suitability for Pelalawan Regency, Riau Province.
The last few years, classification technique has become more popular in the area agriculture. The advancement in Agricultural research has been improved by technical advances in computation, automation and data mining for example classification. The purpose of land suitability classification is to explicitly display specific crop land suitability classification and the classes of land suitability over which the crops may be grown with benefit. This study uses the classification techniques for analysis of soil and climate data to classify land suitability. The various techniques of classification are used and compared in this study.
Many researchers have proposed various techniques for classification. As reported by
fuzzy and non-fuzzy clustering. Optimum number of clustering based on K-Means and Fuzzy C-Means (FCM) methods.
In this study, the technique that combined Principal Component Analysis (PCA) and Fuzzy Clustering Means (FCM) is proposed for classification. Subsequently, The performance measurement of that technique is accuracy classification.
2. Research Method
This Section introduces a broad overview of the concept, terminology and methods related to soil and climate characterization, previous research on soil and climate characterization, suitability types of soil and clime for oil palm to correlate properties against oil palm yield. In this chapter other important ideas, strategies and techniques have been clarified. These ideas can be found in relevant research works
2.1. Land Suitability
Land suitability is the fitness of a given type of land for a defined use. The land may be considered in its present condition or after improvements. The process of land suitability classification is the appraisal and grouping of specific areas of land in terms of their suitability for defining uses.
This study also used one class under not suitable (N). The criteria of land suitability classification for oil palm based at The Centre for Soil and Agroclimate Research (2003) are shown in Table 1. For the purpose of this study, the potential land suitability of the area was determined for oil palm.
Table 1. Criteria for Actual and Potential Suitability of the Lands for Oil Palm
Criteria for actual and potential suitability of the lands for
Land Characteristics oil palm property for agriculture soil classification, for example, fertility, drainage, water holding capacity, aeration, tillage, and strength of soils. Soil classification deals with the systematic categorization of soils based on distinguishing characteristics as criteria that dictate choices in use for agriculture. Soil classification is a dynamic subject, from the structure of the system itself, to the definitions of classes, and finally in the application in the field. Soil classification can be approached from the perspective of soil as a material and soil as a resource.
According to research by [2], the soils are classified into different orders, suborders, great groups, sub-groups, families and finally into the series as per USDA Soil Taxonomy. The solid phase of soil can be divided into mineral matter and organic matter. The classes of soil particles according to size are Sand, Silt, Clay and the proposition of Sand, Silt, and Clay present in soil determines its texture.
Pekanbaru,13 November 2018
2.3. Climate
The climate, perhaps to be the most important ambient factor in soil profile development is presented below:
1. As the pointed out in weathering, temperature and precipitation have great influence on the weathering.
2. The amount of precipitation affects how much various materials are leached from the soil, thereby affecting soil fertility.
3. Climate affects the type of plant and animal life present.
Climate components that influence the growth of palm oil is the air temperature, precipitation and
humidity. The location of this dissertation is located between 0°7’12” - 0°1’48” south latitude and
between 102°7’12” - 102°15’0” east longitude which affect the number of and the pattern of the climate component.
Annual rainfall average in the study area during the last ten years (2000-2009) was 2,430 with an average of 95 days of rain per year, 9 months and 1 month wet dry. According to the classification from Schmidth-Ferguson, climate the plantation is grouped into types A, namely the very wet areas with tropical rain forest vegetation.
2.4. PCA
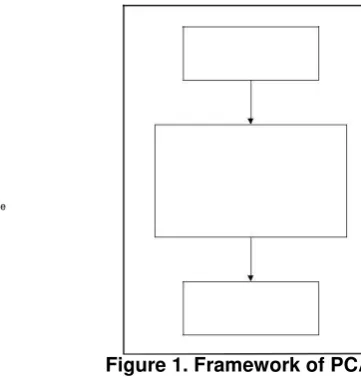
PCA in figure 1 used for selected variables for obtaining best variables. The first process starts from data collection with soil and climate data and analysing the original variables, namely eight variables. The data have been measured based on variables, then continued for reduction variables of original using PCA and will be selected best variables. The processes of PCA are consisting identify data; calculate mean and standard deviation (SD). After that, calculate covariance matrix, eigenvector and eigenvalue, and the last are calculated percentage of the PC for each variable. The result of percentage of PC has been obtained and then will be selected the best PC-score, which is devoted to choosing the best variables than others. Every variable sorted from percentage of PC highest. The end of this framework is selecting the best variables from eight variables.
Data Collection - Data Soil and Climate - Eight variables used
Principal Component Anaylisis - Identification data - Calculate Mean, SD - Calculate Covariance Matrix - Calculate Eigenvactor and Eigenmatrix - Calculate percentage of PC on each variable
Sequence of the best variables 6 or 7 or 8 variables?
Figure 1. Framework of PCA
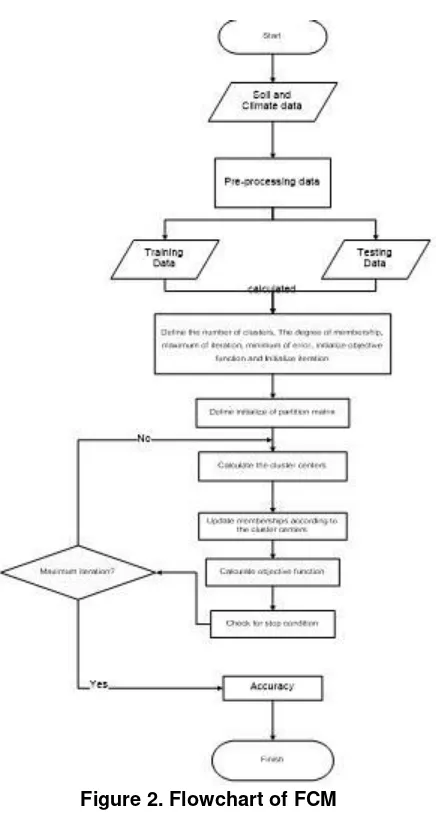
2.5. FCM
Figure 2. Flowchart of FCM
2.6. Previous Work
[3], proposed a comparative study for classifying soil texture using data mining techniques like GATree, Fuzzy Classification Rules and Fuzzy C-Means algorithm. The achieved performances of the methods are compared and analyzed on the collected supervised and unsupervised soil data. GAtree and Fuzzy Classification rules were used for supervised learning. However, classification based on Fuzzy rules gives much performance than GAtree with average accuracy rate are 46,67% for GAtree and 99% for Fuzzy Classification rules. In addition to, for unsupervised learning Fuzzy C-Means algorithm was used for classifying the soil data with average accuracy rate of 90,90%.
[4] proposed to classify soil data using unsupervised learning techniques like K-Means and compared with NRCS classification. In this work, to implemented data mining technique use selected a subset of soils from the World Soil Science database. There are three types of the soils as sodic, saline-sodic and non-saline sodic. The aim of this research focuses to find out the useful relationships among different type of soils and create clusters of the soil based on their salinity. The resulting in this research, the clustering process divides the databases of unknown soils into clusters based on their similarity and only forecasted results and maybe scientifically tested.
Pekanbaru,13 November 2018
[6] investigated electrical conductivity of soil using two methods, implement fuzzy and non-fuzzy clustering. Optimum number of clustering based on K-Means and Fuzzy C-Means (FCM) methods are 6 and 8 clusters respectively. The fuzzy method was resulted in better results compared with no fuzzy one. By considering FCM method and in order to regionalization of the obtained results, the regionalization plan of these results has been provided. Also, the non-fuzzy regionalization plan of the results has been provided based on K-Means. In very soil investigations, its distinct that the fuzzy methods have the best result than non-fuzzy methods. This research upholds this point.
[2] proposed a method that uses Generating Fuzzy rules to discuss how fuzzy classification rules are generated from soil data and to design of fuzzy classification system. The implementation was done with two approaches. In the first approach, they convert the training data into initial set of fuzzy rules and merged the number of fuzzy rules. Then finally testing data can be taken to test the generated fuzzy rules. In the second approach, they have modified the first program in such a way that it accepts input attributes and generates the final rule. The impressive result the second approaches is more effective than the first approach, because works well only for a predefined set of training data, whereas the second approach eliminates the need of generating initial rules.
[7] proposed land suitability classification for oil palm in Besitang Watershed, North Sumatra, Indonesia based on matching method and criteria was adopted from Land Suitability for Agricultural Plants by the Centre for Soil and Agroclimate Research, Bogor-Indonesia. The process of land suitability classification is the appraisal and grouping of specific areas of land in terms of their suitability for defining uses. Actual land suitability class of oil palm under the different decision zones is moderately suitable, marginal suitable and not suitable. The result of this research the decision zone that is located in upland stream sub-watershed, generally is limited by slope, in the middle stream is nutrient retention, and the lower stream is nutrient retention and flood hazard. Therefore, for oil palm, rating can be improved by fertilization, terracing and ditch/channel drainage.
3. Results and Analysis 3.1. Data Partition
In this study, the dataset is partitioned divided into two parts; training and testing. For training set is divided 60% from the amount of dataset used to develop classify model and 40% for testing set to test the trained data and validation the ability of the data to correctly classify unknown inputs that were not presented to it in the training phase. Training dataset selected is 48 data and for the testing dataset (testing and validation) are 32.
3.2. Determine Degree of Membership using FCM
In this study, process to find out degree of membership into all the clusters using FCM with soil and climate data of land suitability used in MATLAB 2012a. Every cluster in FCM that will have a high degree of membership to that cluster and will have a low degree of membership if the data point far away from the centre of a cluster. Work steps using Fuzzy C-Means algorithm (FCM) is define:
1. The number of clusters (C = 2) 2. Rank (w = 2)
3. Maximum iterations (maxiter = 1000) 4. The smallest expected error (ξ = 0.0001) 5. Initial objective function (P0 = 0)
6. Initial iteration (t = 1)
Table 2. Process Calculate Degree of Membership Cluster 1
2.3735 224.0995 139.2601 92.4334 50.9233
Σ
UI1 2
*
XIJ
/
Σ
UI12
94.4195 58.6737 38.9443 21.4553
Table 2. Process Calculate Degree of Membership Cluster 2
Degree of membership (µ21)
4.2139 373.3235 278.9861 164.9294 109.3653
Σ
UI1 2
*
XIJ
/
Σ
UI12
88.5948 66.2068 39.1404 25.9536
Pekanbaru,13 November 2018
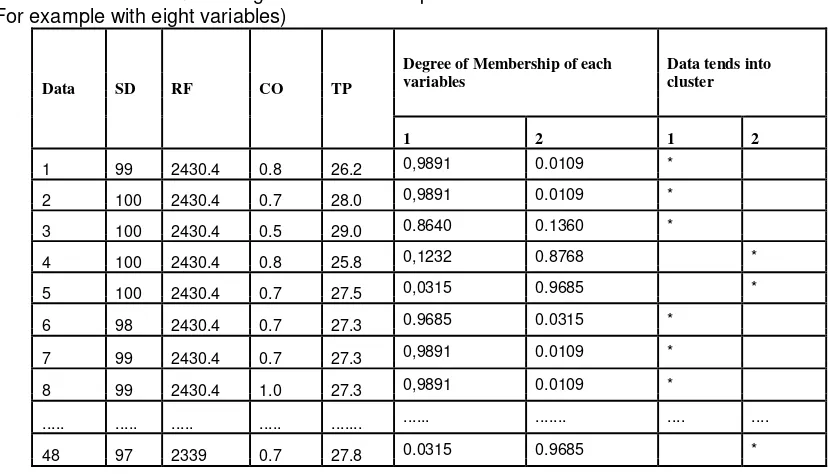
Table 3. Process Calculate Degree of Membership of each variables (For example with eight variables)
Degree of Membership of each Data tends into Data SD RF CO TP variables cluster
1 2 1 2
1 99 2430.4 0.8 26.2 0,9891 0.0109 *
2 100 2430.4 0.7 28.0 0,9891 0.0109 *
3 100 2430.4 0.5 29.0 0.8640 0.1360 *
4 100 2430.4 0.8 25.8 0,1232 0.8768 *
5 100 2430.4 0.7 27.5 0,0315 0.9685 *
6 98 2430.4 0.7 27.3 0.9685 0.0315 *
7 99 2430.4 0.7 27.3 0,9891 0.0109 *
8 99 2430.4 1.0 27.3 0,9891 0.0109 *
... ... ... ... ... ... ... .... ....
48 97 2339 0.7 27.8 0.0315 0.9685 *
From the table 3 above can be concluded:
1. Data were entered into cluster 1 ( land suitability ) is data number 1,2,3,6,7,8 and etc. 2. Data were entered into cluster 2 ( land unsuitability ) is data number 4,5, 48 and etc.
Last process in FCM is calculated the objective function and next stop is done under condition checking. Process of iteration was stopped on maximum iteration = 1.000. If the requirements have been met, then the data can be displayed. Then, until: | Pt - Pt-1 | < or t > MaxIter.
3.3. Result of best variable
Based on determined by the parameters, the results of eight, seven, six, five and four best variables obtained the average of classification accuracy. The result, as shown in Table 4 as follows:
Table 4. Result of PCA and FCM with Eight, Seven, Six, Five and Four Variables.
Average of Accuracy
Number of Variable (%)
Training Testing
8 variables 91.650 90.075 7 variables 95.482 94.593 6 variables 98.780 97.345 5 variables 97.265 96.130 4 variables 95.440 94.238
Based on the table 4, the best classification accuracy is 98.780% for training in 6 variables and 97.345% for testing in 6 variables. The best classification accuracy from PCA and FCM provides when using minimum the number of variables that have been reduced by PCA. Therefore, the PCA and FCM achieved best classification accuracy for training and testing process with good performance, then MAPE obtained is 0.01.
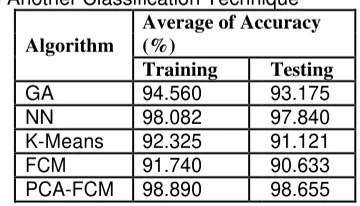
3.4. Compare with Another Classification Technique
Table 5. Result Compare with Another Classification Technique
Average of Accuracy
Algorithm (%)
Training Testing
GA 94.560 93.175
NN 98.082 97.840
K-Means 92.325 91.121
FCM 91.740 90.633
PCA-FCM 98.890 98.655
Table 5 shows a comparison of classification accuracy between GA, NN, K-Means, FCM and PCA-FCM. The result of the comparison from PCA-FCM gives the best result, there are 98.890% for training process and 98.655% for the testing process. From the obtained results, may conclude that PCA-FCM is better than another algorithm because the aim of PCA in this study to improve performance on the classification process from FCM.
4. Conclusion
The process of classification accuracy using PCA and FCM and comparative study with another classification algorithm namely GA, NN and K-Means are presented. PCA is used to reduce the number of variables to improve performance of FCM to classify land suitability using soil and climate data. In a comparative study, the result of classification accuracy using PCA-FCM is better than another classification algorithm. The results are 98.890% for training process and 98.655% for testing process and respectively with MAPE is 0.01. Therefore, PCA-FCM is good performance to classification accuracy of land suitability with minimum number of variables from eight to six.
References
[1] Huajun T, Debaveye J, Da R, Van Ranst E. Land Suitability Classification Based on Fuzzy Set Theory. Pedologie. 1991;(March):277–90.
[2] Bhargavi P, Jyothi S. Soil classification using gatree. Int J Comput Sci Inf Technol. 2010;2(5):184– 91. [3] Bhargavi P, Jyothi S. Soil Classification Using Data Mining Techniques : A Comparative Study. Int J Eng
Trends Technol. 2011;(July to Aug):55–9.
[4] Taneja S, Arora R, Kaur S. Mining of soil data using unsupervised learning technique. Int J Appl Eng Res. 2012;7:1901–7.
[5] Wang G, Yan L, Yao Y, Chun C. Application Research of Weighted Fuzzy C Means Clustering about Soil
Fertility Evaluation in Nong’an County*. In: Recent Advances in Computer Science and Information
Engineering Lecture Notes in Electrical Engineering. 2012. p. 197–8.
[6] Nourzadeh M, Hashemy SM, Martin JAR, Bahrami HA, Moshashaei S. Using fuzzy clustering algorithms to describe the distribution of trace elements in arable calcareous soils in northwest Iran. Arch Agron Soil Sci. 2013;59(3):435–48.