Journal of Physics: Conference Series
PAPER • OPEN ACCESS
Severe Drought Event in Indonesia Following 2015/16 El Niño/positive
Indian Dipole Events
To cite this article: D O Lestari et al 2018 J. Phys.: Conf. Ser. 1011 012040
View the article online for updates and enhancements.
1234567890 ‘’“”
The International Conference on Theoretical and Applied Physics IOP Publishing
IOP Conf. Series: Journal of Physics: Conf. Series 1011 (2018) 012040 doi :10.1088/1742-6596/1011/1/012040
Severe Drought Event in Indonesia Following 2015/16
El
Niño/positive Indian Dipole Events
D O Lestari1, E Sutriyono2, Sabaruddin3, and I Iskandar4*
1
Graduate School of Environmental Sciences, University of Sriwijaya, South Sumatra, Indonesia
2
Departement of Geology, Faculty of Engineering, University of Sriwijaya, South Sumatra, Indonesia
3
Departement of Soil Sciences, Faculty of Agriculture, University of Sriwijaya, South Sumatra, Indonesia
4
Departement of Physics, Faculty of Mathematics and Natural Sciences, University of Sriwijaya, South Sumatra, Indonesia
*Email: [email protected]
Abstract. During boreal fall and winter 2015/16, Indonesia experienced catastrophic drought event causing many environmental problems. This study explored dynamical evolution of drought event in Indonesia associated with those two climate modes. Based on the Niño3.4 index, the evolution of the El Niño has started in April 2015, reached its peak in January 2016 and terminated in April 2016. Meanwhile, the Dipole Mode Index (DMI) revealed that the evolution of positive Indian Ocean Dipole has started in August, reached its peak in September and terminated in November 2015. It is shown that during those two events, Indonesia experienced severe drought in which the precipitation was extremely decreased. During the peak drought condition co-occurring with the dry season, the anomalous of precipitation reached 450 mm/month in September 2015. The peak of the drought was associated with the El Niño and positive Indian Ocean Dipole sea surface temperature anomaly (SSTA) patterns, in which negative SSTA covered the eastern tropical Indian Ocean and the western Pacific Ocean including Indonesia seas. Meanwhile, positive SSTA observed in the western tropical Indian Ocean and Eastern Pacific Ocean.
1. Introduction
2 1234567890 ‘’“”
The International Conference on Theoretical and Applied Physics IOP Publishing
IOP Conf. Series: Journal of Physics: Conf. Series 1011 (2018) 012040 doi :10.1088/1742-6596/1011/1/012040
east Africa, India, and southeast Asia, and deficit precipitation over the Indonesian region and Australia [7–9]. The purpose of this study is to analyze the dynamical evolution of drought event in the Indonesian region during 2015 associated with those two climate modes.
2. Data and Method
This study used three datasets, namely precipitation, SST, and low-level wind (850 mb). The precipitation data were obtained from the Tropical Rainfall Measuring Mission (TRMM) with horizontal resolution of 0.25 0.25 (https://mirador.gsfc.nasa.gov/). The data are available from January 1998 until present. The SST data were from the National Oceanic and Atmospheric Administration (NOAA)’s Optimum Interpolation Sea Surface Temperature (OISST) Version 2 (https://www.esrl.noaa.gov/psd/). The data are available from September 1981 until present, having horizontal resolution of 0.25 0.25. Meanwhile, the low-level wind data were from the ERA-Interim of the European Centre for Medium-Range Weather Forecasts (ECMWF) with a constant horizontal resolution of 0.5 for period of January 1979 until present (http://apps.ecmwf.int/datasets/data/).
Monthly value of the Nino3.4 index and the Dipole Mode Index (DMI) were used to represent the evolution of two types of climate mode in the Indo-Pacific region. The Nino3.4 index is defined as an average SST anomaly in the equatorial Pacific Ocean bounded by 5N to 5S and 170W to 120W
3.1. Evolution of ENSO and IOD events 2015/16
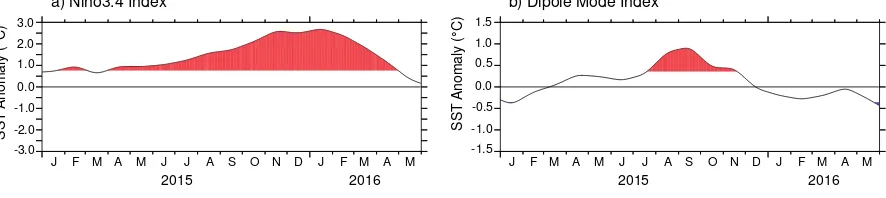
We first calculated the SST anomaly based on Niño3.4 index and DMI region to identify the evolution of ENSO and IOD events. It is shown that during 2015 to 2016 the positive IOD event was co-occurred with the El Niño event. The evolution of El Niño event started from April 2015. It became stronger and reached the peak in January 2016 with a maximum Niño3.4 index reaching >2.5 C. The event decayed in April 2016 (Figure 1a). The DMI revealed that the evolution of positive IOD has started in June/July, reached its peak in September and terminated in November 2015 (Figure 1b).
Figure 1. Time series of (a) Niño3.4 Index and (b) DMI during January 2015 to May 2016. Positive
anomaly (shading) shows El Niño and positive IOD events.
3.2. Spatial Patterns of Precipitation during El Niño/Positive IOD 2015/16
1234567890 ‘’“”
The International Conference on Theoretical and Applied Physics IOP Publishing
IOP Conf. Series: Journal of Physics: Conf. Series 1011 (2018) 012040 doi :10.1088/1742-6596/1011/1/012040
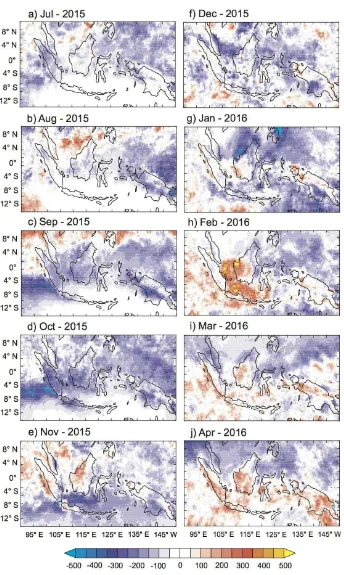
2015. During the peak of positive IOD event, almost all of area in the Indonesia experienced severe drought. The precipitation in the Indonesian region is decreased up to 450 mm/month (Figure 2e).
Figure 2. Spatial patterns of anomalous precipitation (mm/month) over the Indonesian region. Figures
4 1234567890 ‘’“”
The International Conference on Theoretical and Applied Physics IOP Publishing
IOP Conf. Series: Journal of Physics: Conf. Series 1011 (2018) 012040 doi :10.1088/1742-6596/1011/1/012040
In November 2015, while the positive IOD has decayed, the positive precipitation anomalies were observed in northern part of Sumatra, northeastern part of Kalimantan, west Java, and northern Papua Islands. However, the drought condition in southeastern Papua Island was persisting until the peak of El Niño event in January 2016. It is interesting to note that the intensity of negative precipitation anomalies in this area was higher during the peak of positive IOD and approach the peak of El Niño events (September and December 2015).
3.3. Ocean-Atmosphere Interaction in the Indo-Pacific Region
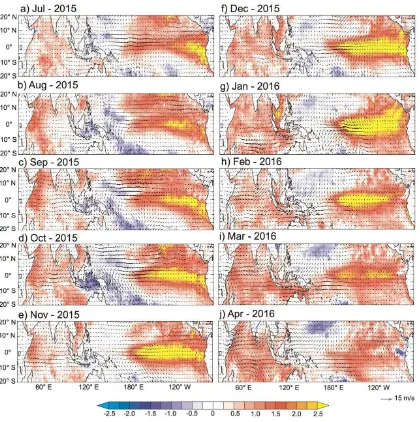
In order to explain the severe drought condition in Indonesian region during 2015/16, we evaluated the ocean-atmosphere interaction in the Indo-Pacific region. Figure 3 shows the spatial patterns of SST and horizontal wind anomalies in the Indo-Pacific region. The negative precipitation anomalies over the Indonesian region associated with negative SST anomalies in the Indonesian seas, eastern tropical Indian Ocean and western tropical Pacific Ocean.
Figure 3. Spatial patterns of the low-level wind anomalies (m/s; vector) superimposed on the SST
1234567890 ‘’“”
The International Conference on Theoretical and Applied Physics IOP Publishing
IOP Conf. Series: Journal of Physics: Conf. Series 1011 (2018) 012040 doi :10.1088/1742-6596/1011/1/012040
During the El Niño and positive IOD events, the Indonesian seas experienced cooling phase. The most striking feature was observed during the maturing phase of the positive IOD. Meanwhile, the warmer SST anomalies was observed in the western tropical Indian Ocean and in the eastern to central tropical Pacific Ocean. The cooling effect of SST anomalies in Indonesian Seas and the warming effect of SST anomalies in the western tropical Indian Ocean and the eastern to central tropical Pacific Ocean have caused divergence wind originated from the Indonesia area. Therefore, the strong westerly wind anomalies were observed in the western tropical Pacific Ocean and strong southeasterly wind anomalies were observed in the eastern tropical Indian Ocean. This divergence circulation causes a descending atmospheric motion over the Indonesian region leading to a suppressed convection. As the positive IOD event terminated, the western Indonesian seas started to warm (Figure 3d).
4. Conclusion
The severe drought condition in the Indonesian region during 2015/16 is caused by the El Niño and positive IOD events that simultaneously occurred. The precipitation anomalies in the Indonesian region decreased drastically in dry season and continued until wet season. This condition is associated with SST and horizontal wind anomalies in the tropical Pacific Ocean and the tropical Indian Ocean. During the dry season, the SST in the Indonesian seas and its surrounding water was anomalously negative. Meanwhile, positive SST anomalies have covered the western (eastern) tropical Indian (Pacific) Ocean. This caused a divergence winds over the Indonesian region, leading to a descending atmospheric motion and a suppressed convection.
Acknowledgement
This research is supported by the PMDSU Scholarship from the Ministry of Research, Technology and Higher Education, Indonesia for the first author. The last author is supported by the Ministry of Research, Technology and Higher Education, Indonesia through Penelitian Berbasis Kompetensi 2017
and by the University of Sriwijaya through Hibah Profesi 2017.
References
[1] Hendon H H 2003 Indonesian Rainfall Variability: Impacts of ENSO and Local Air-Sea Interaction J. Clim.16 1775–1790
[2] Aldrian E and Susanto R D 2003 Identification of Three Dominant Rainfall Regions within Indonesia and Their Relationship to Sea Surface Temperature Int. J. Climatol.23 1435–1452 [3] Saji N H and Yamagata T 2003 Possible Impacts of Indian Ocean Dipole Mode Events on
Global Climate Clim. Res.25 151–169
[4] Trenberth K E 1997 The Definition of El Niño Bull. Am. Meteorol. Soc.78 1–7
[5] Saji N H, Goswami B N, Vinayachandran P N and Yamagata T 1999 A Dipole Mode in the Tropical Indian Ocean Nature401 360–363
[6] Webster P J, Moore A M, Loschnigg J P and Leben R R 1999 Coupled Ocean-Atmosphere Dynamics in the Indian Ocean during 1997-98. Nature401 356–360
[7] Yamagata T, Behera S K, Luo J, Masson S, Jury M R and Rao S A 2004 Coupled Ocean-Atmosphere Variability in the Tropical Indian Ocean Earth’s Clim. Ocean. Interact.
Geophys. Monogr. Ser.147 189–210
[8] Luo J-J, Sasaki W and Masumoto Y 2012 Indian Ocean Warming Modulates Pacific Climate Change Proc. Natl. Acad. Sci.109 18701–18706
[9] Nur’utami M N and Hidayat R 2016 Influences of IOD and ENSO to Indonesian Rainfall Variability : Role of Atmosphere-Ocean Interaction in the Indo-Pacific Sector Procedia Environ. Sci.33 196–203
[10] Luo J J, Zhang R, Behera S K, Masumoto Y, Jin F F, Lukas R and Yamagata T 2010 Interaction between El Niño and Extreme Indian Ocean Dipole J. Clim.23 726–742