Journal of Life Sciences
Volume 6, Number 1, January 2012 (Serial Number 45)
David Publishing Company www.davidpublishing.com
Publication Information
Journal of Life Sciences is published monthly in hard copy (ISSN 1934-7391) and online (ISSN 1934-7405) by David Publishing Company located at 9460 TELSTAR AVE SUITE 5, EL MONTE, CA 91731, USA.
Aims and Scope
Journal of Life Sciences, a monthly professional academic journal, covers all sorts of researches on molecular biology, microbiology, botany, zoology, genetics, bioengineering, ecology, cytology, biochemistry, and biophysics, as well as other issues related to life sciences.
Editorial Board Members
Dr. Stefan Hershberger (USA), Dr. Suiyun Chen (China), Dr. Farzana Perveen (Pakistan), Dr. Francisco Torrens (Spain), Dr. Filipa João (Portugal), Dr. Masahiro Yoshida (Japan), Dr. Reyhan Erdogan (Turkey), Dr. Grzegorz Żurek (Poland), Dr. Ali Izadpanah (Canada), Dr. Barbara Wiewióra (Poland), Dr. Valery Lyubimov (Russia), Dr. Amanda de Moraes Narcizo (Brasil), Dr. Marinus Frederik Willem te Pas (The Netherlands), Dr. Anthony Luke Byrne (Australia), Dr. Xingjun Li (China), Dr. Stefania Staibano (Italy), Dr. Wenle Xia (USA), Hamed Khalilvandi-Behroozyar (Iran).
Manuscripts and correspondence are invited for publication. You can submit your papers via Web Submission, or E-mail to [email protected] or [email protected]. Submission guidelines and Web Submission system are available at http://www.davidpublishing.com.
Editorial Office
9460 TELSTAR AVE SUITE 5, EL MONTE, CA 91731, USA Tel: 1-323-9847526, Fax: 1-323-9847374
E-mail:[email protected], [email protected]
Copyright©2012 by David Publishing Company and individual contributors. All rights reserved. David Publishing Company holds the exclusive copyright of all the contents of this journal. In accordance with the international convention, no part of this journal may be reproduced or transmitted by any media or publishing organs (including various websites) without the written permission of the copyright holder. Otherwise, any conduct would be considered as the violation of the copyright. The contents of this journal are available for any citation. However, all the citations should be clearly indicated with the title of this journal, serial number and the name of the author.
Abstracted / Indexed in
Database of EBSCO, Massachusetts, USA Chemical Abstracts Service (CAS), USA Cambridge Scientific Abstracts (CSA), USA
Chinese Database of CEPS, American Federal Computer Library center (OCLC), USA Ulrich’s Periodicals Directory, USA
Chinese Scientific Journals Database, VIP Corporation, Chongqing, China
Subscription Information
Price (per year): Print $520, Online $360, Print and Online $680.
David Publishing Company
9460 TELSTAR AVE SUITE 5, EL MONTE, CA 91731, USA Tel: 1-323-9847526, Fax: 1-323-9847374
E-mail: [email protected]
David Publishing Company www.davidpublishing.com
DAV ID P UBL ISH IN G
J LS
Journal of Life Sciences
Volume 6, Number 1, January 2012 (Serial Number 45)
Contents
Molecular Biology and Medical Biochemistry
1 Genotypic Assessment by RAPD Markers and Ultrastructural Characteristics of a NaCl-Tolerant
Potato Cell Line
Filipa Queirós, José M. Almeida, Domingos P.F. Almeida and Fernanda Fidalgo
9 The Taxonomic Status of Gymnura bimaculata and G. japonica: Evidence from Mitochondrial
DNA Sequences
Anglv Shen, Chunyan Ma, Yong Ni, Zhaoli Xu and Lingbo Ma
14 Parameters Analysis of Gastric Motility Signals in Time Domain and Frequency Domain
Zhangyong Li, Likun Xu and Zhui Xu
20 Validation of Metformin Hydrochloride in Human Plasma by HPLC-Photo Diode Array (PDA)
for Application of Bioequivalence Study
Yahdiana Harahap, Krisnasari Dianpratami, Mahi Wulandari and Rina Rahmawati
28 Rotation Thromboelastography for Assessment of Hypercoagulation and Thrombosis in Patients
with Cardiovascular Diseases
Antoaneta Dimitrova-Karamfilova, Yuliana Patokova, Tania Solarova, Irina Petrova and Gencho
Natchev
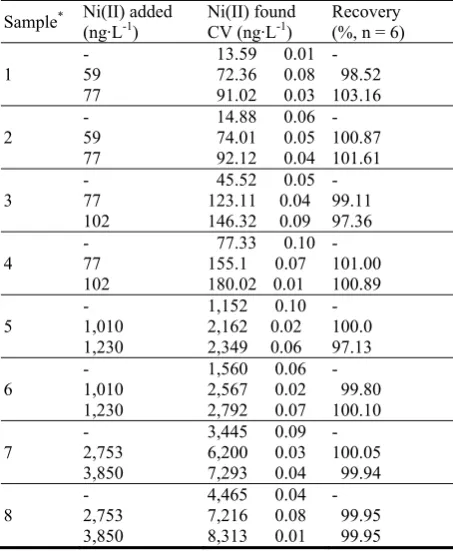
36 New Silver Nanosensor for Nickel Traces. Part II: Urinary Nickel Determination Associated to Smoking Addiction
María Carolina Talio, Marta O. Luconi and Liliana P. Fernández
Physiology
41 Studies on the Antioxidant Potential of Extracts from Unripe Fruit of Carica papaya
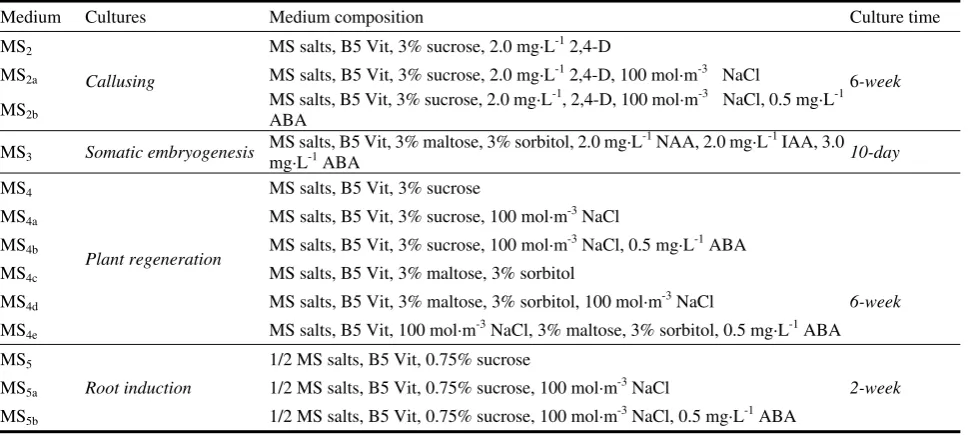
48 Effect of Abscisic Acid on NaCl Stressed Callus Proliferation and Plant Regeneration in Rice
Ikram-ul-Haq, Ghulam Yasin, Mumtaz Hussain and Ali Mohammad Dahri
55 Physiological Response of Hydrilla verticillata (l.f.) Royle Exposed to Cadmium Stress
Sibanarayan Mohapatra and Surjendu Kumar Dey
61 The Potentials of Locally Available Fruits Rich in Iron to Mitigate Iron Deficiency Anemia in
Least Developing Countries (LSD)
Abdulkadir A. Egal and Wilna H. Oldewage-Theron
68 Feeding Habits of the Red Porgy Pagrus pagrus (Linnaeus, 1758) from Benghazi Coasts, Libya
Mohammad El-Mor
74 Nesting Activity and Conservation Status of the Hawksbill Turtle (Eretmochelys imbricata) in
Persian Gulf
Seyyed Mohammad Bagher Nabavi, Ruhollah Zare and Mahdieh Eftekhar Vaghefi
Interdisciplinary Researches
80 Economic Feasibility of Simultaneous Production of Pine Sawlogs and Meat Goats on Small-Sized
Farms in Alabama
Brandi Broughton, James O. Bukenya and Ermson Nyakatawa
91 Constructing a Model of Digestion in a Primary School Using a Theatrical Performance
Maria J. Gil-Quílez, Begoña Martínez-Peña, Milagros De la Gándara, Marta Ambite and Marian
Laborda
99 Creationism and Evolution Views of Brazilian Teachers and Teachers-to-Be
Ana Maria de Andrade Caldeira, Elaine S. Nicolini Nabuco de Araujo and Graça S. Carvalho
110 Research on Behavior of Governing Gene/Epigene Networks as a Problem of Cellular Automata
Identification
Rustem Tchuraev
114 Nymphaeaceae Salisb. and Trapaceae Dumort. Families in the Collection of O.V. Fomina
Botanical Garden
Journal of Life Sciences 6 (2012) 1-8
Genotypic Assessment by RAPD Markers and
Ultrastructural Characteristics of a
NaCl-Tolerant Potato Cell Line
Filipa Queirós1, 2, José M. Almeida1, Domingos P.F. Almeida3, 4 and Fernanda Fidalgo1, 2
1. Biology Department, Faculty of Science, University of Porto, Porto 4169-007, Portugal
2. BioFIG-Center for Biodiversity, Functional and Integrative Genomics, Plant Molecular Biology & Biotechnology Lab, University of Porto, Porto 4169-007, Portugal
3. Faculty of Science, University of Porto, Porto 4169-007, Portugal
4. CBQF, College of Biotechnology, Portuguese Catholic University, Porto 4200-072, Portugal
Received: November 18, 2010 / Accepted: January 17, 2011 / Published: January 30, 2012.
Abstract: Salinity is a serious threat to agricultural production. Potato (Solanum tuberosum) is an important food crop characterised for having low to moderate salinity tolerance. Tissue cultures may be relevant to improve salt tolerance in potato through selection of salt-tolerant cell lines and subsequent regeneration of plants. In this work, the authors used the random amplified polymorphic DNA (RAPD) markers to investigate the occurrence of genetic polymorphism in a potato calli line tolerant to 150 mM NaCl. Out of 40 primers screened, eight generated polymorphic patterns that distinguished salt-tolerant line from the control. Although the macroscopic appearance was similar in both lines, ultrastructural study revealed alterations in salt-grown cells. These showed that plastids less differentiated with a lower number of grana had more and larger starch grains than control cells. In conclusion, RAPD analysis revealed that NaCl-adapted line is a somaclonal variant and the ultrastructural study showed changes essentially at the plastids.
Key words: Salt tolerance, potato, callus tissue, polymorphism, molecular marker, RAPD markers, ultrastructure.
1. Introduction
Soil salinity is one of the major environmental stresses causing a significant loss of productivity in world agriculture, especially in irrigated lands [1]. It has been claimed as a considerable threat to food provisions of world population resulting from limited growth and low harvestable yield of major crop species [2, 3]. Worldwide, more than 800 million hectares of land are estimated to be salt affected [4]. The imperative to develop plants capable of growing in saline agricultural systems is growing. The world’s population is expected to increase to more than 9
Corresponding author: Fernanda Fidalgo, assistant
professor, research field: biochemistry and plant physiology. E-mail: [email protected].
billion by the year 2050 [5], which will increase the pressure for agricultural production from saline soils. Developing salt-tolerant crops has been a highly desirable scientific goal but has had little success to date [6]. Potato (Solanum tuberosum L.) is the most important non-cereal food crop and it has a low to moderate tolerance to salinity. Attempts to enhance the salt tolerance in potato and other crops through conventional breeding methods have had limited success, warranting the use of biotechnological approaches as a rapid means for the production of salt-tolerant genotypes. Appropriate strategies may include the use of tissue culture techniques through in
Genotypic Assessment by RAPD Markers and Ultrastructural Characteristics of a NaCl-Tolerant Potato Cell Line
2
tolerance [7, 8]. Besides those cell lines are a useful tool to study the mechanisms of plant salt tolerance at the cell level.
In this sense, we have previously selected a potato calli line adapted to grow on 150 mM NaCl [9] and changes in several physiological and biochemical parameters were induced by salinity, with some being involved in salt tolerance [10]. Although salt-tolerant line displayed a macroscopic appearance similar to the control, it is known that plant cells adapted to salinity undergo also were ultrastructural modifications, which could contribute for their ability to grow in saline environment [11]. Thus, in this work we report that the ultrastructural changes induced by salinity to find out those that may have an adaptive value for potato callus tissue. Furthermore, the possibility of the occurrence of somaclonal variation, a common phenomenon in plant tissue cultures [12], which can be enhanced when tissue cultures are exposed to the stress-inducing factors, led us to analyse if the salt tolerance displayed by the cell line that is based on physiological adaptation or genetic variation. Several PCR-based technologies have been developed to assay genetic polymorphism at the DNA level. Among these, random amplified polymorphic DNA (RAPD) markers have proven to be efficient in detecting genetic variation in various plants [7, 13-15]. Therefore, in this work, RAPD technique was applied to detect the occurrence of genetic polymorphism in potato calli in response to salt condition, and thereby the DNA-based markers were determined.
2. Materials and Methods
2.1 Callus Culture
The procedures for induction and subculture of callus tissue, and for the selection of a 150 mM NaCl-tolerant cell line have previously been described in detail [9]. Briefly, potato callus tissue (Solanum tuberosum L. cv. Désirée) was induced from young leaves. After induction, the callus tissue was transferred to Lam medium [16] supplemented with
0.5 mg·L-1 benzylaminopurine and 2 mg·L-1 2,4-dichlorophenoxyacetic acid (2,4-D) (multiplication medium), on which it was cultivated for 28 days. Calli grown for six successive subcultures (of 28 days each) in the multiplication medium were designed as non-adapted calli line (control). The selection of 150 mM NaCl-tolerant calli was carried out by progressively growing non-adapted callus tissue on media with increased concentrations of NaCl. Callus tissue was firstly subcultured on medium containing 50 mM NaCl for 4 weeks, and then on medium supplemented with 100 mM NaCl for the same period, before being transferred to 150 mM NaCl. This NaCl-tolerant cell line was obtained after four successive subcultures on medium supplemented with 150 mM NaCl.
2.2 DNA Extraction and RAPD Analysis
Total DNA from frozen calli (100 mg) samples was extracted using the AxyPrep Multisource Genomic DNA Miniprep Kit (Axygen Biosciences, USA) according to the manufacturer’s instructions. DNA concentration of each sample was quantified by a biophotometer and DNA quality was checked in 0.8% agarose gel.
For RAPD assays, the amplification conditions were optimized by varying concentrations of template DNA, primer, and Mg2+ ion. A total of forty arbitrary decamer primers (Kits OPB and OPE) obtained from Operon Technology (Alameda, USA) were used for polymerase chain reaction (PCR) amplification and identification of polymorphic markers. The PCR reaction mixture, in a final volume of 25 µL, consisted of 1× PCR buffer (10 mM Tris-HCl, pH 8.4; 50 mM KCl), 3 mM MgCl2, 200 µM of each dNTPs, 1.5 units
Genotypic Assessment by RAPD Markers and Ultrastructural Characteristics of a NaCl-Tolerant Potato Cell Line
3
at 72 ºC for 10 min. After amplification, PCR products (15 µL) were mixed with 2.5 µL of 6× loading dye solution (0.25% bromophenol blue, 0.25% xylene cyanol and 40% sucrose, w/v) and separated in 1.8% agarose gels, in 1× TAE buffer (40 mM Trizma-base, 1 mM EDTA and 0.115% acetic acid glacial) at a constant voltage of 70 V. The amplified DNA bands were stained with ethidium bromide and visualized under a UV transilluminator. A 1 kbp DNA ladder was used as a molecular standard. Gels were analysed with the Quantity One software (Bio-Rad) to detect and estimate molecular weight of the bands.
Primers that gave clear and consistent polymorphic amplification products were tested three times with DNA samples of control and salt-tolerant calli extracted from independent experiments, using similar reaction conditions to assure the reproducibility of RAPD patterns. Polymorphism in RAPD profiles included disappearance of a normal band and/or appearance of a new band in comparison to control, and only polymorphic bands amplified in three replicates were scored.
2.3 Electron Microscopy and Morphometric Evaluation
Callus tissue was fixed in 2.5% (v/v) glutaraldehyde followed by 2% (w/v) osmium tetroxide, using Na-piperazine-N,N’-bis (2-ethanesulfonic acid) (Na-PIPES) buffer (pH 7.2), dehydrated in acetone and embedded in Epon 812. Ultra thin sections were cut and contrasted with uranyl acetate and lead citrate, and viewed using a Zeiss EM C10 transmission electron microscope (Zeiss, Göttingen, Germany).
Quantification of cellular structural changes induced by the salt was performed. To assure random pictures for morphometric studies, five blocks were chosen from control and salt-tolerant calli and 250 micrographs were taken at random for each situation and magnified 12,000×. Morphometric determinations of fractional volume (Vv) of starch/plastid were performed by measuring the area of the starch and plastids using the Image J software from NIH Image.
The same micrographs were used for quantification of average number of starch grains.
3. Results and Discussion
3.1 RAPD Analysis
In order to analyse if the salt-grown callus line is physiologically adapted or whether it is a variant line, a comparison of RAPD patterns of control and salt-tolerant calli was carried out. RAPD assay detects nucleotide sequence polymorphisms in a DNA amplification-based assay using only a single short primer of arbitrary nucleotide sequence. The major advantage of this assay is that there is no requirement for DNA sequence information, besides its simplicity and cost-effectiveness [17, 18]. A total of forty arbitrary primers were used in this research to amplify the DNA extracted from the two calli lines, of which eight primers generated reproducible polymorphic banding patterns. The analysis of RAPD profiles of both calli lines obtained with these primers revealed that sixteen bands ranging from 482-2,211 bp in size were polymorphic (Table 1). Polymorphisms were due to the loss and/or appearance of new amplified fragments in the tolerant line compared with control. Thus, eleven bands were absent and the remaining five were present in calli grown on the presence of 150 mM NaCl (Table 1). Among the primers screened, none generated polymorphic bands that were unique to the salt-tolerant calli, having OPB series resulted in the greatest number of RAPD bands.
Genotypic Assessment by RAPD Markers and Ultrastructural Characteristics of a NaCl-Tolerant Potato Cell Line
4
Table 1 RAPD polymorphic bands generated by eight primers from Operon series and separated by agarose gel in control and salt-tolerant calli.
Primer code Sequence 5’ to 3’ Molecular weight (bp) Control calli Salt-tolerant calli
OPB-01 GTTTCGCTCC 1,980
OPB-04 GGACTGGAGT 887 850 820
OPB-09 TGGGGGACTC 1,998
580 300
OPB-18 CCACAGCAGT 1,095
482
OPE-02 GGTGCGGGAA 566
OPE-06 AAGACCCCTC 1,296 1,242 547
OPE-14 TGCGGCTGAG 1,804
OPE-19 ACGGCGTATG 2,211
1,296
: indicates appearance of a new band; : disappearance of a normal band.
Fig. 1 RAPD profiles of control (C) and salt-tolerant calli (ST) of S. tuberosum obtained with primers from OPB and OPE
series (Operon Technology Inc.).
Each sample was analyzed in duplicate to assure the reproducibility between the profiles. The polymorphic bands that were selected as RAPD markers which discriminated the two calli lines are marked in each of the patterns generated by the primers indicated on the top of the gels; the arrowheads point to bands that are present in control but absent in salt-tolerant line, while arrows indicate the appearance of extra bands in tolerant line that are missing in control pattern. The brace represents an area where are detected differences in banding pattern between the two calli lines. In each case a 1 kbp DNA ladder is included as a molecular weight marker (M).
These polymorphic bands and the remaining generated by the primers listed in Table 1 (data not shown) were selected as RAPD markers since they differentiated genotypically the salt-tolerant line from the control.
These results confirmed that RAPD analysis using
Genotypic Assessment by RAPD Markers and Ultrastructural Characteristics of a NaCl-Tolerant Potato Cell Line
5
line and only one polymorphic band generated by one primer showed that these plants were somaclonal variants [7]. Beyond the identification of somaclonal variants in micropropagated plants, RAPD approach has been successfully used to characterize the genetic diversity in a variety of plant species as well as to differentiate cultivars [19, 20]. Based on RAPD markers, genetic distances can be estimated to establish phylogenetic relationships among the species, as was demonstrated within the genus Solanum [21] or Vigna
[22]. According to various authors, the analysis of genetic differences and discrimination of genetic relationships between taxa would be of great significance for designing breeding strategies [22, 23]. In fact, our potato cell line grown under salinity is a somaclonal variant that can be used to regenerate plants with improved salt tolerance, which could be an alternative genetic resource for potato breeding programmes.
3.2 Ultrastructural Analysis
The ultrastructure of calli grown in 150 mM NaCl was also investigated to gain a better understanding of the response of potato callus tissue to high salinity. The ultrastructural changes induced by salinity provide useful information as to the underlying mechanism of salt tolerance [11]. However, there are few reports on the effects of salinity on cell ultrastructure for tissues
cultured in vitro. Electron microscopic analyses of potato line tolerant to NaCl showed that salinity did not affect the structural integrity of the cells and did not cause disruption of cell organelles, which is consistent with the macroscopic aspect of callus tissue grown under saline condition (Fig. 2). Besides no differences was observed in the plasma membrane, when endoplasmic reticulum and mitochondria of tolerant cells compared with control (Figs. 3A and 3B). However, some changes were detected in plastids from salt-tolerant cell line (Fig. 4). Round-shaped plastids were more common in tolerant cells, which appeared less differentiated than those in the control cells, displaying a reduced membrane system and a lower number of grana (Figs. 4A-4D). The fact that plastids in control tissue have appeared with a more developed lamellar system, led us to admit that the salt presence in culture medium restricted the differentiation process. In fact, under unfavourable growth conditions, the formation
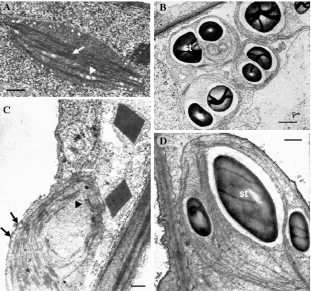
Fig. 2 Aspect of control callus tissue (A), and salt-tolerant callus cultivated in medium with 150 mM NaCl (B).
Genotypic Assessment by RAPD Markers and Ultrastructural Characteristics of a NaCl-Tolerant Potato Cell Line
6
Fig. 4 Ultrastructural aspects of plastids from control and salt-tolerant cells. (A) Plastid from control callus tissue showing developed grana (arrow) with some plastoglobuli associated (arrowhead) and the presence of vesicles at the periphery of the organelle (bar: 0.5 µm). (B) Aspect of the plastids from salt-tolerant tissue with a spherical shape, showing a reduced lamellar system and a high number of starch grains (bar: 1 µm). (C) Region of control cell displaying a plastid devoided of starch but with grana well organized (arrowhead) and various vesicles arranged along inside of the plastid envelope (arrows) (bar: 0.5 µm). (D) Detail of plastid from salt-tolerant tissue showing the lower level of organization than control cells but with a well preserved lamellar system and a huge starch grain (bar: 0.5 µm).
of grana is prevented because of inhibition of protein synthesis, as well as the formation of plastid ribosomes and chlorophyll accumulation [24, 25]. On the other hand, the vesicles present in the stroma of the plastids of the control cells (Figs. 4A-4C) were absent in plastids from tolerant cells (Figs. 4B-4D); these structures seem to be related with lipid transport within the organelle, participating in thylakoid formation and, therefore, be involved in the differentiation of the plastids [26].
Additionally, the plastids from NaCl-tolerant cells showed a less compact stroma with large starch grains when compared to control material. As illustrated in Fig. 4D, the stroma region of the organelle was partially occupied by starch grains, resembling the morphology of amylochloroplasts. Electron microscopy observation of numerous plastid profiles
Genotypic Assessment by RAPD Markers and Ultrastructural Characteristics of a NaCl-Tolerant Potato Cell Line
7
Table 2 Fractional volume (Vv) of the plastids and of the starch, and number of starch grains per plastid in control and salt-tolerant callus tissue.
Culture conditions Vv plastid (m2) Vv starch/plastid Number of starch grains/plastid
Control calli 12.65 ± 0.22a 0.12 ± 0.01a 1.02 ± 0.16a
Salt-tolerant calli 11.19 ± 0.95a 0.25 ± 0.02b 2.41 ± 0.23b
The data are mean values ± standard error. Values in the same column with different superscript letters are significantly different at 5% level according to Student’s t-test.
observed in NaCl-acclimated Citrus cell line and in salt-tolerant wheat cultivars [27, 28], in contrast with NaCl-stressed potato plants where starch content decreased and the thylakoid membranes swelled [29]. As salinity has both ionic and osmotic effects, probably the accumulation of starch in our tolerant line may be related with the osmotic adjustment process and, consequently, contribute to the adaptation of cells to salinity. The acclimation of plant cells grown under salinity requires the production and accumulation of osmotically active solutes of low molecular mass that lead to the osmotic adjustment of the cell, but also the accumulation of the sugar reserve in the form of starch [30].
4. Conclusions
Data of the present study confirm the potential of RAPD technology as a reliable and sensitive screening method to discriminate genotypically the salt-tolerant line from the control. DNA fingerprinting by RAPDs showed that our potato cell line grown under salinity is a somaclonal variant, which paves the way for the regeneration of potato plants with improved salt tolerance. Based on ultrastructural study we conclude that the major alterations caused by salinity occurred essentially at the plastids level, which consisted in a less developed membranous system associated with an increase of starch amount. The accumulation of starch observed in salt-tolerant cells might be related with the osmotic adjustment process.
Acknowledgments
The authors acknowledge the technical assistance of Rui Fernandes (Instituto de Biologia Molecular e Celular, Porto, Portugal) in transmission electron
microscopy and Filipa Queirós acknowledges the support by grant SFRH/BD/18037/2004 from Fundação para a Ciência e Tecnologia (Portugal).
References
[1] T. Horie, J.I. Schroeder, Sodium transporters in plants: Diverse genes and physiological functions, Plant Physiology 136 (2004) 2457-2462.
[2] M. Tester, R. Davenport, Na+ tolerance and Na+ transport in higher plants, Annals of Botany 91 (2003) 503-527. [3] S. Sengupta, A.L. Majumder, Porteresia coarctata (Roxb.)
Tateoka, a wild rice: A potential model for studying salt-stress biology in rice, Plant, Cell and Environment 33 (2010) 526-542.
[4] N.L. Teakle, S.D. Tyerman, Mechanisms of Cl- transport contributing to salt tolerance, Plant, Cell and Environment 33 (2010) 566-589.
[5] E.G. Barrett-Lennard, T.L. Setter, Developing saline agriculture: Moving from traits and genes to systems, Functional Plant Biology 37 (2010) iii-iv.
[6] S. Schubert, A. Neubert, A. Schierholt, A. Sümer, C. Zörb, Development of salt-resistant maize hybrids: The combination of physiological strategies using conventional breeding methods, Plant Science 177 (2009) 196-202.
[7] S.J. Ochatt, P.L. Marconi, S. Radice, P.A. Arnozis, O.H. Caso, In vitro recurrent selection of potato: Production and characterization of salt tolerant cell lines and plants, Plant Cell, Tissue and Organ Culture 55 (1999) 1-8.
[8] Y. Miki, M. Hashiba, S. Hisajima, Establishment of salt stress tolerant rice plants through step up NaCl treatment
in vitro, Biologia Plantarum 44 (2001) 391-395.
[9] F. Queirós, F. Fidalgo, I. Santos, R. Salema, In vitro
selection of salt tolerant cell lines in Solanum tuberosum
L., Biologia Plantarum 51 (2007) 728-734.
[10] F. Queirós, N. Fontes, P. Silva, D. Almeida, M. Maeshima, H. Gerós, et al., Activity of tonoplast proton pumps and Na+/H+ exchange in potato cell cultures is modulated by salt, Journal of Experimental Botany 60 (2009) 1363-1374.
Genotypic Assessment by RAPD Markers and Ultrastructural Characteristics of a NaCl-Tolerant Potato Cell Line
8
Springer, The Netherlands, 2006.
[12] P.J. Larkin, W.R. Scowcroft, Somaclonal variation–A novel source of variability from cell cultures for plant improvement, Theoretical and Applied Genetics 60 (1981) 197-214.
[13] N.T. Nguyen, R.E.A. Moghaieb, H. Saneoka, K. Fujita, RAPD markers associated with salt tolerance in Acacia auriculiformis and Acacia mangium, Plant Science 167 (2004) 797-805.
[14] L. Venkatachalam, R.V. Sreedhar, N. Bhagyalakshmi, Genetic analyses of micropropagated and regenerated plantlets of banana as assessed by RAPD and ISSR markers, In Vitro Cellular & Developmental Biology-Plant 43 (2007) 267-274.
[15] D. Chakrabarty, S.K. Datta, Application of RAPD markers for characterization of γ-ray-induced rose mutants and assessment of genetic diversity, Plant Biotechnology Reports 4 (2010) 237-242.
[16] S.L. Lam, Plantlet formation from potato tuber discs in vitro, American Potato Journal 54 (1977) 465-468. [17] S.V. Tingey, J.P. del Tufo, Genetic analysis with random
amplified polymorphic DNA markers, Plant Physiology 101 (1993) 349-352.
[18] J.G. Williams, M.K. Hanafey, J.A. Rafalski, S.V. Tingey, Genetic analysis using random amplified polymorphic DNA markers, Methods in Enzymology 218 (1993) 704-740.
[19] S. Betal, P. Roy Chowdhury, S. Kundu, S. Sen Raychaudhuri, Estimation of genetic variability of Vigna radiata cultivars by RAPD analysis, Biologia Plantarum 48 (2004) 205-209.
[20] E. Schiliro, S. Predieri, A. Bertaccini, Use of random amplified polymorphic DNA analysis to detect genetic variation in Pyrus species, Plant Molecular Biology Reporter 19 (2001) 271a-h.
[21] A.K. Singh, M. Singh, A.K. Singh, R. Singh, S. Kumar, G. Kalloo, Genetic diversity within the genus Solanum
(Solanaceae) as revealed by RAPD markers, Current Science 90 (2006) 711-716.
[22] H.K. Dikshit, T. Jhang, N.K. Singh, K.R. Koundal, K.C. Bansal, N. Chandra, et al., Genetic differentiation of Vigna
species by RAPD, URP and SSR markers, Biologia Plantarum 51 (2007) 451-457.
[23] M. Santalla, J.B. Power, M.R. Davey, Genetic diversity in mung bean germplasm revealed by RAPD markers, Plant Breeding 117 (1998) 473-478.
[24] A.F. Abdelkader, H. Aronsson, K. Solymosi, B. Böddi, C. Sundqvist, High salt stress induces swollen prothylakoids in dark-grown wheat and alters both prolamellar body transformation and reformation after irradiation, Journal of Experimental Botany 58 (2007) 2553-2564.
[25] J. Feierabend, U. Schrader-Reichhardt, Biochemical differentiation of plastids and other organelles in rye leaves with a high-temperature-induced deficiency of plastid ribosomes, Planta 129 (1976) 133-145.
[26] M.X. Andersson, A.S. Sandelius, A chloroplast-localized vesicular transport system: A bio-informatics approach, BMC Genomics 5 (2004) 1-8.
[27] A.L. Ferreira, M.E. Lima-Costa, Growth and ultrastructural characteristics of Citrus cells grown in medium containing NaCl, Biologia Plantarum 52 (2008) 129-132.
[28] S. Salama, S. Trivedi, M. Busheva, A.A. Arafa, G. Garab, L. Erdei, Effects of NaCl salinity on growth, cation accumulation, chloroplast structure and function in wheat cultivars differing in salt tolerance, Journal of Plant Physiology 144 (1994) 241-247.
[29] F. Fidalgo, A. Santos, I. Santos, R. Salema, Effects of long-term salt stress on antioxidant defence systems, leaf water relations and chloroplast ultrastructure of potato plants, Annals of Applied Biology 145 (2004) 185-192. [30] T.H. Chen, N. Murata, Enhancement of tolerance of
Journal of Life Sciences 6 (2012) 9-13
The Taxonomic Status of
Gymnura bimaculata
and
G.
japonica
: Evidence from Mitochondrial DNA Sequences
Anglv Shen, Chunyan Ma, Yong Ni, Zhaoli Xu and Lingbo Ma
East China Sea Fisheries Research Institute, Chinese Academy of Fishery Sciences, Shanghai 200090, China
Received: July 22, 2011 / Accepted: August 18, 2011 / Published: January 30, 2012.
Abstract: Japanese butterfly ray Gymnura japonica from twinspot butterfly ray G. bimaculata based on a pair of white spots behind eyes or not, which was not reliable. To clarify the taxonomic status of G. japonica and G. bimaculata, the nucleotide variation between the two butterfly rays was examined using mitochondrial DNA sequence comparisons. Approximately 585 bp of 16S ribosomal RNA (rRNA) and 1,128 bp cytochrome b (cyt b) genes were sequenced from representatives of two butterfly rays species in East China Sea. The results showed that there were the same sequences of 16S rRNA gene between two butterfly rays; six sites were variable among two butterfly rays of cyt b genes, the proportion of polymorphic loci was 0.53%, and two haplotypes were defined which genetic distance was 0.5%. Combined with the morphological character and the analysis of mtDNA sequence indicated that twinspot butterfly ray G. bimaculata was a synonym of Japanese butterfly ray G. japonica.
Key words: 16S rRNA, cyt b, morphological character, taxonomic status, butterfly ray.
1. Introduction
The Gymnura genus (van Hasselt, 1823) (order Myliobatiformes, family Gymnuridae) includes eleven species, of which three are found in China, Gymnura bimaculata (Norman, 1925), G. japonica (Temminck et Schlegel, 1850) and G. poecilura (Shaw, 1804) and only two are found in the East China Sea (G.
bimaculata and G. japonica) [1-3]. However, only few studies, using mainly morphological and anatomical characteristics, have explained the taxonomic status of these fishes [1-5]. Chu and Meng (2001) relied on the presence or absence of a pair white spots behind the eyes as a primary diagnostic marker to distinguish between the Japanese butterfly ray (G. japonica) and the twinspot butterfly ray (G. bimaculata) [3]. However, intraspecific variation and sexual dimorphism may complicate taxonomic designations, particularly among species with similar
Corresponding author: Lingbo Ma, Ph.D., professor,
research field: molecular biology. E-mail: [email protected].
morphology [6]. Isouchi had reported that the butterfly ray species, G. bimaculata is a junior synonym of G. japonica [4], but lacked molecular evidence. It is necessary to use new technology at the molecular level, in order to understand the relationships between similar species; some studies have presented data on molecular variation among genera in this family [6].
In this study, DNA sequence comparisons of two mitochondrial genes, cyt b and 16S rRNA, were used to clarify the phylogenetic relationship between the Japanese butterfly ray G. japonica, and the twinspot butterfly ray G. bimaculata.
2. Materials and Methods
2.1 Morphometric Analysis
One specimen of G. japonica and one specimen of
G. bimaculata were collected from the Fujian
The Taxonomic Status of Gymnura bimaculata and G. japonica: Evidence from Mitochondrial DNA Sequences
10
and samples of muscle were taken from each individual. Morphology measurements followed the protocol of Chu and Meng [3].
2.2 Molecular Analysis
Total genomic DNA was extracted from muscle tissue using standard phenol/chloroform techniques [7]. Amplification reactions of the mitochondrial cyt b and 16S rRNA genes followed the protocol of Cheng et al. [8]. Primer sequences used for cyt b gene amplification were L14724 and H15915 [9], and primer sequences for 16S rRNA gene amplification were 16SAR and 16SBR [10]. These four primers were used for sequencing the corresponding gene segments. PCR products were purified in 1.5-2.0% agarose (Biowest) and sequenced using BigDye Deoxy Terminator Cycle Sequencing Kit (Applied Biosystems) with an automated DNA sequencer (Applied Biosystems 3130) following the manufacturer’s instructions.
2.3 Data Analysis
Genetic distance was estimated by calculating pairwise distances between populations and taxa using the Kimura two-parameter model (Kimura 1980) in MEGA version 3.1 [11].
3. Results
3.1 Morphometric Analysis
As shown in Tables 1 and 2, Fig. 1a, the disc of the Japanese butterfly ray was wide; the disc width was 2.16 times larger than the disc length. The snout of the Japanese butterfly ray was short (35 mm), the snout length was 0.19 times the disc length, and shorter than interorbital width (36 mm). The eye diameter of the Japanese butterfly ray was shorter than the spiracle length. The tail length of Japanese butterfly ray was 0.59 times the disc length. One spine and eight black bands were observed on the tail. Proximal to the spine, the bands were merged, and there were seven bands on a ring distal from the spine (Fig. 2). The disc of the
twinspot butterfly ray was also wide (Tables 1 and 2, Fig. 1b); the disc width was 2.21 times larger than the disc length. The snout length of the twinspot butterfly ray was 0.19 times the disc length, and shorter than the interorbital width. The tail length of twinspot butterfly ray was 0.59 times the disc length. One spine and seven black bands were observed on the tail. The bands proximal to the spine were merged, and the two bands distal from spine were observed on a ring (Fig. 3b). The other characteristics of the twinspot butterfly ray were similar to those of the Japanese butterfly ray (Tables 1 and 2).
3.2 Molecular Analysis
The 16S rRNA gene sequences were corrected and aligned, and 586 bp consensus sequences were obtained. The sequences of 16S rRNA gene of two butterfly rays were the same, and they had a shared
Table 1 Anatomical measurements of the Japanese butterfly ray and the twinspot butterfly ray.
Japanese
Table 2 Ratios of anatomical feature measurements of the Japanese butterfly ray and the twinspot butterfly ray.
Japanese butterfly ray
The Taxonomic Status of Gymnura bimaculata and G. japonica: Evidence from Mitochondrial DNA Sequences
11
Fig. 1 Images of the Japanese butterfly ray (a), the twinspot butterfly ray (b), and the butterfly ray (c).
Fig. 2 Images of the dorsal (a) and ventral (b) sides of the Japanese butterfly ray.
Fig. 3 Images of the dorsal (a) and ventral (b) sides of the twinspot butterfly ray.
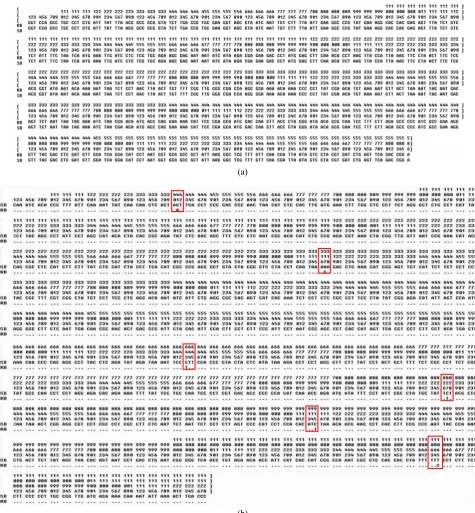
haplotype (Fig. 4a). The average nucleotide frequencies of thymine (T), cytosine (C), adenine (A), and guanine (G) were 26.5%, 22.1%, 31.6% and 19.8%, respectively. The AT content (58.1%) was higher than CG content (41.9%). The results of sequence comparisons showed that cyt b fragment is 1,128 bp in length, including six sites that were variable among the two butterfly rays (Fig. 4b). The proportion of polymorphic loci was 0.53%, and two haplotypes (SB, RB) were defined. cyt b sequences included no insertions or deletions (indels). The average nucleotide frequencies were: 27.6% T, 34.2% C, 26.1% A, and 12.1% G. The AT content (53.7%) was higher than CG content (46.3%). The genetic distance between the haplotypes was 0.5%.
4. Discussion
The Taxonomic Status of Gymnura bimaculata and G. japonica: Evidence from Mitochondrial DNA Sequences
12
(a)
(b)
Fig. 4 Nucleic acid sequences obtained and aligned from the two butterfly rays for 16S rRNA (a) and cyt b (b) genes.
only one spot after eyes and the size of spot was small (Fig. 1c). Isouchi reported there were a pair white spots on disc or only one spot on disc, and even no spot on disc on the two butterfly rays [4]. Therefore, the presence or absence of a pair white spots behind the eyes could not serve as the primary diagnostic marker
The Taxonomic Status of Gymnura bimaculata and G. japonica: Evidence from Mitochondrial DNA Sequences
13
was a male, 2-3 bands were taken on a ring in the tail (Fig. 3), it was the same phenomena that could be observed from Fig. 2c. According to these characters, the difference of the two butterfly rays may be due to the sexual dimorphism. Sexual dimorphism was widely in butterfly rays [6], which had been supported the results in this study.
Different mitochondrial genes have different evolutionary rates, their analytical capabilities are also different, and the same gene in different species may have different analytical abilities. The 16S rRNA gene is a relatively conserved mitochondrial gene marker with a low evolutionary rate compared to cyt b [12]. Thus, 16S rRNA should exhibit less genetic variation between closely related species than cyt b [8]. The evolutionary rate of the cyt b gene is greater than that of 16S rRNA, so it is a very useful molecular marker for understanding the phylogenetic relationships at the species-level and at the higher order level [6, 7, 13-16]. In this study, the mutation rate of 16S rRNA and cyt b
fragment was 0% and 0.53%, respectively, which showed a very close genetic relationship between the two butterfly rays and confirmed that the 16S rRNA was a more conserved gene.
In conclusion, the morphological characteristics and the analysis of mtDNA sequences provide evidence that the twinspot butterfly ray, G. bimaculata, is a junior synonym of Japanese butterfly ray, G. japonica.
Acknowledgments
The authors thank J. Zhou, M.B. Luo, J.J. Chen, S.H. Liu, Y.C. Bai, Y.M. Bi, H.J. Zhang, et al., for assistance with sample collection, and are grateful to the freshmen who worked on this project. This work was supported by the Special Research Fund for the National Non-Profit Institutes (East China Sea Fisheries Research Institute, No. 2008M04).
References
[1] Y.T. Chu, Fishes of the South China Sea, Science Press, Beijing, China, 1962.
[2] Y.T. Chu, C.L. Zhang, Q.T. Cheng, Fishes of the East
China Sea, Science Press, Beijing, China, 1963.
[3] Y.T. Chu, Q.W. Meng, Fauna Sinica, Cuclostomata and Chondrichthyes, Science Press, Beijing, China, 2001. [4] T. Isouchi, Butterfly ray Gymnura bimaculata, a junior
synonym of G. japonica, Jpn. J. Ichthyol. 23 (1977) 242-244.
[5] Y.T. Chu, Q.W. Meng, A Study of the Lateral-Line Canals System and That of Lorenzini Ampullae and Tubules of Elasmobranchiate Fishes of China, Shanghai Scientific and Technical Publishers, Shanghai, China, 1980. [6] W.D. Smith, J.J. Bizzarro, V.P. Richards, J. Nielsen, F.
Márquez-Farías, M.S. Shivji, Morphometric convergence and molecular divergence: The taxonomic status and evolutionary history of Gymnura crebripunctata and
Gymnura marmorata in the eastern Pacific Ocean, J. Fish. Biol. 75 (2009) 761-783.
[7] C.Y. Ma, Q.Q. Cheng, Q.Y. Zhang, P. Zhuang, Y.L. Zhao, Genetic variation of Coilia ectenes (Clupeiformes: Engraulidae) revealed by the complete cytochrome b sequences of mitochondrial DNA, J. Exp. Mar. Biol. Ecol. 385 (2010) 14-19.
[8] Q.Q. Cheng, C.Y. Ma, H.P. Cheng, Q.Y. Zhang, Mitochondrial DNA diversity of Coilia mystus
(Clupeiformes: Engraulidae) in three Chinese estuaries, Environ. Biol. Fish. 83 (2008) 277-282.
[9] W.H. Xiao, Y.P. Zhang, H.Z. Liu, Molecular systematics of Xenocyprinae (Teleostei: Cyprinidae): Taxonomy, biogeography, and coevolution of a special group restricted in East Asia, Mol. Phylogenet. Evol. 18 (2001) 163-173.
[10] S.R. Palumbi, Nucleic acids II: The polymerase chain reaction, in: D.M. Hillis, C. Moritz, B.K. Mable (Eds.), Molecular Systematics, 2nd ed., Sinauer Associates, Sunderland MA, 1996, pp. 205-247.
[11] S. Kumar, K. Tamura, M. Nei, MEGA 3: Integrated software for molecular evolutionary genetics analysis and sequence alignment, Brief. Bioinform. 5 (2004) 150-163. [12] A. Meyer, Evolution of mitochondrial DNA of fishes, in:
P.W. Hochachka, P. Mommsen (Eds.),Molecular Biology Frontiers, Biochemistry and Molecular Biology of Fishes, Elsevier Press, Amsterdam, 1993, pp. 1-38.
[13] J. Briolay, N. Galtier, R.M. Brito, Y. Bouvet, Molecular phylogeny of cyprinidae inferred from cytochrome b DNA sequences, Mol. Phylogenet. Evol. 9 (1998) 100-108. [14] A.P. Apostolidisa, Z. Mamurisb, C. Triantaphyllidis,
Phylogenetic relationships among four species of Mullidae (Perciformes) inferred from DNA sequences of mitochondrial cytochrome b and 16S rRNA genes, Biochem. Syst. Ecol. 29 (2001) 901-909.
[15] L. Zhao, J. Zhang, Z.J. Liu, S.M. Funk, F.W. Wei, M.Q. Xu, et al., Complex population genetic and demographic history of the Salangid, Neosalanx taihuensis, based on cytochrome b sequences, BMC Evol. Biol. 8 (2008) 201-228.
Journal of Life Sciences 6 (2012) 14-19
Parameters Analysis of Gastric Motility Signals in Time
Domain and Frequency Domain
Zhangyong Li, Likun Xu and Zhui Xu
Biomedical Engineering Research Centre, Chongqing University of Posts and Telecommunications, Chongqing 404100, China
Received: June 13, 2011 / Accepted: July 22, 2011 / Published: January 30, 2012.
Abstract: In order to assess gastric motility, a new noninvasive method was addressed. Firstly, bio-impedance and stomach electric signals were recorded from the healthy control group and the pathologic stomach group. Wavelet transform was used to remove the influence of the heart activity signals. By analyzing and processing the two signals of the time domain and frequency domain, we get the corresponding parameters of the two groups. According to all the parameters, several verification tests have been carried out, from the result of the statistics, we can find that in both time and frequency domains, impedance signal and synchronize EGG (electrogastrogram) have some similar features. However synchronize EGG cannot be totally instead by gastric motility, especially in morbid state, EGG is not correspondence to impedance signal. The gastric contraction or gastric emptying is a complex procedure including electrical and mechanical activity. Electrical impedance (EIP) and the synchronous EGG should be analyzed together. In conclusion, the parameters have the value to evaluate gastric motility.
Key words: Gastric motility, signals, wavelet transform, time domain, frequency domain.
1. Introduction
Motility (or contractions) is one of the most critical physiological functions of the human gut. Without coordinated motility, digestion and absorption of dietary nutrients could not take place [1, 2]. Impairment in gastric motility results in delayed emptying of the stomach and leads to symptoms of nausea, vomiting, abdominal pain or discomfort, and so on [3, 4].
EGG (electrogastrogram) is a non-invasive and convenience method used for the assessment of gastric motility [5]. Unfortunately, it only reflects frequency of myoelectrical activity and falls to provide enough information about gastric mechanical movement. Other methods such as radionucleide scintigraphy, intracavitary pressure measurement, barostat checking, gastroscopy, etc., fail to deliver a cost effective, simple to use and repeated use. The assessment of gastric
Corresponding author: Zhangyong Li, Ph.D., professor,
research field: medical signal processing. E-mail: [email protected].
motility is still a challenge in the biomedical engineering and different ways will be explored [6].
Bioelectric impedance can be considered as a powerful tool in diagnosis and medical research. Main advantages of using bioelectric impedance are its noninvasive nature, low cost and ease of operation. There are many applications using bio-impedance signals for different pathological conditions, but its use in assessment of gastric motility need to be explored in detail [7].
Parameters Analysis of Gastric Motility Signals in Time Domain and Frequency Domain
16
transmission, gastric emptying and the influences of them, it is necessary to extract gastric motility information of both electrical and mechanical activity [8].
The bio-impedance method is a noninvasive, high sensitive technique to obtain the electrical feature information corresponding to the gastric motility. Stain et al. used bio-impedance technique to detect body composition after gastric bypass and biliopancreatic diversion. Pereira et al. examined the impact of important weight loss on insulin inhibition of its own secretion during experimentally induced hyperinsulinemia under bariatric surgery. Murphy compared the effects of tramadol and morphine on gastric emptying in man [9].
The fundamental frequency of the gastric impedance signal is about 0.05 Hz. The frequency may have sudden changes over time, especially in abnormal situation. When healthy control group (CG) and pathologic stomach group (PG) were used to study the spectrum of gastric electrical impedance, the fluctuations of the curve were markedly different between them and the frequency of PG changes more obviously than CG over time. The frequency component was extracted by means of wavelet transform. We have reported our experiments for gastric emptying time curve with drinking pure water elsewhere. Our present study is an attempt to analyze spectrum of gastric electrical impedance, which reveals useful information regarding gastrointestinal motility and symptoms to assess gastric motility noninvasively.
2. Methods
2.1 Electrical Impedance Gastric Motility
Macroscopically human tissue can be considered as a free charge conductor for measurement frequencies
less than 100 kHz. The stomach, additionally, being a muscular bag with a small volume in the fasting state (approximately 50 mL) and becoming larger when a meal is ingested, can be studied by electrical impedance (EIP). EIP is considered as the collection of data in the form of electrical impedance measurements at a suitable sampling rate, using surface electrodes from the gastric area [10].
EIP measurement system used in the present work generates an alternating current of 50 kHz, which can be adjusted in intensity from 1 to 4 mA. The sampling rate of the data collection is 5 Hz and a multiplexed system of electrodes is used to extract gastric impedance and synchronization EGG.
2.2 Analysis Process
2.2.1 Data Acquisition
Electrical impedance signals around abdomen of subjects were recorded for the offline analysis. Tetra-polar impedance plethysmography was used to record impedance changes. The hardware of system in our lab was mainly involved a constant current with 50 kHz, data acquisition system ADuC834 and a personal computer. The SPCOMM control component was employed to sample the signal from the ADuC834. The sampling rate is 5 Hz. Two outer electrodes insert 2 mA, 50 kHz constant current on epigastric surface of body, and voltage is measured using inner two electrodes.
2.2.2 Subject Selection and Experiment
Forty healthy adults called control group (CG) and 36 pathologic stomach adults called pathologic group (PG) in this paper. The pathologic adults were functional dyspepsia patients (FD). Each subject sat on a rigid table. The first experiment took place on 40 healthy adults. The second experiment took place on 36 volunteers with pathologic stomach from the First Attached Hospital of Chongqing University of Medical Science. Age, sex, bodily form, relevant medical
Fig. 1 System implementation diagram.
Parameters Analysis of Gastric Motility Signals in Time Domain and Frequency Domain
16
history, etc., were recorded. The signal was recorded 30 minutes in fasting state at 3:00 p.m. after lunch. The launch used as a standard meal is 200 mL milk, 100 g bread of energy 1,300 kJ and 2,850 kJ, respectively. All subjects were explained about the experiment.
2.2.3 Signal Processing
Wavelet theory is designed to give good time resolution and poor frequency resolution at high frequencies, and good frequency resolution and poor time resolution at low frequencies. This feature is useful for the signal with high-frequency components for short durations and low-frequency components for long durations. Then wavelet transform has been described as a mathematical microscope for the natural sciences [11].
WT (a, b), named as the wavelet transform of f (t), is the inner product of f (t) and the mother wavelet (t) under different scales and time displacement, i.e., (1) which is a two-dimensional function.
1
In this paper, wavelet multi resolution analysis (MRA) is used to investigate the low-frequency feature of impedance signal. Choosing mother wavelet is difficult and usually finding the proper wavelet dependents on experiences and practice. But some famous wavelets have good performance. Such as the Morlet wavelet is excellent for achieving high-frequency resolution. The Mexicanhat wavelet has a poor frequency resolution but a good time resolution. The famous Daubechies wavelet has both good features and the widest application [12].
After simulate studies choosing various wavelet base functions in MATLAB platform, Daubechies wavelet base is chosen to analyze EIP signals. With many patients into experiment, according to the feature of EIP signal, DB series wavelet bases have been constructed in the paper. Fortunately, the DB series
wavelet (form DB4 to DB7) has good effect to separate the EIP signal from breathing and heart activity signals.
2.2.4 Feature Selection
By the means of energy and frequency spectrum analysis technic, the signals can be classified according to the dominant power and dominant frequency. If the peak power was within 2-4 CPM range, we called it normal. Otherwise lower than 2 CPM, we called it gastric bradygastria, while higher than 4 CPM, we called it gastric tachygastria. If a running spectrum cannot be classified as bradygastria, normal, or tachygastria, it will be classified as arrhythmia. The classification is the index to decide the state of gastric movement [13].
The parameters of signal dynamic spectrum, dominant frequency, dominant power, frequency instability coefficient and power instability coefficient, percent of normal rhythm and percent of normal power, were used as temporal features for the subjects. EGG was recorded synchronously. Therefore, some indexes such as dominant frequency and dominant power of synchronous EGG were also calculated. The instability coefficients are very important index. The frequency instability coefficient could be calculated as:
Freq
Where, DFAvgNormal is the average of the dominant frequency in all RSA (Running Spectrum Analysis) segments classified as normal.
The standard deviation SDFreq is calculated as:
2
Where, DF(K) was the dominant frequency for the K’th RSA segment. DFAvg was the average of the dominant frequency for all RSA segments and S was the number of RSA segments in the period [14].
3. Results
Parameters Analysis of Gastric Motility Signals in Time Domain and Frequency Domain
16
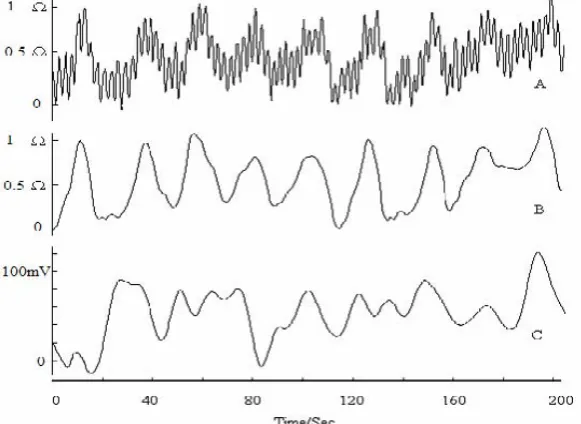
activity signals. The signals transformed by wavelet and reconstructed by approximate component are shown in Fig. 2(B). The reconstructed signals of EIP and EGG are smooth and glossy; some high frequency interferences such as breath and heart activity are filtered. The rest component is about 3 CPM of gastric contraction rhythm. In physiology, the electrical signal is the base of mechanical contraction. If shrinkage comes into existence, the actuating of EGG is the first present. On the contrary, the present of EGG may not correspond to a gastric shrinkage. In order to compare EGG with EIP, we collect the synchronize EGG. The impedance signal of gastric motility is shown in Fig. 2(B), and the synchronize EGG is shown in Fig. 2(C). Compared the two signals, EIP indicates the gastric mechanical activity; EGG expresses the gastric electrical activity. These two signals have some relationship and a big correlation coefficient, but they are not identical.
Some statistical indexes were shown in Table 1. Compared with the indexes of CG, the percentage of normal frequency is much smaller while the instability coefficient is much larger in PG group. We could also see the corresponding differences of percentage of normal power and power instability coefficient between the two groups. All the parameters have significant difference in statistics.
The running spectrum of impedance signal is shown in Figs. 3-4. The main frequency of the control group (CG) belongs to 2-4 CPM. It is clear and very regular. Compared with the CG, the main frequency of the PG is difficult to evaluate. It is disordered and major peak of the curve belong to 1-3 CPM. EIP and EGG are very slow and the main frequency generally is 2-4 CPM for health adults. The peak of frequency is variable over time, which is a phenomenon of physiological adaptation.
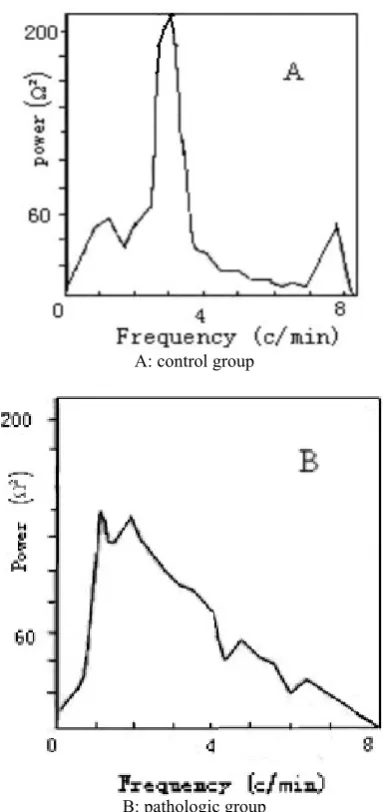
From the power spectrum (Fig. 5), we find that the
Fig. 2 Signals (A: original signal; B: impedance signal by wavelet; C: synchronize EGG).
Table 1 The results of the two groups to detect gastric motility for volunteers.
Sample size
Percentage of normal frequency
Percentage of normal power
Frequency instability coefficient
Power instability coefficient CG 40 0.704 ± 0.255 0.592 ± 0.044 0.182 ± 0.059 1.576 ± 0.481 PG 36 0.402 ± 1.145 0.468 ± 0.142 0.374 ± 0.086 4.006 ± 0.711
P value < 0.01 < 0.05 < 0.01 < 0.01
Parameters Analysis of Gastric Motility Signals in Time Domain and Frequency Domain
16
Fig. 3 Typical impedance signal running spectrum for control group.
Fig. 4 Typical impedance signal running spectrum for pathologic group.
peak of the maximal power of CG belongs to 2-4 CPM and the maximal power of the pathologic group belongs to 1-2 CPM. Though we could not make a conclusion that the symptom is gastric bradygastria, the specific frequency of maximal power is abnormal. The impedance is influenced by filling current and the electric resistance between electrodes, so we couldn’t judge the strength of gastric motility from the amplitude of power.
4. Conclusion and Discussion
There are some methods to detect stomach function in clinical now. But most of the routine methods are invasive or dear. Bioelectrical impedance because of its noninvasive, safe, cheap, simple and functional information-rich features, is easy to be accepted by
A: control group
B: pathologic group
Fig. 5 Typical power signal power spectrum.
doctors and patients, having broad application prospects. As early as 1985, Sutton et al. [15] carried out the research of using impedance to extract gastric motility signal, then research in this area one by one. This test learned the previous gains and losses, more carefully considered various interferences and effectively filtered, achieved satisfactory results.
Parameters Analysis of Gastric Motility Signals in Time Domain and Frequency Domain
16
Additionally, it can sample gastric motility impedance signal in high-precision 24-bit, so it is possible that we observe the greatest range of impedance signals based on changes in gastric motility. Wavelet transform successfully removes the influence of the heart activity signals. It ensures that all the information used for analyzing is valid. Percentage of normal frequency, percentage of normal power, frequency instability coefficient and power instability coefficient are several of the most representative parameters which could clearly reflect the difference of CG and PG.
In both time and frequency domains, impedance signal and synchronize EGG have some similar features. However synchronize EGG cannot be totally instead by gastric motility, especially in morbid state, EGG is not correspondence to impedance signal. The gastric contraction or gastric emptying is a complex procedure including electrical and mechanical activity. EIP and the synchronous EGG should be analyzed together. We will make a great of experiments to obtain the relationship between EIP and EGG. All the procedure in digestion, such as EGG, gastric contraction, peristalsis and gastric emptying, have to be think over, the operative evaluation to gastric kinetics can be constructed. We will add more EIP parameters to improve the performance in further research. In turn this could lead to the development of a noninvasive method for the continuous recording of volume variability with gastric contraction.
Acknowledgment
This project is supported by National Natural Science foundation of China (60901045), the Science and Technology Foundation of Chongqing Education Committee (KJ090505) and Science and Technology Research Key Projects Foundation of Chongqing, China (CSTC, 2009AA5049).
References
[1] R. Huerta-Franco, M. Vargas-Luna, E. Hernandez, K. Capaccione, T. Cordova, Use of short-term bio-impedance for gastric assessment, Med. Eng. Phys. 31 (7) (2009)
770-774.
[2] Z. Li, C. Ren, Gastric motility measurement and evaluation of functional dyspepsia by a bio-impedance method, Physiol. Meas. 29 (6) (2008) 373-382.
[3] J.D. Chen, X.M. Lin, M. Abo, Multi-channel gastric electrical simulation for the acceleration of gastric emptying, in: Advances in Medical Signal and Information Processing: First International Conference (IEEE Conf. PUB), 2000, pp. 60-65.
[4] M. Kusano, H. Zai, Y. Shimoyama, H. Hosaka, S. Kuribayashi, O. Kawamura, et al., Rapid gastric emptying, rather than delayed gastric emptying might provoke functional dyspepsia, J. Gastroenterol. Hepatol. 26 (3) (2011) 75-78.
[5] P. Du, G. O’Grady, L.K. Cheng, A.J. Pullan, A multiscale model of the electrophysiological basis of the human electrogastrogram, Biophys. J. 99 (9) (2010) 2784-2792. [6] X.H. Xu, H.B. Zhu, J.D. Chen, Pyloric electrical
stimulation reduces food intake by inhibiting gastric motility in dogs, Gastroenterology 128 (1) (2005) 43-50. [7] Z. Li, C. Ren, Gastric motility measurement and
evaluation of functional dyspepsia by a bio-impedance method, Physiol. Meas. 29 (6) (2008) 373-382.
[8] N.A. Hadi, A. Giouvanoudi, R. Morton, Variations in gastric emptying times of three stomach regions for simple and complex meals using scintigraphy, IEEE Transactions on Nuclear Science 49 (2002) 2328-2331.
[9] A. Giouvanoudi, W.B. Amaee, J.A. Sutton, Physiological interpretation of electrical impedance epigastrography measurements, Physiol. Meas. 24 (1) (2003) 45-55. [10] A. Keshtkar, Z. Salehnia, M.H. Somi, A.T. Eftekharsadat,
Some early results to electrical impedance of normal and abnormal gastric tissue, Phys. Med. 28 (1) (2012) 19-24. [11] H. Ji, C. Fermйller, Robust wavelet-based
super-resolution reconstruction: Theory and algorithm, IEEE Trans. Pattern. Anal. Mach. Intell. 31 (4) (2009) 649-660.
[12] A. Bernjak, A. Stefanovska, Importance of wavelet analysis in laser Doppler flowmetry time series, in: Conf. Proc. IEEE Med. Biol. Soc., 2007, pp. 4064-4067. [13] Z. Li, C. Ren, Gastric motility measurement and
evaluation of functional dyspepsia by a bio-impedance method, Physiol. Meas. 29 (2008) 373-382.
[14] M. Chacón, G. Curilem, G. Acuňa, C. Defilippi, A.M. Madrid, S. Jara, Detection of patients with functional dyspepsia using wavelet transform applied to their electrogastrogram, Braz. J. Med. Biol. Res. 42 (12) (2009) 1203-1209.
[15] J.A. Sutton, G.R. McClelland, J.A. Sutton, Epigastric impedance: A non-invasive method for the assessment of gastric emptying and motility, Gut. 26 (6) (1985) 607-614.
Journal of Life Sciences 6 (2012) 20-27
Validation of Metformin Hydrochloride in Human Plasma
by HPLC-Photo Diode Array (PDA) for Application of
Bioequivalence Study
Yahdiana Harahap, Krisnasari Dianpratami, Mahi Wulandari and Rina Rahmawati
Department of Pharmacy, University of Indonesia, Depok, Jakarta 16424, Indonesia
Received: March 10, 2011 / Accepted: July 25, 2011 / Published: January 30, 2012.
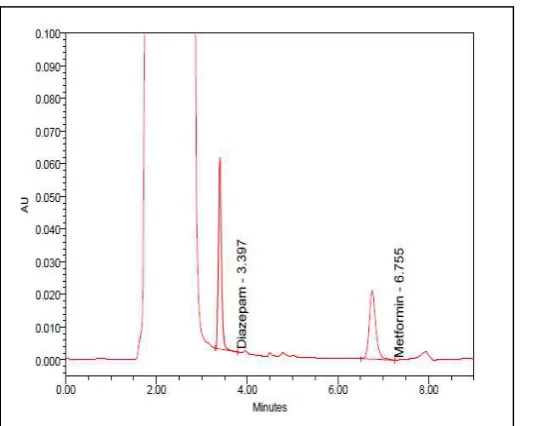
Abstract: A sensitive and specific high performance liquid chromatography (HPLC) method was developed and validated for the simultaneous determination of metformin hydrochloride (HCl) in human plasma. The HPLC method consists of isocratic eluation with a mixture of 60% buffer (10 mM sodium dihyrogenphosphate-10 mM sodium dodecyl sulphate) and 40% acetonitrile with final pH 7.0 with flow rate of 1.0 mL/min on a Kromasil® Akzo Nobel RP-18 (4.6 mm ID × 250 mm, 5 µm) column at an ambient temperature. Photo diode array detection was performed in program mode at 234 nm. The analyte and diazepam as internal standard (IS) were extracted from plasma using 10% trichloroacetic acid. The assay was linear over the therapeutic concentration range of 20-2,500 ng/mL for metformin HCl with correlation coefficient of r = 0.9999. Limit of quantitation was 20 ng/mL. The results obtained for intra/inter day accuracy and precision complied very well with the generally accepted criteria for bio-analytical assay. The method was applied to bioequivalence (BE) study of metformin HCl in healthy Indonesian volunteers after treatment with 750 mg XR metformin HCl. This BE study shows that the two formulations are equivalent so that they were therapeutically interchangeable for each other.
Key words: Metformin HCl, diazepam, HPLC, sodium dodecyl sulphate (SDS), photo diode array (PDA) detector, bioequivalence (BE) study.
1. Introductions
Metformin hydrochloride (N,N-Dimethyl-imido-di- carbonimidic diamide hydrochloride) is a strongly basic bisubstituted guanidine derivative with short side chains. An oral biguanidine antihyperglycaemic agent improves glucose control in patients with type 2 diabetes by lowering both basal and postprandial plasma glucose levels [1-4]. Metformin HCl decreases hepatic glucose production, intestinal absorption of glucose, and improves insulin sensitivity by increasing peripheral glucose uptake and utilization [5-6].
Metformin hydrochloride is slowly and incompletely absorbed from the gastrointestinal tract with a bioavailability of 50% to 60%. Plasma levels
Corresponding author: Yahdiana Harahap, Ph.D., Prof., research fields: bioanalysis, BE study and DNA adducting. E-mails: [email protected]; [email protected].
peak (Cmax) of 1.6 ± 0.38 g/ml are reached (Tmax) at
2.6 ± 0.8 h after oral administration of a single 500 mg dose [2, 6]. It is negligibly bounded to plasma proteins and approximately 90% of the absorbed drug that is eliminated via the renal route within the first 24 h, with plasma elimination half-life of 3.6-6.2 h [5-7].
Validation of Metformin Hydrochloride in Human Plasma by HPLC-Photo Diode Array (PDA) for Application of Bioequivalence Study
21
ensure that the used method shall give accurate and reliable result for bioequivalence study, a bioanalytical validation must be performed on the method [10].
The objective of this research is to obtain the validity of metformin analysis method using RP system which is combined with ion-pair in order to be applied for bioequivalence study.
2. Experimental
2.1 Chemicals
Metformin hydrochloride and the internal standard diazepam were obtained from the United State Pharmacopeia reference standard and Menjangan Sakti Company. Sodium dihydrogen phosphate, sodium hydroxide, trichloroacetic acid, sodium dodecyl sulphate, as well as HPLC-grade methanol, acetonitrile were purchased from Merck (Germany) and aquabidestilata from Ikapharmindo (Indonesia). Human plasma was used as the assay blank and for the preparation of spiked plasma standards was obtained from the Indonesian Red Cross (Palang Merah Indonesia, Jakarta).
2.2 Chromatographic Condition
The concentration of metformin HCl in plasma is determined using a high performance liquid chromatography with PDA detection. The HPLC system is Waters 2695 equipped with auto sampler. The separation was performed on Kromasil® C-18, 250 × 4.6 mm, 5 µm column from Akzo Nobel. The wavelength was set at 234 nm. The mobile phase was a mixture of 40% acetonitrile, 0.01 M sodium dodecyl sulphate, 0.01 M sodium dihydrogen phosphate and distilled water to 100%, adjusted to pH 7 at a flow rate of 1 mL/min.
2.3 Matrix Based Standard Solutions and Quality Control Samples
A stock standard solution of metformin (1,000 µg/mL) was prepared by dissolving 10 mg metformin HCl in 10 mL by distilled water. Working standard of
metformin was prepared by diluting aliquots of the stock solution with the distilled water to make up final concentration of 100, 25, 10, 2.5, 1, 0.5 and 0.2 µg/mL. These were used to prepare for plasma calibration standard in the linear dynamic range covering 20 to 2,500 ng/mL. Three quality control (QC) plasma samples containing 100, 1,000 and 2,000 ng/mL were prepared. The QC samples were used to determine stability: long term, short term, stock solution, freeze and thaw stability and auto sampler stability. Accuracy and precision were also evaluated using the above QC samples. For the precision was checked by calculating, the variation of the measured value and the accuracy was checked by calculating the difference between the measured values and the actual values. Precision and accuracy should be measured by using minimum of five determinations per concentration and a minimum three concentrations in the range that expected concentration is recommended. The acceptance limit for coefficient of variation (CV) and % differentiation (Diff) is should not exceed ± 15%, except for the lower limit of quantification (LLOQ) where it should not exceed ± 20% of the CV and Diff.
The internal standard diazepam stock standard solution was prepared by dissolving 10 mg in 10 mL methanol to make a final concentration of 1,000 µg/mL.
2.4 Sample Preparation
As much as 600 µL of human plasma which contains metformin hydrochloride will be mixed in a 1.5 mL effendorf vial with 30 µL internal standard (1,000 µg/mL in distilled water) and 600 µL trichloroacetic acid. The sample will be shaken with vortex for 120 seconds and centrifuged at 10,000 rpm for 5 min. After that 1,000 µL supernatant was separated in a clean vial before adding 60 µL of 4 N NaOH. The mixture was vortexed (5 seconds). A 100 µL aliquot of sample was injected into the equilibrated HPLC system.
2.5 Application to Bioequivalence Study