Kimball Group
Reader
The
Ralph Kimball
Margy Ross
with Bob Becker, Joy Mundy, and Warren Thornthwaite
Relentlessly
Practical Tools for
The Kimball
Group Reader
Relentlessly Practical Tools
for Data Warehousing and
Business Intelligence
Ralph Kimball
Margy Ross
The Kimball Group Reader; Relentlessly Practical Tools for Data Warehousing and Business Intelligence Published by
Wiley Publishing, Inc. 10475 Crosspoint Boulevard Indianapolis, IN 46256
www.wiley.com
Copyright © 2010 Ralph Kimball and Margy Ross Published by Wiley Publishing, Inc., Indianapolis, Indiana Published simultaneously in Canada
ISBN: 978-0-470-56310-6
Manufactured in the United States of America 10 9 8 7 6 5 4 3 2 1
No part of this publication may be reproduced, stored in a retrieval system or transmitted in any form or by any means, electronic, mechanical, photocopying, recording, scanning or otherwise, except as permitted under Sections 107 or 108 of the 1976 United States Copyright Act, without either the prior written permission of the Publisher, or authorization through payment of the appropriate per-copy fee to the Copyright Clearance Center, 222 Rosewood Drive, Danvers, MA 01923, (978) 750-8400, fax (978) 646-8600. Requests to the Publisher for per-mission should be addressed to the Perper-missions Department, John Wiley & Sons, Inc., 111 River Street, Hoboken, NJ 07030, (201) 748-6011, fax (201) 748-6008, or online at http://www.wiley.com/go/permissions. Limit of Liability/Disclaimer of Warranty: The publisher and the author make no representations or warranties with respect to the accuracy or completeness of the contents of this work and specifically disclaim all warran-ties, including without limitation warranties of fitness for a particular purpose. No warranty may be created or extended by sales or promotional materials. The advice and strategies contained herein may not be suitable for every situation. This work is sold with the understanding that the publisher is not engaged in rendering legal, accounting, or other professional services. If professional assistance is required, the services of a competent professional person should be sought. Neither the publisher nor the author shall be liable for damages arising herefrom. The fact that an organization or Web site is referred to in this work as a citation and/or a potential source of further information does not mean that the author or the publisher endorses the information the organization or Web site may provide or recommendations it may make. Further, readers should be aware that Internet Web sites listed in this work may have changed or disappeared between when this work was written and when it is read.
For general information on our other products and services please contact our Customer Care Department within the United States at (877) 762-2974, outside the United States at (317) 572-3993 or fax (317) 572-4002. Wiley also publishes its books in a variety of electronic formats. Some content that appears in print may not be available in electronic books.
Library of Congress Control Number: 2009942822
About the Authors
Ralph Kimball founded the Kimball Group. Since the mid 1980s, he has been the DW/BI indus-try’s thought leader on the dimensional approach and has trained more than 10,000 IT profes-sionals. Prior to working at Metaphor and founding Red Brick Systems, Ralph co-invented the Star workstation at Xerox’s Palo Alto Research Center (PARC). Ralph has a Ph.D. in Electrical Engineering from Stanford University.
Executive Editor Robert Elliott
Project Editor Sara Shlaer
Senior Production Editor Debra Banninger
Copy Editor Kim Cofer
Editorial Director Robyn B. Siesky
Editorial Manager Mary Beth Wakefield
Marketing Manager Ashley Zurcher
Production Manager Tim Tate
Vice President and Executive Group Publisher Richard Swadley
Vice President and Executive Publisher Barry Pruett
Associate Publisher Jim Minatel
Project Coordinator, Cover Lynsey Stanford
Compositor
Maureen Forys, Happenstance Type-O-Rama
Proofreader Nancy Carrasco
Indexer
Johnna VanHoose Dinse
Cover Image iStockPhoto
Acknowledgments
F
irst, we want to thank the 28,000 current subscribers to the Kimball Design Tips, and the uncounted numbers of you who have visited the Kimball Group web site to peruse our magazine article archive. This book brings the design tips and articles together in what we hope is a very usable form.The Kimball Group Reader would not exist without the assistance of our business partners. Kimball Group members Bob Becker, Joy Mundy, and Warren Thornthwaite wrote many of the valuable articles and design tips included in the book. Thanks to Julie Kimball for her insightful comments. Thanks also to former Kimball Group member Bill Schmarzo for his contributions on analytic applications.
Bob Elliott, our executive editor at Wiley Publishing, project editor Sara Shlaer, and the rest of the Wiley team have supported this project with skill, encouragement, and enthusiasm. It has been a pleasure to work with them. We also want to thank Doug Henschen, editor of Intelligent Enterprise, and Julie Langenkamp, editor of DM Review, for allowing us to publish the many articles that appeared in their magazines.
Contents at a Glance
Introduction . . . xxi
1
The Reader
at a Glance . . . 1
2
Before You Dive In . . . 35
3
Project/Program Planning . . . 69
4
Requirements Definition . . . 113
5
Data Architecture . . . 133
6
Dimensional Modeling Fundamentals . . . .179
7
Dimensional Modeling Tasks and Responsibilities . . . 209
8
Fact Table Core Concepts . . . 233
9
Dimension Table Core Concepts . . . 285
10
More Dimension Patterns and Case Studies . . . 333
11
Back Room ETL and Data Quality . . . 425
12
Technical Architecture Considerations . . . 513
13
Front Room Business Intelligence Applications . . . 589
14
Maintenance and Growth Considerations . . . .651
Index of Articles . . . 685
Contents
Introduction . . . .xxi
1
The Reader
at a Glance . . . .1
Setting Up for Success . . . 1
1.1 Resist the Urge to Start Coding . . . 1
1.2 Set Your Boundaries . . . 4
Tackling DW/BI Design and Development . . . 6
1.3 Data Wrangling . . . 6
1.4 Myth Busters . . . 8
1.5 Dividing the World . . . 10
1.6 Essential Steps for the Integrated Enterprise Data Warehouse. . . 13
1.7 Drill Down to Ask Why . . . 22
1.8 Slowly Changing Dimensions . . . 24
1.9 Judge Your BI Tool through Your Dimensions . . . 28
1.10 Fact Tables . . . 30
1.11 Exploit Your Fact Tables. . . 32
2
Before You Dive In . . . .
35
Historical Perspective. . . 35
2.1 The Database Market Splits. . . 36
2.2 Bringing Up Supermarts . . . 38
Dealing with Demanding Realities. . . 45
2.3 Brave New Requirements for Data Warehousing . . . 46
2.4 Coping with the Brave New Requirements . . . 50
2.5 Stirring Things Up. . . 55
2.6 Design Constraints and Unavoidable Realities . . . 58
2.7 Two Powerful Ideas. . . 61
Contents
xii
3
Project/Program Planning. . . .
69
Professional Responsibilities . . . 69
3.1 Professional Boundaries . . . 69
3.2 An Engineer’s View . . . 72
3.3 Beware the Objection Removers . . . 76
3.4 What Does the Central Team Do? . . . 80
3.5 Avoid DW/BI Isolation . . . 83
3.6 Implementation Analysis Paralysis . . . 84
Justification and Sponsorship . . . 85
3.7 Habits of Effective Sponsors . . . 86
3.8 TCO Starts with the End User. . . 89
3.9 Better Business Skills for BI and Data Warehouse Professionals . 93 Kimball Methodology . . . 96
3.10 Kimball Lifecycle in a Nutshell . . . 96
3.11 Off the Bench . . . 99
3.12 The Anti-Architect . . . 100
3.13 Think Critically When Applying Best Practices . . . 103
3.14 Eight Guidelines for Low Risk Enterprise Data Warehousing . 106 3.15 Relating to Agile Methodologies . . . 109
3.16 Is Agile Enterprise Data Warehousing an Oxymoron? . . . 110
4
Requirements Definition. . . .
113
Gathering Requirements . . . 113
4.1 Alan Alda’s Interviewing Tips for Uncovering Business Requirements . . . 113
4.2 More Business Requirements Gathering Dos and Don’ts . . . 117
4.3 Overcoming Obstacles When Gathering Business Requirements. 119 4.4 Surprising Value of Data Profiling . . . 121
Organizing around Business Processes . . . 123
4.5 Focus on Business Processes, Not Business Departments! . . . 123
4.6 Identifying Business Processes . . . 124
4.7 Business Process Decoder Ring . . . 127
4.8 Relationship between Strategic Business Initiatives and Business Processes . . . 127
Wrapping Up the Requirements . . . 128
5
Data Architecture. . . .
133
Making the Case for Dimensional Modeling . . . 133
5.1 Is ER Modeling Hazardous to DSS? . . . 133
5.2 A Dimensional Modeling Manifesto . . . 137
5.3 There Are No Guarantees . . . 145
Enterprise Data Warehouse Bus Architecture . . . 148
5.4 Divide and Conquer . . . 148
5.5 The Matrix. . . 151
5.6 The Matrix: Revisited . . . 155
5.7 Drill Down into a Detailed Bus Matrix . . . 159
Integration Instead of Centralization. . . 161
5.8 Integration for Real People . . . 161
5.9 Data Stewardship 101: The First Step to Quality and Consistency . . . 165
5.10 To Be or Not To Be Centralized . . . 168
Contrast with the Corporate Information Factory . . . 171
5.11 Differences of Opinion . . . 171
5.12 Don’t Support Business Intelligence with a Normalized EDW . . 176
6
Dimensional Modeling Fundamentals . . . .
179
Basics of Dimensional Modeling . . . 179
6.1 Fact Tables and Dimension Tables . . . 179
6.2 Drilling Down, Up, and Across . . . 183
6.3 The Soul of the Data Warehouse, Part One: Drilling Down . . . . 186
6.4 The Soul of the Data Warehouse, Part Two: Drilling Across . . . 189
6.5 The Soul of the Data Warehouse, Part Three: Handling Time . . 191
6.6 Graceful Modifications to Existing Fact and Dimension Tables . . 194
Dos and Don’ts. . . 196
6.7 Kimball’s Ten Essential Rules of Dimensional Modeling . . . 196
6.8 What Not to Do. . . 199
Myths about Dimensional Modeling . . . 201
6.9 Dangerous Preconceptions . . . 201
6.10 Fables and Facts . . . 204
7
Dimensional Modeling Tasks and Responsibilities . . . .
209
Design Activities . . . 209
Contents
xiv
7.2 Staffing the Dimensional Modeling Team. . . 216
7.3 Practical Steps for Designing a Dimensional Model . . . 217
7.4 The Naming Game . . . 220
7.5 When Is the Dimensional Design Done? . . . 221
Design Review Activities . . . 223
7.6 Fistful of Flaws . . . 223
7.7 Rating Your Dimensional Data Warehouse. . . 226
8
Fact Table Core Concepts . . . .
233
Granularity. . . 233
8.1 Declaring the Grain. . . 233
8.2 Keep to the Grain in Dimensional Modeling . . . 236
8.3 Warning: Summary Data May Be Hazardous to Your Health . . . 238
8.4 No Detail Too Small . . . 239
Types of Fact Tables . . . 242
8.5 Fundamental Grains . . . 243
8.6 Modeling a Pipeline with an Accumulating Snapshot . . . 246
8.7 Combining Periodic and Accumulating Snapshots. . . 249
8.8 Modeling Time Spans . . . 250
8.9 A Rolling Prediction of the Future, Now and in the Past . . . 252
8.10 Factless Fact Tables. . . 255
8.11 Factless Fact Tables? Sound Like Jumbo Shrimp? . . . 258
8.12 What Didn’t Happen . . . 259
Parent-Child Fact Tables . . . 262
8.13 Managing Your Parents . . . 263
8.14 Patterns to Avoid When Modeling Header/Line Item Transactions . . . 266
Fact Table Keys and Degenerates. . . 268
8.15 Fact Table Surrogate Keys. . . 268
8.16 Reader Suggestions on Fact Table Surrogate Keys . . . 269
8.17 Another Look at Degenerate Dimensions . . . 271
8.18 Creating a Reference Dimension for Infrequently Accessed Degenerates . . . 272
Miscellaneous Fact Table Design Patterns. . . 273
8.20 Keeping Text Out of the Fact Table . . . 275
8.21 Dealing with Nulls in a Dimensional Model . . . 276
8.22 Modeling Data as Both a Fact and Dimension Attribute. . . 277
8.23 When a Fact Table Can Be Used as a Dimension Table . . . 278
8.24 Sparse Facts and Facts with Short Lifetimes . . . 280
8.25 Pivoting the Fact Table with a Fact Dimension . . . 282
9
Dimension Table Core Concepts . . . .
285
Dimension Table Keys . . . 285
9.1 Surrogate Keys. . . 285
9.2 Keep Your Keys Simple . . . 289
Date and Time Dimension Considerations . . . 290
9.3 It’s Time for Time . . . 291
9.4 Surrogate Keys for the Time Dimension . . . 293
9.5 Latest Thinking on Time Dimension Tables. . . 295
9.6 Smart Date Keys to Partition Fact Tables . . . 296
9.7 Handling All the Dates . . . 298
Miscellaneous Dimension Patterns . . . 299
9.8 Data Warehouse Role Models . . . 299
9.9 Mystery Dimensions . . . 303
9.10 De-Clutter with Junk Dimensions . . . 306
9.11 Showing the Correlation Between Dimensions. . . 307
9.12 Causal (Not Casual) Dimensions . . . 308
9.13 Resist Abstract Generic Dimensions . . . 311
9.14 Hot-Swappable Dimensions . . . 312
9.15 Accurate Counting with a Dimensional Supplement . . . 314
Slowly Changing Dimensions . . . 315
9.16 Perfectly Partitioning History with Type 2 SCD . . . 316
9.17 Many Alternate Realities . . . 316
9.18 Monster Dimensions . . . 320
9.19 When a Slowly Changing Dimension Speeds Up . . . 322
9.20 When Do Dimensions Become Dangerous? . . . 325
9.21 Slowly Changing Dimensions Are Not Always as Easy as 1, 2, and 3 . . . 326
Contents
xvi
10
More Dimension Patterns and Case Studies . . . .
333
Snowflakes, Outriggers, and Bridges . . . 333
10.1 Snowflakes, Outriggers, and Bridges. . . 333
10.2 A Trio of Interesting Snowflakes. . . 336
10.3 Help for Dimensional Modeling . . . 340
10.4 Managing Bridge Tables . . . 343
10.5 The Keyword Dimension . . . 347
Dealing with Hierarchies . . . 351
10.6 Maintaining Dimension Hierarchies . . . 351
10.7 Help for Hierarchies . . . 355
10.8 Five Alternatives for Better Employee Dimensional Modeling . . 359
10.9 Alternate Hierarchies . . . 365
Customer Issues. . . 366
10.10 Dimension Embellishments . . . 367
10.11 Wrangling Behavior Tags . . . 368
10.12 Three Ways to Capture Customer Satisfaction . . . 371
Addresses and International Issues . . . 374
10.13 Think Globally, Act Locally . . . 374
10.14 Warehousing without Borders . . . 378
10.15 Spatially Enabling Your Data Warehouse . . . 383
10.16 Multinational Dimensional Data Warehouse Considerations. . 387
Industry Scenarios and Idiosyncrasies . . . 389
10.17 An Insurance Data Warehouse Case Study. . . 389
10.18 Traveling through Databases. . . 393
10.19 Human Resources Dimensional Models . . . 396
10.20 Not So Fast . . . 400
10.21 The Budgeting Chain . . . 403
10.22 Compliance-Enabled Data Warehouses . . . 407
10.23 Clicking with Your Customer . . . 409
10.24 The Special Dimensions of the Clickstream . . . 413
10.25 Fact Tables for Text Document Searching . . . 417
10.26 Enabling Market Basket Analysis . . . 420
11
Back Room ETL and Data Quality. . . .
425
Planning the ETL System. . . 425
11.2 The 34 Subsystems of ETL . . . 430
11.3 Doing the Work at Extract Time. . . 434
11.4 Is Data Staging Relational? . . . 437
11.5 Staging Areas and ETL Tools . . . 441
11.6 Should You Use an ETL Tool? . . . 442
11.7 Document the ETL System . . . 445
11.8 Measure Twice, Cut Once . . . 445
11.9 Brace for Incoming . . . 449
11.10 Building a Change Data Capture System . . . 452
Data Quality Considerations . . . 454
11.11 Dealing with Dirty Data . . . 454
11.12 An Architecture for Data Quality . . . 460
11.13 Indicators of Quality . . . 468
11.14 Is Your Data Correct? . . . 471
11.15 Eight Recommendations for International Data Quality . . . . 474
11.16 Using Regular Expressions for Data Cleaning . . . 477
Populating Fact and Dimension Tables . . . 481
11.17 Pipelining Your Surrogates . . . 481
11.18 Replicating Dimensions Correctly . . . 485
11.19 Identify Dimension Changes Using Cyclic Redundancy Checksums . . . 486
11.20 Maintaining Back Pointers to Operational Sources. . . 487
11.21 Creating Historical Dimension Rows . . . 488
11.22 Backward in Time . . . 491
11.23 Early-Arriving Facts . . . 494
11.24 Slowly Changing Entities . . . 495
11.25 Creating, Using, and Maintaining Junk Dimensions . . . 497
11.26 Using the SQL MERGE for Slowly Changing Dimensions . . . 499
11.27 Being Offline as Little as Possible . . . 502
Supporting Real Time . . . 503
11.28 Working in Web Time . . . 503
11.29 Real-Time Partitions . . . 507
11.30 The Real-Time Triage . . . 510
12
Technical Architecture Considerations . . . .
513
Overall Technical/System Architecture . . . 513
Contents
xviii
12.2 Picking the Right Approach to MDM . . . 515
12.3 Building Custom Tools for the DW/BI System . . . 520
12.4 Welcoming the Packaged App . . . 522
12.5 ERP Vendors: Bring Down Those Walls . . . 525
12.6 Building a Foundation for Smart Applications . . . 528
12.7 RFID Tags and Smart Dust . . . 533
Presentation Server Architecture . . . 535
12.8 The Aggregate Navigator. . . 536
12.9 Aggregate Navigation with (Almost) No Metadata . . . 539
12.10 Relating to OLAP . . . 546
12.11 Dimensional Relational versus OLAP: The Final Deployment Conundrum . . . 549
12.12 Dimensional Modeling for Microsoft Analysis Services . . . 553
12.13 Architecting Your Data for Microsoft SQL Server 2005 . . . 554
12.14 Microsoft SQL Server Comes of Age for Data Warehousing. . 556
Front Room Architecture. . . 560
12.15 The Second Revolution of User Interfaces . . . 560
12.16 Designing the User Interface. . . 562
Metadata. . . 566
12.17 Meta Meta Data Data. . . 567
12.18 Creating the Metadata Strategy . . . 570
Infrastructure and Security Considerations. . . 572
12.19 Watching the Watchers. . . 572
12.20 Catastrophic Failure . . . 576
12.21 Digital Preservation. . . 579
12.22 Creating the Advantages of a 64-Bit Server . . . 582
12.23 Server Configuration Considerations . . . 583
12.24 Adjust Your Thinking for SANs . . . 585
13
Front Room Business Intelligence Applications. . . .
589
Delivering Value with Business Intelligence . . . 589
13.1 The Promise of Decision Support . . . 589
13.2 Beyond Paving the Cow Paths. . . 593
13.3 Big Shifts Happening in BI . . . 596
Implementing the Business Intelligence Layer . . . 601
13.5 Think Like a Software Development Manager . . . 601
13.6 Standard Reports: Basics for Business Users . . . 602
13.7 Building and Delivering BI Reports. . . 607
13.8 The BI Portal . . . 610
13.9 Dashboards Done Right . . . 612
13.10 Don’t Be Overly Reliant on Your Data Access Tool’s Metadata . 613 Mining Data to Uncover Relationships . . . 615
13.11 Digging into Data Mining . . . 615
13.12 Preparing for Data Mining . . . 617
13.13 The Perfect Handoff . . . 621
13.14 Get Started with Data Mining Now. . . 625
Dealing with SQL. . . 629
13.15 Simple Drill Across in SQL . . . 629
13.16 The Problem with Comparisons . . . 631
13.17 SQL Roadblocks and Pitfalls . . . 635
13.18 Features for Query Tools . . . 638
13.19 Turbocharge Your Query Tools . . . 640
13.20 Smarter Data Warehouses . . . 644
14
Maintenance and Growth Considerations . . . .
651
Deploying Successfully . . . 651
14.1 Don’t Forget the Owner’s Manual . . . 651
14.2 Let’s Improve Our Operating Procedures . . . 655
14.3 Marketing the DW/BI System . . . 656
14.4 Coping with Growing Pains . . . 658
Sustaining for Ongoing Impact . . . 661
14.5 Data Warehouse Checkups . . . 661
14.6 Boosting Business Acceptance. . . 667
14.7 Educate Management to Sustain DW/BI Success . . . 670
14.8 Getting Your Data Warehouse Back on Track . . . 673
14.9 Upgrading Your BI Architecture . . . 674
14.10 Four Fixes for Legacy Data Warehouses. . . 676
14.11 A Data Warehousing Fitness Program for Lean Times . . . 680
Index of Articles . . . .
685
Introduction
T
he Kimball Group’s article archive has been the most popular destination on our web site (www.kimballgroup.com). Stretching back fifteen years to Ralph’s original 1995 DBMS magazine articles, the archive explores more than 200 topics, sometimes in more depth than provided by our books or courses. In recent years, it has become increasingly difficult to organize this valuable collection because it has grown by accretion; many of the topics were driven by events, opportunities, and advances in the art of data warehousing.With The Kimball Group Reader, we have organized all of the articles in a much more coherent way. But The Reader is more than merely a collection of our past magazine articles and design tips verbatim. We have trimmed the redundancy, made sure all the articles are written with the same consistent vocabulary, and updated many of the figures. This is a new and improved remastered compilation of our writings.
Intended Audience and Goals
The primary reader of this book should be the analyst, designer, modeler, or manager who is deliver-ing a data warehouse in support of business intelligence. The articles in this book trace the entire lifecycle of DW/BI system development, from original business requirements gathering all the way to final deployment. We believe that this collection of articles serves as a superb reference-in-depth for literally hundreds of issues and situations that arise in the development of a DW/BI system.
The articles range from a managerial focus to a highly technical focus, although in all cases, the tone of the articles strives to be educational. These articles have been accessed hundreds of times per day on the Kimball Group web site over a span of 15 years, so we’re confident they’re useful. This book adds significant value by organizing the archive, and systematically editing the articles to ensure their consistency and relevance.
Preview of Contents
Following two introductory chapters, the book’s organization will look somewhat familiar to read-ers of The Data Warehouse Lifecycle Toolkit, Second Edition (Wiley, 2008) because we’ve organized the articles topically to correspond with the major milestones of a data warehouse/business intel-ligence (DW/BI) implementation. Not surprisingly given the word “Kimball” is practically syn-onymous with dimensional modeling, much of The Reader focuses on that topic in particular.
Chapter 1:
Introduction
xxii
the Kimball approach in a cohesive manner, so it serves as a perfect overview, akin to CliffsNotes, for the book.
Chapter 2: Before You Dive In.
•
Long-time readers of Ralph’s articles will find that thischapter is a walk down memory lane, as many of the articles are historically significant. Somewhat amazingly, the content is still very relevant even though most of these articles were written in the 1990s.
Chapter 3: Project/Program Planning.
•
With an overview and history lesson under yourbelt, Chapter 3 moves on to getting the DW/BI program and project launched. We consider both the project team’s and sponsoring stakeholders’ responsibilities, and then delve into the Kimball Lifecycle approach.
Chapter 4: Requirements Definition.
•
It is difficult to achieve DW/BI success in the absenceof business requirements. This chapter delivers specific recommendations for effectively eliciting the business’s needs. It stresses the importance of organizing the requirements findings around business processes, and suggests tactics for reaching organizational con-sensus on appropriate next steps.
Chapter 5: Data Architecture.
•
With a solid understanding of the business requirements,we turn our attention to the data (where we will remain through Chapter 11). This chap-ter begins with the justification for dimensional modeling. It then describes the Kimball enterprise data warehouse bus architecture, provides rationalization for the requisite inte-gration and stewardship, and then contrasts the Kimball architecture with the Corporate Information Factory’s hub-and-spoke.
Chapter 6: Dimensional Modeling Fundamentals.
•
This chapter introduces the basics ofdimensional modeling, starting with distinguishing a fact from a dimension, and the core activities of drilling down, drilling across, and handling time in a data warehouse. We also explore familiar fables about dimensional models.
Chapter 7: Dimensional Modeling Tasks and Responsibilities.
•
While Chapter 6 coversthe fundamental “what and why” surrounding dimensional modeling, this chapter focuses on the “how, who, and when.” Chapter 7 describes the dimensional modeling process and tasks, whether starting with a blank slate or revisiting an existing model.
Chapter 8: Fact Table Core Concepts.
•
The theme for Chapter 8 could be stated as “justthe facts, and nothing but the facts.” We begin by discussing granularity and the three fundamental types of fact tables, and then turn our attention to fact table keys and degen-erate dimensions. The chapter closes with a slew of common fact table patterns, includ-ing null, textual, and sparsely populated metrics, as well as facts that closely resemble dimension attributes.
Chapter 9: Dimension Table Core Concepts.
•
We shift our focus to dimension tablesin Chapter 9, starting with a discussion of surrogate keys and the ever-present time (or date) dimensions. We then explore role playing, junk, and causal dimension patterns, before launching into a thorough handling of slowly changing dimensions. Hang onto your hats.
Chapter 10: More Dimension Patterns and Case Studies.
•
Chapter 10 complements theand outriggers, as well as bridges for handling both multi-valued dimension attributes and ragged variable hierarchies. We discuss nuances often encountered in customer dimen-sions, along with internationalization issues. The chapter closes with a series of case studies covering insurance, voyage, human resources, finance, electronic commerce, text searching, and retail; we encourage everyone to peruse these vignettes as the patterns and recommendations transcend industry or application boundaries.
Chapter 11: Back Room ETL and Data Quality.
•
We switch gears from designing thetarget dimensional model to populating it in Chapter 11. Be forewarned: This is a hefty chapter, as you’d expect given the subject matter. We start by describing the 34 subsys-tems required to extract, transform, and load (ETL) the data, along with the pros and cons of using a commercial ETL tool. From there, we delve into data quality considerations, provide specific guidance for building fact and dimension tables, and discuss the implica-tions of real-time ETL.
Chapter 12: Technical Architecture Considerations.
•
It’s taken us until Chapter 12, butwe’re finally discussing issues surrounding the technical architecture, starting with server oriented architecture (SOA), master data management (MDM), and packaged analytics. Subsequent sections in this chapter focus on the presentation server, including the role of aggregate navigation and online analytical processing (OLAP), user interface design, metadata, infrastructure, and security.
Chapter 13: Front Room Business Intelligence Applications.
•
In Chapter 13, we step intothe front room of the DW/BI system where business users are interacting with the data. We describe the lifecycle of a typical business analysis, starting with a review of histori-cal performance but not stopping there. We then turn our attention to standardized BI reports before digging into data mining. The chapter closes by exploring the limitations of SQL for business analysis.
Chapter 14: Maintenance and Growth Considerations.
•
You’ve made it! Last, but notleast, we provide recommendations for successfully deploying the DW/BI system, as well as keeping it healthy for sustained success.
Navigation Aids
Given the breadth and depth of the articles in The Kimball Group Reader, we have very deliberately identified over two dozen articles as “Kimball Classics” because they captured a concept so effec-tively that we, and many others in the industry, have referred to these articles repeatedly over the past fifteen years. The classic articles are designated with a special icon that looks like this:
Introduction
xxiv
We expect most people will read the articles in somewhat random order, rather than digest-ing the book from front to back. Therefore, we have put special emphasis on The Reader’s index as we anticipate many of you will delve in by searching the index for a particular technique or modeling situation. Just before sending the book off to the printer, we crawled through the entire Reader, asking the question “how would a reader locate this content in an index?” and then constructed index entries accordingly.
Terminology Notes
We are very proud that the vocabulary established by Ralph has been so durable and broadly adopted. Kimball “marker words” including dimensions, facts, slowly changing dimensions, surrogate keys, fact table grains, factless fact tables, and degenerate dimensions, have been used consistently across the industry for more than a decade. But in spite of our best intentions, a few terms have morphed since their introduction; we have retroactively replaced the old terms with the accepted current ones.
Artificial keys
•
are now called surrogate keys.Data mart
•
has been replaced with business process dimensional model, business process subject area, or just subject area, depending on the context.Data staging
•
is now known as extract, transform, and load. End-user applications•
have been replaced by business intelligence applications. Helper tables•
are now bridge tables.Since most people won’t read this book from cover to cover, we need to introduce some com-mon abbreviations up front:
DW/BI
•
is shorthand for the end-to-end data warehouse/business intelligence system. This abbreviation is useful for brevity, but it also explicitly links data warehousing and busi-ness intelligence as codependent. Finally, it reflects the shift of emphasis from the data warehouse being an end in itself to business intelligence (BI) really driving everything we do. After all, the data warehouse is the platform for all forms of BI.Many figures in
•
The Reader include the DD, FK, and PK abbreviations, which stand for degenerate dimension, foreign key, and primary key respectively.ETL
•
means extract, transform, and load, the standard paradigm for acquiring data and making it ready for exposure to BI tools.ER
•
refers to entity-relationship. We frequently use ER when we discuss third normal form (3NF) or normalized data models, as opposed to dimensional data models.OLAP
•
stands for online analytical processing, typically used to differentiate dimensional models captured in a multidimensional database or cube from dimensional models in a relational DBMS called star schemas. These relational star schemas are sometimes referred to as ROLAP. SCDB
eginning in late 2007, Ralph wrote a series of articles for DM Review magazine (now called Information Management). Published over a 16-month time frame, this sequence systemati-cally describes the Kimball approach and classic best practices in a cohesive manner. Rather than scattering these articles topically throughout the book, we opted to present the series nearly in its entirety because it provides an overview of the content that follows in subsequent chapters. You can think of Chapter 1 as CliffsNotes for The Kimball Group Reader.The chapter begins with several articles encouraging you to practice restraint and establish appropriate boundaries with other stakeholders when embarking on a data warehouse/business intelligence (DW/BI) project. From there, the series turns its attention to bringing operational data into the data warehouse and then leveraging core dimensional modeling principles to deliver robust analytic capabilities to the business users.
In addition to the articles in this chapter, Ralph also wrote a very detailed article on data quality for DM Review. Due to its in-depth coverage, this article is presented in Chapter 11 with other back room extract, transform, and load (ETL) topics.
Setting Up for Success
Before diving into implementing the DW/BI system, make sure you assess the complete set of related requirements, while avoiding the risks of overpromising.
1.1 Resist the Urge to Start Coding
Ralph Kimball,
DM Review,
Nov 2007
The most important first step in designing a DW/BI system, paradoxically, is to stop. Step back for a week, and be absolutely sure you have a sufficiently broad perspective on all the requirements that surround your project. The DW/BI design task is a daunting intellectual challenge, and it is not easy to step far enough back from the problem to protect yourself from embarrassing or career-threatening problems discovered after the project is underway.
Before cutting any code, designing any tables, or making a major hardware or software pur-chase, take a week to write down thoughtful, high quality answers to the following 10 questions,
The Reader
at a Glance
The Kimball Group Reader
2
each of which is a reality that will come to control your project at some point. These define the classic set of simultaneous constraints faced by every DW/BI effort.
1. Business requirements. Are you in touch with the key performance indicators (KPIs) your users actually need to make the decisions currently important to their enterprise? Although all 10 questions are important, understanding the business requirements is the most fun-damental and far reaching. If you have a positive answer to this question, you can identify the data assets needed to support decision making, and you will be able to decide which measurement process to tackle first.
2. Strategic data profiling. Have you verified that your available data assets are capable of supporting the answers to question number one? The goal of strategic data profiling is to make “go/no go” decisions very early in the DW/BI project as to whether to proceed with a subject area.
3. Tactical data profiling. Is there a clear executive mandate to support the necessary business process re-engineering required for an effective data quality culture, perhaps even driving for Six Sigma data quality? The only real way to improve data quality is to go back to the source and figure out why better data isn’t being entered. Data entry clerks are not the cause of poor data quality! Rather, the fixes require an end-to-end awareness of the need for better quality data and a commitment from the highest levels to change how business processes work.
4. Integration. Is there a clear executive mandate in your organization to define common descriptors and measures across all your customer-facing processes? All of the organi-zations within your enterprise that participate in data integration must come to agree-ment on key descriptors and measures. Have your executives made it clear that this must happen?
5. Latency. Do you have a realistic set of requirements from business users for how quickly data must be published by the data warehouse, including as-of-yesterday, many times per day, and truly instantaneous?
6. Compliance. Have you received clear guidance from senior management as to which data is compliance-sensitive, and where you must guarantee that you have protected the chain of custody?
7. Security. Do you know how you are going to protect confidential as well as proprietary data in the ETL back room, at the users’ desktops, over the web, and on all permanent media?
8. Archiving. Do you have a realistic plan for very long term archiving of important data, and do you know what data should be archived?
9. Supporting business users. Have you profiled all your user communities to determine their abilities to use spreadsheets, construct database requests in ad hoc query tools, or just view reports on their screens?
Time spent answering these classic DW questions is enormously valuable. Every one of the answers will affect the architecture, choice of approaches, and even the feasibility of your DW/BI project. You dare not start coding before all the team members understand what these answers mean!
The big news is that business users have seized control of the DW. They may not be building the technical infrastructure, but they are quite sure that they own the data warehouse and the BI tools and those tools must meet their needs. This transfer of initiative from IT to the users has been very obvious in the past two or three years. Witness the soul-searching articles and industry speeches exhorting CIOs to show more business leadership and the high CIO turnover as reported in CIO Magazine (see the April 1, 2004 issue at www.cio.com).
Many of the 10 questions in this article are brought into much clearer focus by increased user ownership of the DW/BI system. Let’s focus on the top five new urgent topics, in some cases coalescing our questions:
Business requirements
•
. The DW/BI system needs a permanent “KPI team” continuouslyin touch with business users’ analytic needs and the consequent demand for new data sources to support new KPIs. Also, the system should increasingly support the full gamut of analytic applications, which include not only data delivery, but alerting the users to problems and opportunities, exploring causal factors with additional data sources, testing what-if scenarios to evaluate possible decisions, and tracking the decisions made. The DW/ BI system is not just about displaying reports, but rather must be a platform for decision making in the broadest sense. The oldest label for data warehousing, decision support, remains surprisingly apt.
Strategic data profiling
•
. The earlier you tell the users bad news about the viability of a proposed data source, the more they will appreciate you. Develop the ability to assess a data source within a day or two. Elevate the data profiling tool to a strategic, must-have status.Tactical data profiling
•
. The increased awareness of data quality is one of the most remark-able new DW perspectives, certainly driven by business users. But all is for naught if the business is not willing to support a quality culture and the end-to-end business process re-engineering required.Integration and latency
•
. The user demand for the 360-degree integrated view of the busi-ness has been more like an approaching express train than a shock wave. We have been talking about it for almost a decade. But now the demands of integration, coupled with real-time access to information, have combined these two issues into a significant new architectural challenge.Compliance and security
•
. DW/BI folks in IT often don’t have the right instincts for protect-ing data because the system is supposed to be about exposprotect-ing data. But this new emphasis on compliance and security can be built systematically into the data flows and the BI tools across the entire DW/BI solution.The Kimball Group Reader
4
of articles, I probe each of these areas in some depth, reminding us of the remarkably unchanging aspects of data warehousing, while at the same time trying to catch the winds of change.
1.2 Set Your Boundaries
Ralph Kimball,
DM Review,
Dec 2007
In article 1.1, Resist the Urge to Start Coding, I encouraged you to pause briefly before charging for-ward on your ambitious DW/BI project. You were supposed to use this pause to answer a checklist of major environmental questions regarding business requirements, quality data, and whether your organization is ready to attack the hard issues of integration, compliance, and security.
While answering the questions, I hope you talked to all your business user clients and sponsors who may have a stake or a responsibility in the DW/BI system. Before the memory of these conver-sations fades away, I suggest you make a thorough list of all the promises you made as you were selling the concept of the DW/BI system. It wouldn’t surprise me if you said, “Yes, we will…”
Tie the rolling operational results to the general ledger (GL).
•
Implement effective compliance.
•
Identify and implement all the key performance indicators (KPIs) needed by marketing,
•
sales, and finance and make them available in the executive dashboard.
Encourage the business community to add new cost drivers to our system requirements
•
so that they can calculate activity-based costing and accurate profit across the enterprise. And while we are adding these cost drivers, we’ll work out all the necessary allocation factors to assign these costs against various categories of revenue.
Identify and implement all the customer satisfaction indicators needed by marketing.
•
Seamlessly integrate all the customer-facing operational processes into a single coherent
•
system.
Promise to use exclusively the front end, middleware, and back end tools provided by
•
the enterprise resource planning (ERP) vendor whose worldwide license was just signed by our CEO.
Be the first showcase application for the new service-oriented architecture (SOA) initiative,
•
and we’ll implement, manage, and validate the new infrastructure.
Implement and manage server virtualization for the DW/BI system. And this new system
•
will be “green.”
Implement and manage the storage area network (SAN) for the DW/BI system.
•
Implement and manage security and privacy for all data in the DW/BI system, including
•
responsibility for the lightweight directory access protocol (LDAP) directory server and its associated authentication and authorization functions. We’ll also make sure that all data accesses by the sales force in the field are secure.
Define the requirements for long term archiving and recovery of data looking forward
•
Looking at this list of promises all at once, you might wonder who in their right mind would agree to them. Actually, I am much more sympathetic than it may seem. You must address these topics because they are all key facets of the DW/BI challenge. But if you gave the answers as literally stated, you have lost control of your boundaries. You have taken on far too much, you have made promises you can’t deliver, and your business clients and enterprise bosses have abrogated or avoided key responsibilities that they must own. More seriously, even if you think you can deliver all these promises, you are not in a powerful enough position in your enterprise to make all these results happen.
You don’t have to be a curmudgeon to be a good DW/BI system manager. This isn’t about saying no to every possible responsibility. You will be doing your enterprise a favor by alerting and educating your business users and management to the appropriate boundaries of respon-sibilities. You can still be an enthusiastic advocate, as long as your boundaries are clear. Let’s describe the key boundaries.
Boundaries with the business users
•
. Your job is to find the business users, interview them,and interpret what they tell you into specific DW/BI deliverables. You must assemble a findings document that describes the results of the interviews and how you interpreted what the business users told you. Their responsibility is to be available for the interviews and to put energy into describing how they make decisions. Later in the process, the business users have a responsibility to provide feedback on your findings. You cannot attempt to define business requirements unless the business user community is an equal partner with IT.
Your job is not over after the first round of interviews. You must encourage ongoing busi-ness user feedback and suggestions, and also educate the busibusi-ness users as to the realities of system development. View this as a mutual learning process. In the latter stages of DW/ BI system development, you simply cannot add new KPIs and especially new data sources to the project without slipping the delivery date. You cannot suddenly change a batch-oriented system into a real-time pipeline. Your business users must be understanding and trusting partners of the DW/BI system development, and they have to understand the costs of sudden new requirements. Bottom line—business users must become sophisti-cated observers of the DW/BI development process and know when it is inappropriate to change the scope by adding new KPIs, new data sources, or new real-time requirements. Boundaries with finance.
•
Of the promises you made, several should be the responsibility of finance. You should never agree to implement cost allocations, even if the “profit system” is your main responsibility. Not only are cost allocations very complex, but the assignment of costs to various revenue-producing departments is bad news politically. In this case, finance should work out the logical and political implications of the cost allocations, and you can quietly implement them.The Kimball Group Reader
6
of the month, often cannot be put into an operational context. Again, you need to hand this issue back to finance and wait for a solution from them.
Boundaries across organizations.
•
These days it is hard to find anyone who argues againstintegration of all your data assets under the DW/BI umbrella. But this challenge is 70 per-cent political and only 30 perper-cent technical. Your executives must establish a corporate culture that sends a very clear message to all the separate departments that they must come together to agree on common dimensional attributes, key performance metrics, and calendars. Your executives must lead the way before you can do your job.
Boundaries with legal.
•
In the early ’90s, we often lamented that the data warehouse wasn’t seeing widespread use. Well, now we have the opposite problem. A big piece, shall I say headache, of being taken very seriously is providing adequate security, privacy, archiving, and compliance across the DW/BI system. But you can’t do anything until you understand your enterprise’s policies. You must not define these policies yourself. You can lose your job and go to jail if you get these wrong. Go to your legal department with a list of areas where you need firm guidance.Boundaries with IT.
•
Strangely, one of the most important boundaries you must maintain is with IT. You should be able to rely on other groups within IT for storage (either SAN or networked attached storage), server virtualization, LDAP server maintenance, authentica-tion technologies, and providing new infrastructure such as SOA.Most of us in the DW/BI business are natural salespeople. We are evangelists for the use of our systems because we really believe they will benefit the business. But we need to be conscious of trying to please the client too much. Ultimately, the DW/BI system will be much more successful if all the other parties described in this article are equal, responsible partners.
Tackling DW/BI Design and Development
This group of articles focuses on the big issues that are part of every DW/BI system design.
1.3 Data Wrangling
Ralph Kimball,
DM Review,
Jan 2008
In this article, we are ready to design the first stage of the data pipeline leading from the opera-tional sources to the final BI user interfaces. I call this stage “data wrangling” because we must lasso the data and get it under our control. Successful data wrangling includes change data capture, extraction, data staging, archiving, and the first step of data warehouse compliance. Let’s examine these narrow data wrangling responsibilities.
production source computer or after extraction to a machine owned by the data warehouse. From the data warehousing point of view, the more attractive alternative is doing change data capture at the production source. For this you need cooperation from the production source database administrators (DBAs), adequate processing resources on the production machine, and a very high quality scheme for identifying 100 percent of the changes that have occurred since the previous load.
To design the change data capture system on the production source, you need to have a very candid conversation with the production system DBAs. You need to identify every situation in which a change to source data could happen. These include normal applications posting transactions, special administrative overrides, and emergency scenarios, such as restoration of a data set.
One popular way to look for source data changes is to query a change_date_time field in the source table. This is a pretty strong approach if this field is populated by database triggers that are not circumvented by any process. But many production applications prohibit the use of triggers for performance reasons. Also, how does such an approach handle record deletes? If the record simply vanishes, you won’t find it by querying the change_date_time field. But maybe you can collect the deletes in a separate feed.
Another approach is a special production system daemon that captures every input command by reading the production system transaction log or by intercepting message queue traffic. The daemon approach solves the delete problem but is still vulnerable to special administrative override commands performed manually by the DBAs. Some of you may think such overrides are crazy, but I have seen some very well-run shops resort to doing these overrides occasionally because of weird business rules that are simply too complicated to program into the normal transaction processing applications.
If you have figured out an acceptable scheme for isolating all data changes at the source, you still need to ask for one more favor, if you have any political capital left with the source system DBAs. You need to get a reason code for all changes to the major dimensional entities, such as customer or product. In dimensional modeling parlance, these reason codes will tell you whether the change to an individual dimensional attribute should be treated as a slowly changing dimension (SCD) type 1, 2, or 3. These distinctions are a big deal. The ETL pipelines required to process these three SCD choices are completely different.
If your production system presents too many objections, consider doing change data capture after extraction. Now you must download much larger data sets, perhaps complete dimensions or even complete fact tables. But you are guaranteed to find every change in the source system, as long as you keep a complete prior copy of the source system tables against which to compare.
The Kimball Group Reader
8
If the table you are comparing is very large, the brute force approach of comparing each field can take too long. You can often improve this comparison step by a factor of 10 using a special hash code, called a cyclic redundancy checksum (CRC). For a discussion of this advanced tech-nique, see the discussion of cyclic redundancy check on Wikipedia.
Finally, even if you are sure you have accounted for 100 percent of the source system changes, you should periodically check the DW totals against totals computed directly on the source. This is like balancing your checkbook when you have to manually investigate a discrepancy between the two data sets.
Extraction, whether it occurs before or after change data capture, is the transfer of data from the source system into the DW/BI environment. Besides actually moving the data, you have two main responsibilities in this step. First, you need to rid yourself of all narrowly proprietary data formats during the transfer itself. Change EBCDIC character formatting to ASCII. Unravel all IBM mainframe data formats (e.g., packed decimals and OCCURS statements) into standard relational database management system table and column formats. I also suggest unraveling XML hierarchical structures at this stage, although perhaps at some point XML structures will be fully supported at a semantic level by relational databases.
Your second responsibility is to direct the flow of incoming data either into simple flat files or relational tables. Both choices are equally valid. You can process flat files very efficiently with sort utilities and sequential processing commands like grep and tr. Of course, you will eventually load everything into relational tables for joining and random access operations.
I recommend immediately staging all data received by the DW/BI system. In other words, save the data you just received in the original target format you have chosen before you do anything else to it. I am very conservative. Staging the extracted data means keeping it forever, either offline or online. Data staging is meant to support all the types of backup.
A special form of archiving serves as an important step when you are forced to deal with compliance-sensitive data: proving that the data you received has not been tampered with. In this case, the data staging is augmented with a strong hash code that you use to show that the data has not changed. You should also write this staged data and hash code to permanent media and store this media with a bonded third party who can verify that the data was sent to them on a certain date.
Now that you have wrangled the data into your DW/BI environment, it is time to tame the beast by making the data support the business users’ decision making.
1.4 Myth Busters
Ralph Kimball,
DM Review,
Feb 2008
and misrepresentations about dimensional modeling that have been debunked multiple times. It is time (once again) to address these myths.
Myth: A dimensional view could be missing key relationships that exist only in a true relational view.
Myth buster: This is perhaps the best place to start debunking dimensional modeling misrep-resentations and myths. A dimensional model contains all the data relationships that a normal-ized model contains. There is no data relationship expressible in a normalnormal-ized model that cannot be expressed in a dimensional model. Note that dimensional models are fully relational. Fact tables are generally in third normal form and dimension tables are generally in second normal form. The major difference between the two approaches is that the many-to-one relationships in the dimensions have been denormalized to flatten the dimensions for user understandability and query performance. But all the data relationships and data content are otherwise identical.
Myth: A very real issue with a dimensional enterprise data model (EDM) is the possibility that the model may not be extensible and easily accommodate changing business needs. Although a logical representation of the business can be achieved using dimensional structures, using these structures could have negative effects on extensibility and industry data integration.
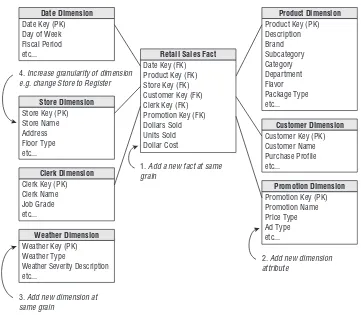
Myth buster: This myth about extensibility is a strange one; dimensional models are signifi-cantly more robust than normalized models when data relationships change. For more than 10 years, we have been teaching the “graceful extensibility” of dimensional models. Five types of change have no effect on the business intelligence applications running on dimensional models:
1. Adding a new dimension to a fact table 2. Adding a new fact to a fact table
3. Adding a new dimension attribute to a dimension table
4. Altering the relationship of two dimension attributes to form a hierarchy (many-to-one relationship)
5. Increasing the granularity of a dimension
In the normalized world, such changes often involve altering the relationship between sepa-rate tables. Altering the relationship between tables exposed to the BI tools forces recoding of applications. With dimensional models, the applications keep on running without the need to recode because the dimensional schemas are inherently more robust when confronted with new content and new business rules.
Myth: A dimensional model by its definition is built to address a very specific business need. Relational modeling mimics business processes, while dimensional modeling captures how people monitor their business.
The Kimball Group Reader
10
carefully understand the grain of the physical measurement event and to faithfully attach facts and dimensions to that event that are “true to the grain.” A dimensional model satisfies a business requirement only if the business happens to need the measurement events represented in the fact table. The format and content of a dimensional model has no dependence on a final report desired by the business users because it is determined only by the physics of the measurement process. A dimensional model is never crafted to meet the needs of a specific department, but rather is a single representation of a business process that looks the same to all observers.
Myth: In a dimensional model, usually only one date is associated with time. The other dates (e.g., in an order) are not captured, and, therefore, valuable data can be lost.
Myth buster: If you understand the previous myth buster, then you can appreciate that a measurement involving a line item on an order will naturally expose many dates. Each of these dates is represented by a foreign key to a copy or view of the date dimension. I first described this technique of using dimension “roles” in article 9.8, Data Warehouse Role Models. Role playing dimensions are an old standard dimensional modeling technique we have described hundreds of times.
Myth: Relational is preferred because an EDM should capture data at a very low granular level— preferably individual transactions.
Myth buster: From the very beginning, I have urged designers to capture measurement events in fact tables at the lowest possible (e.g., transaction) grain. In my 1996 book, The Data Warehouse Toolkit, I wrote, “A data warehouse almost always demands data expressed at the lowest possible grain of each dimension, not because queries want to see individual records, but because queries need to cut through the database in very precise ways.” If we have consistently urged dimensional models to be built at the most expressive granular grain for the past 11 years, through 300,000 books, more than 250 articles, and 10,000 students in our classes, where do people come up with myths like this?
Stepping back from these specific myths, I urge you to think critically. When you read or hear strong statements, circle around the issues and educate yourself. Challenge the assumptions. Look for defendable positions, detailed logic, and clear thinking. I expect to be held to such high standards, and I hope you will do the same to others.
1.5 Dividing the World
Ralph Kimball,
DM Review,
Mar 2008
In the last four DM Review articles, I laid a solid foundation for building a data warehouse. We have done a careful job of gathering all the overlapping design constraints; we have established a good set of boundaries with all the groups we interact with; we have captured a perfect subset of changed data to feed our data extraction; and we have described common misunderstandings about dimensional models.
and calendars. Facts are the numeric measurements or observations gathered by all of our transac-tion processing systems and other systems. Business users instinctively understand the difference between dimensions and facts. When we deliver data to the BI tools, we take great care to make dimensions and facts visible at the user interface level in order to exploit the users’ understand-ing and familiarity with these concepts. Perhaps another way to say this is the dimensional data warehouse is the platform for BI.
Dimensions and facts drive the user interface experience in the BI tools. Dimensions are overwhelmingly the target for constraints and the source of “row headers” in the BI tool results. Facts are overwhelmingly the grist for computations. Separating the dimensions and facts struc-turally in the data is very helpful because it encourages consistency in application development and the BI tool user interfaces.
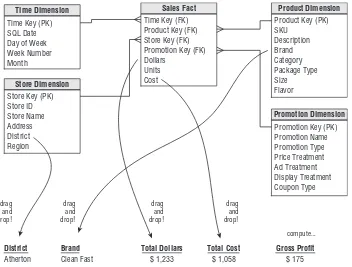
Dividing the world of data into dimensions and facts is a fundamental and powerful idea. Ninety-eight percent of all data items are immediately and obviously categorized as one or the other. Discrete textual data items that describe the attributes of our stable entities belong to dimensions. Repeated numeric measurements whose values are not fully predictable are facts. Thus, if we sell a red ballpoint pen for $1.79, then “red” is an attribute in the ballpoint pen row in the product dimension, and $1.79 is an observed fact.
The foundation of the data warehouse is the measurement event that produces a fact record. This is a very physical, tangible result. A fact record exists if and only if a measurement event takes place. This physical result is used by the data warehouse designer to make sure that the design sits on solid rock. When we describe the measurement in physical, real-world terms, we call this the grain of the fact table. If you are quite sure of the grain, you will have a relatively easy time designing the fact table. That is why I keep telling students to “keep to the grain.”
When a measurement event creates a fact record, we scramble to attach contemporary ver-sions of all the relevant dimensional entities to this fact record. When we sell the red ballpoint pen for $1.79, the flash bulb goes off, and from this snapshot we assemble an impressive set of dimensional entities, including customer, product, store location, employee (cashier), employee (store manager), marketing promotion, calendar, and maybe even the weather. We are careful to use up-to-date versions of the dimensions so that we are describing this sales measurement event correctly. Notice that the grain of this measurement is the cash register “beep” when the item is scanned. Later in the design process, we implement this grain with various foreign keys connecting to the dimensions, but we don’t start the design process with the keys. We start with the physical event.
The Kimball Group Reader
12
Whenever possible, we strive to make facts additive. In other words, it makes sense to add the fact across records. In our retail sales example, although the price is true to the grain, it is not additive. But if we instead store the extended price (unit price multiplied by quantity sold) and the quantity sold, then both these facts are additive. We can instantaneously recover the unit price with a simple division. Forcing facts to be additive whenever possible seems like a small point, but it is one of the many ways we make our BI platform simple. Like the famous Japanese auto manufacturer example of quality, a thousand little improvements eventually become a sus-tainable strategic advantage. Conversely, a thousand little “gadgets” shoehorned into a database to make certain queries simpler will produce an unworkable, unmaintainable design.
In a similar vein, we resist taking normalized data models all the way into the BI environment. Normalized data models are essential for efficient transaction processing, and are helpful for storing data after the data has been cleaned. But normalized models are not understandable by business users. Before you lapse into religious wars with your colleagues, please recognize that when correctly designed, normalized models and dimensional models contain exactly the same data and reflect exactly the same business rules. Any and all data relationships can be accurately represented using either methodology. Thus, the reason for using dimensional models is that they form a proven, workable basis for BI.
Earlier in this article, I stated that 98 percent of all data items are immediately and obvi-ously categorized as either a fact or a dimension attribute. What about the remaining 2 percent? Perhaps you have been thinking that in our retail sales example the price of the product should actually be in the product dimension, not in the fact table. In my opinion, upon a little reflection, this is an easy choice. Because the price of a product often varies over time and over location, it becomes very cumbersome to model the price as a dimension attribute. It should be a fact. But it is normal to recognize this rather late in the design process.
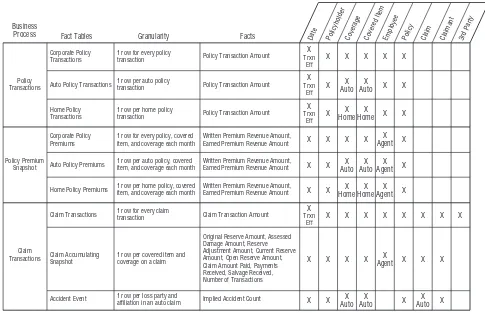
A more ambiguous example is the limit on coverage within an automobile insurance policy. The limit is a numerical data item, perhaps $300,000 for collision liability. The limit may not change over the life of the policy, or it changes very infrequently. Furthermore, many queries would group or constrain on this limit data item. This sounds like a slam dunk for the limit being an attribute in the coverage dimension. But the limit is a numeric observation, and it can change over time, albeit slowly. One could pose some important queries summing or averaging all the limits on many policies and coverages. This sounds like a slam dunk for the limit being a numeric fact in a fact table.
Rather than agonizing over the dimension versus fact choice, simply model it both ways! Include the limit in the coverage dimension so that it participates in the usual way as a target for constraints and the content for row headers, but also put the limit in the fact table so it can participate in the usual way within complex computations.
1.6 Essential Steps for the Integrated Enterprise
Data Warehouse
Ralph Kimball,
DM Review,
Apr 2008 and May 2008
This content was originally published as two consecutive articles in the DM Review series.
In this article, I propose a specific architecture for building an integrated enterprise data ware-house (EDW). This architecture directly supports master data management (MDM) efforts and provides the platform for consistent business analysis across the enterprise. I describe the scope and challenges of building an integrated EDW, and provide detailed guidance for designing and administering the necessary processes that support integration. This article has been written in response to a lack of specific guidance in the industry as to what an integrated EDW actually is and what necessary design elements are needed to achieve integration.
What Does an Integrated EDW Deliver?
The mission statement for the integrated EDW is to provide the platform for business analysis to be applied consistently across the enterprise. Above all, this mission statement demands consistency across business process subject areas and their associated databases. Consistency requires:
Detailed textual descriptions of entities such as customers, products, locations, and
cal-•
endars be applied uniformly across subject areas, using standardized data values. This is a fundamental tenet of MDM.
Aggregated groupings such as types, categories, flavors, colors, and zones defined within
•
entities have the same interpretations across subject areas. This can be viewed as a higher level requirement on the textual descriptions.
Constraints posed by business intelligence applications, which attempt to harvest the value
•
of consistent text descriptions and groupings, be applied with identical application logic across subject areas. For instance, constraining on a product category should always be driven from a field named “category” found in the product dimension.
Numeric facts be represented consistently across subject areas so that it makes sense to
•
combine them in computations and compare them to each other, perhaps with ratios or differences. For example, if revenue is a numeric fact reported from multiple subject areas, the definitions of each of these revenue instances must be the same.
International differences in languages, location descriptions, time zones, currencies, and
•
business rules be resolved to allow all of the previous consistency requirements to be achieved.
Auditing, compliance, authentication, and authorization functions be applied in the same
•
way across subject areas.
Coordination with industry standards be adopted for data content, data exchange, and