presenting the material in an engaging manner, it provides students with a comfortable way to learn an otherwise cumbersome subject. The explanation of the topics is presented in a manner comprehensible to students of all levels.”
— Ariana Anderson, Teaching Fellow/PhD candidate in Statistics, UCLA
“Head First Statistics is deceptively friendly. Breeze through the explanations and exercises and you just may find yourself raising the topic of normal vs. Poisson distribution in ordinary social conversation, which I can assure you is not advised!”
— Gary Wolf, Contributing Editor, Wired Magazine
“Dawn Griffiths has split some very complicated concepts into much smaller, less frightening, bits of stuff that real-life people will find very easy to digest. Lots of graphics and photos make the material very approachable, and I have developed quite a crush on the attractive lady model who is asking about gumballs on page 458.”
— Bruce Frey, author of Statistics Hacks
“Head First is an intuitive way to understand statistics using simple, real-life examples that make learning fun and natural.”
— Michael Prerau, computational neuroscientist and statistics instructor, Boston University
“Thought Head First was just for computer nerds? Try the brain-friendly way with statistics and you’ll change your mind. It really works.”
— Andy Parker
“This book is a great way for students to learn statistics—it is entertaining, comprehensive, and easy to understand. A perfect solution!”
— Danielle Levitt
“Down with dull statistics books! Even my cat liked this one.”
Praise for other
Head First
books
“Kathy and Bert’s Head First Java transforms the printed page into the closest thing to a GUI you’ve ever seen. In a wry, hip manner, the authors make learning Java an engaging ‘what’re they gonna do next?’ experience.”
—Warren Keuffel, Software Development Magazine
“Beyond the engaging style that drags you forward from know-nothing into exalted Java warrior status, Head First Java covers a huge amount of practical matters that other texts leave as the dreaded “exercise for the reader...” It’s clever, wry, hip and practical—there aren’t a lot of textbooks that can make that claim and live up to it while also teaching you about object serialization and network launch protocols. ”
—Dr. Dan Russell, Director of User Sciences and Experience Research
IBM Almaden Research Center (and teaches Artificial Intelligence at Stanford University)
“It’s fast, irreverent, fun, and engaging. Be careful—you might actually learn something!”
—Ken Arnold, former Senior Engineer at Sun Microsystems
Co-author (with James Gosling, creator of Java), The Java Programming Language
“I feel like a thousand pounds of books have just been lifted off of my head.”
—Ward Cunningham, inventor of the Wiki and founder of the Hillside Group
“Just the right tone for the geeked-out, casual-cool guru coder in all of us. The right reference for practi-cal development strategies—gets my brain going without having to slog through a bunch of tired stale professor-speak.”
—Travis Kalanick, Founder of Scour and Red Swoosh Member of the MIT TR100
“There are books you buy, books you keep, books you keep on your desk, and thanks to O’Reilly and the Head First crew, there is the penultimate category, Head First books. They’re the ones that are dog-eared, mangled, and carried everywhere. Head First SQL is at the top of my stack. Heck, even the PDF I have for review is tattered and torn.”
— Bill Sawyer, ATG Curriculum Manager, Oracle
“This book’s admirable clarity, humor and substantial doses of clever make it the sort of book that helps even non-programmers think well about problem-solving.”
— Cory Doctorow, co-editor of Boing Boing Author, Down and Out in the Magic Kingdom
fun, but they cover a lot of ground and they are right to the point. I’m really impressed.”
— Erich Gamma, IBM Distinguished Engineer, and co-author of Design Patterns
“One of the funniest and smartest books on software design I’ve ever read.”
— Aaron LaBerge, VP Technology, ESPN.com
“What used to be a long trial and error learning process has now been reduced neatly into an engaging paperback.”
— Mike Davidson, CEO, Newsvine, Inc.
“Elegant design is at the core of every chapter here, each concept conveyed with equal doses of pragmatism and wit.”
— Ken Goldstein, Executive Vice President, Disney Online
“I ♥ Head First HTML with CSS & XHTML—it teaches you everything you need to learn in a ‘fun coated’ format.”
— Sally Applin, UI Designer and Artist
“Usually when reading through a book or article on design patterns, I’d have to occasionally stick myself in the eye with something just to make sure I was paying attention. Not with this book. Odd as it may sound, this book makes learning about design patterns fun.
“While other books on design patterns are saying ‘Buehler… Buehler… Buehler…’ this book is on the float belting out ‘Shake it up, baby!’”
— Eric Wuehler
“I literally love this book. In fact, I kissed this book in front of my wife.”
Other related books from O’Reilly
Statistics HacksTM
Statistics in a Nutshell
Mind HacksTM
Mind Performance HacksTM
Your Brain: The Missing Manual
Other books in O’Reilly’s Head First series
Head First JavaTM
Head First Object-Oriented Analysis and Design (OOA&D)
Head First HTML with CSS and XHTML
Head First Design Patterns
Head First Servlets and JSP
Head First EJB
Head First PMP
Head First SQL
Head First Software Development
Head First JavaScript
Head First Ajax
Head First Physics
Head First PHP & MySQL (2008)
Head First Rails (2008)
Head First Web Design (2008)
Head First Algebra (2008)
Dawn Griffiths
Head First
Statistics
Wouldn’t it be dreamy if there was a statistics book that was more fun than an overdue trip to the dentist? But it’s probably
Head First Statistics
by Dawn Griffiths
Copyright © 2009 O’Reilly Media, Inc. All rights reserved.
Printed in the United States of America.
Published by O’Reilly Media, Inc., 1005 Gravenstein Highway North, Sebastopol, CA 95472.
O’Reilly Media books may be purchased for educational, business, or sales promotional use. Online editions are also available for most titles (safari.oreilly.com). For more information, contact our corporate/institutional sales department: (800) 998-9938 or [email protected].
Series Creators: Kathy Sierra, Bert Bates
Series Editor: Brett D. McLaughlin
Editor: Sanders Kleinfeld
Design Editor: Louise Barr
Cover Designers: Louise Barr, Steve Fehler
Production Editor: Brittany Smith
Indexer: Julie Hawks
Page Viewers: David Griffiths, Mum and Dad
Printing History:
August 2008: First Edition.
The O’Reilly logo is a registered trademark of O’Reilly Media, Inc. The Head First series designations, Head First Statistics, and related trade dress are trademarks of O’Reilly Media, Inc.
Many of the designations used by manufacturers and sellers to distinguish their products are claimed as trademarks. Where those designations appear in this book, and O’Reilly Media, Inc., was aware of a trademark claim, the designations have been printed in caps or initial caps.
While every precaution has been taken in the preparation of this book, the publisher and the authors assume no responsibility for errors or omissions, or for damages resulting from the use of the information contained herein.
No snorers were harmed in the making of this book, although a horse lost its toupee at one point and suffered a minor indignity in front of the other horses. Also a snowboarder picked up a few bruises along the way, but nothing serious.
ISBN: 978-0-596-52758-7
David
Mum and Dad
This book uses RepKover™, a durable and flexible lay-flat binding.
Author of Head First Statistics
Dawn Griffiths
started life as a mathematician at a top UK university. She was awarded a First-Class Honours degree in Mathematics, but she turned down a PhD scholarship studying particularly rare breeds of differential equations when she realized people would stop talking to her at parties. Instead she pursued a career in software development, and she currently combines IT consultancy with writing and mathematics. When Dawn’s not working on Head First books, you’ll find her honing her Tai Chi skills, making bobbin lace or cooking nice meals. She hasn’t yet mastered the art of doing all three at the same time. She also enjoys traveling, and spending time with her lovely husband, David.Dawn has a theory that Head First Bobbin
Lacemaking might prove to a be a big cult hit, but she suspects that Brett and Laurie might disagree.
Dawn Griffiths
Table of Contents (Summary)
Table of Contents (the real thing)
Your brain on statistics.
Here you are trying to learn something, while here your brain is doing you a favor by making sure the learning doesn’t stick. Your brain’s thinking, “Better leave room for more important things, like which wild animals to avoid and whether naked snowboarding is a bad idea.” So how do you trick your brain into thinking that your life depends on knowing statistics?Intro
Who is this book for? xxviii
We know what you’re thinking xxix
Metacognition xxxi
Bend your brain into submission xxxiii
Read me xxxiv
The technical review team xxxvi
Intro xxvii
1 Visualizing Information: First Impressions 1
2 Measuring Central Tendency: The Middle Way 45
3 Measuring Spread: Power Ranges 83
4 Calculating Probabilities: Taking Chances 127
5 Discrete Probability Distributions: Manage Your Expectations 197
6 Permutations and Combinations: Making Arrangements 241
7 Geometric, Binomial, and Poisson Distributions: Keeping Things Discrete 269 8 Normal Distribution: Being Normal 325
9 Normal Distribution Part II: Beyond Normal 361
10 Using Statistical Sampling: Taking Samples 415 11 Estimating Your Population: Making Predictions 441
12 Constructing Confidence Intervals: Guessing with Confidence 487
13 Using Hypothesis Tests: Look at the Evidence 521 14 The Chi Square Distribution: There’s Something Going on 567
15 Correlation and Regression: What’s My Line? 605
i Appendix i: Top Ten Things We Didn’t Cover 643
table of contents
Statistics are everywhere 2
But why learn statistics? 3
A tale of two charts 4
The humble pie chart 8
Bar charts can allow for more accuracy 10
Vertical bar charts 10
Horizontal bar charts 11
It’s a matter of scale 12
Using frequency scales 13
Dealing with multiple sets of data 14
Categories vs. numbers 18
Dealing with grouped data 19
Make a histogram 20
Step 1: Find the bar widths 26
Step 2: Find the bar heights 27
Step 3: Draw your chart 28
Introducing cumulative frequency 34
Drawing the cumulative frequency graph 35
Choosing the right chart 39
First Impressions
1
visualizing information
Can’t tell your facts from your figures?
Statistics help you make sense of confusing sets of data. They make the
complex simple. And when you’ve found out what’s really going on, you
need a way of visualizing it and telling everyone else. So if you want to
pick the best chart for the job, grab your coat, pack your best slide rule, and
join us on a ride to Statsville.
No, this
Jul Aug Sep Oct Nov 0.5
The Middle Way
Sometimes you just need to get to the heart of the matter.
It can be difficult to see patterns and trends in a big pile of figures, and finding the
average is often the first step towards seeing the bigger picture. With averages at
your disposal, you’ll be able to quickly find the most representative values in your
data and draw important conclusions. In this chapter, we’ll look at several ways to
calculate one of the most important statistics in town—mean, median, and mode—
and you’ll start to see how to effectively summarize data as concisely and usefully
as possible.
measuring central tendency
2
Welcome to the Health Club 46
A common measure of average is the mean 47
Mean math 48
Dealing with unknowns 49
Back to the mean 50
Back to the Health Club 53
Everybody was Kung Fu fighting 54
Our data has outliers 57
The outliers did it 58
Watercooler conversation 60
Finding the median 61
How to find the median in three steps: 62
Business is booming 65
The Little Ducklings swimming class 66
What went wrong with the mean and median? 69
What should we do for data like this? 69
The Mean Exposed 71
Introducing the mode 73
Three steps for finding the mode 74 Age 21
Age 20
Age 20
table of contents
Wanted: one player 84
We need to compare player scores 85
Use the range to differentiate between data sets 86
The problem with outliers 89
We need to get away from outliers 91
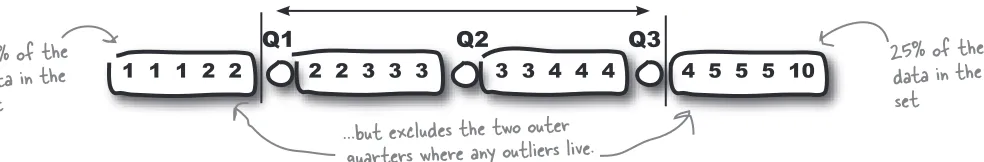
Quartiles come to the rescue 92
The interquartile range excludes outliers 93
Quartile anatomy 94
We’re not just limited to quartiles 98
So what are percentiles? 99
Box and whisker plots let you visualize ranges 100
Variability is more than just spread 104
Calculating average distances 105
We can calculate variation with the variance… 106
…but standard deviation is a more intuitive measure 107
Standard Deviation Exposed 108
A quicker calculation for variance 113
What if we need a baseline for comparison? 118
Use standard scores to compare values across data sets 119
Interpreting standard scores 120
Statsville All Stars win the league! 125
Power Ranges
3
Not everything’s reliable, but how can you tell?
Averages do a great job of giving you a typical value in your data set, but they don’t
tell you the full story. OK, so you know where the center of your data is, but often
the mean, median, and mode alone aren’t enough information to go on when you’re
summarizing a data set. In this chapter, we’ll show you how to take your data skills
to the next level as we begin to analyze ranges and variation.
measuring variability and spread
All three players have the same average score for shooting, but I need some way of choosing between them.
Fat Dan’s Grand Slam 128
Roll up for roulette! 129
What are the chances? 132
Find roulette probabilities 135
You can visualize probabilities with a Venn diagram 136
You can also add probabilities 142
Exclusive events and intersecting events 147
Problems at the intersection 148
Some more notation 149
Another unlucky spin… 155
Conditions apply 156
Find conditional probabilities 157
Trees also help you calculate conditional probabilities 159
Handy hints for working with trees 161
Step 1: Finding P(Black Even) 167
Step 2: Finding P(Even) 169
Step 3: Finding P(Black l Even) 170
Use the Law of Total Probability to find P(B) 172
Introducing Bayes’ Theorem 173
If events affect each other, they are dependent 181
If events do not affect each other, they are independent 182
More on calculating probability for independent events 183
Taking Chances
Life is full of uncertainty.
Sometimes it can be impossible to say what will happen from one minute to the
next. But certain events are more likely to occur than others, and that’s where
probability theory comes into play. Probability lets you predict the future by
assessing how likely outcomes are, and knowing what could happen helps you
make informed decisions. In this chapter, you’ll find out more about probability
and learn how to take control of the future!
calculating probabilities
table of contents
Back at Fat Dan’s Casino 198
We can compose a probability distribution for the slot machine 201
Expectation gives you a prediction of the results… 204
…and variance tells you about the spread of the results 205
Variances and probability distributions 206
Let’s calculate the slot machine’s variance 207
Fat Dan changed his prices 212
There’s a linear relationship between E(X) and E(Y) 217
Slot machine transformations 218
General formulas for linear transforms 219
Every pull of the lever is an independent observation 222
Observation shortcuts 223
New slot machine on the block 229
Add E(X) and E(Y) to get E(X + Y)… 230
…and subtract E(X) and E(Y) to get E(X – Y) 231
You can also add and subtract linear transformations 232
Jackpot! 238
Manage Your Expectations
5
Unlikely events happen, but what are the consequences?
So far we’ve looked at how probabilities tell you how likely certain events are. What
probability doesn’t tell you is the overall impact of these events, and what it means to you. Sure, you’ll sometimes make it big on the roulette table, but is it really worth it
with all the money you lose in the meantime? In this chapter, we’ll show you how you
can use probability to predict long-term outcomes, and also measure the certainty
of these predictions.
The Statsville Derby 242
It’s a three-horse race 243
How many ways can they cross the finish line? 245
Calculate the number of arrangements 246
Going round in circles 247
It’s time for the novelty race 251
Arranging by individuals is different than arranging by type 252
We need to arrange animals by type 253
Generalize a formula for arranging duplicates 254
It’s time for the twenty-horse race 257
How many ways can we fill the top three positions? 258
Examining permutations 259
What if horse order doesn’t matter 260
Examining combinations 261
Combination Exposed 262
Does order really matter? 262
It’s the end of the race 268
Making Arrangements
Sometimes, order is important.
Counting all the possible ways in which you can order things is time
consuming, but the trouble is, this sort of information is crucial for
calculating some probabilities. In this chapter, we’ll show you a quick way
of deriving this sort of information without you having to figure out what all
of the possible outcomes are. Come with us and we’ll show you how to
count the possibilities.
permutations and combinations
table of contents
Ouch! Rock! Ouch! Flag! Ouch! Tree!
Keeping Things Discrete
7
Calculating probability distributions takes time.
So far we’ve looked at how to calculate and use probability distributions, but wouldn’t it be
nice to have something easier to work with, or just quicker to calculate? In this chapter,
we’ll show you some special probability distributions that follow very definite patterns.
Once you know these patterns, you’ll be able to use them to calculate probabilities,
expectations, and variances in record time. Read on, and we’ll introduce you to the
geometric, binomial and Poisson distributions.
geometric, binomial, and poisson distributions
We need to find Chad’s probability distribution 273
There’s a pattern to this probability distribution 274
The probability distribution can be represented algebraically 277
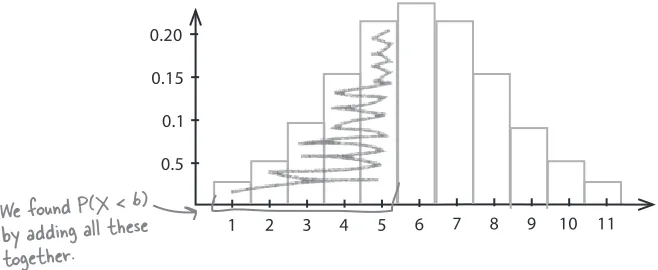
The geometric distribution also works with inequalities 279
The pattern of expectations for the geometric distribution 280
Expectation is 1/p 281
Finding the variance for our distribution 283
A quick guide to the geometric distribution 284
Who Wants to Win a Swivel Chair! 287
You’ve mastered the geometric distribution 287
Should you play, or walk away? 291
Generalizing the probability for three questions 293
Let’s generalize the probability further 296
What’s the expectation and variance? 298
Binomial expectation and variance 301
Your quick guide to the binomial distribution 302
Expectation and variance for the Poisson distribution 308
So what’s the probability distribution? 312
Combine Poisson variables 313
The Poisson in disguise 316
Your quick guide to the Poisson distribution 319
Discrete data takes exact values… 326
…but not all numeric data is discrete 327
What’s the delay? 328
We need a probability distribution for continuous data 329
Probability density functions can be used for continuous data 330
Probability = area 331
To calculate probability, start by finding f(x)… 332
…then find probability by finding the area 333
We’ve found the probability 337
Searching for a soul mate 338
Male modelling 339
The normal distribution is an “ideal” model for continuous data 340
So how do we find normal probabilities? 341
Three steps to calculating normal probabilities 342
Step 1: Determine your distribution 343
Step 2: Standardize to N(0, 1) 344
To standardize, first move the mean… 345
…then squash the width 345
Now find Z for the specific value you want to find probability for 346
Step 3: Look up the probability in your handy table 349
Being Normal
Discrete probability distributions can’t handle every situation.
So far we’ve looked at probability distributions where we’ve been able to specify exact
values, but this isn’t the case for every set of data. Some types of data just don’t fit the
probability distributions we’ve encountered so far. In this chapter, we’ll take a look at
how continuous probability distributions work, and introduce you to one of the most
important probability distributions in town—the normal distribution.
using the normal distribution
table of contents
Beyond Normal
9
If only all probability distributions were normal.
Life can be so much simpler with the normal distribution. Why spend all your time working out individual probabilities when you can look up entire ranges in one swoop, and
still leave time for game play? In this chapter, you’ll see how to solve more complex
problems in the blink of an eye, and you’ll also find out how to bring some of that normal
goodness to other probability distributions.
using the normal distribution ii
All aboard the Love Train 363
Normal bride + normal groom 364
It’s still just weight 365
How’s the combined weight distributed? 367
Finding probabilities 370
More people want the Love Train 375
Linear transforms describe underlying changes in values… 376
…and independent observations describe how many values you have 377
Expectation and variance for independent observations 378
Should we play, or walk away? 383
Normal distribution to the rescue 386
When to approximate the binomial distribution with the normal 389
Revisiting the normal approximation 394
The binomial is discrete, but the normal is continuous 395
Apply a continuity correction before calculating the approximation 396
The Normal Distribution Exposed 404
All aboard the Love Train 405
When to approximate the binomial distribution with the normal 407
A runaway success! 413
Each adult is an independent observation of X.
Taking Samples
Statistics deal with data, but where does it come from?
Some of the time, data’s easy to collect, such as the ages of people attending a health
club or the sales figures for a games company. But what about the times when data isn’t
so easy to collect? Sometimes the number of things we want to collect data about are so
huge that it’s difficult to know where to start. In this chapter, we’ll take a look at how you
can effectively gather data in the real world, in a way that’s efficient, accurate, and can
also save you time and money to boot. Welcome to the world of sampling.
using statistical sampling
10
The Mighty Gumball taste test 416
They’re running out of gumballs 417
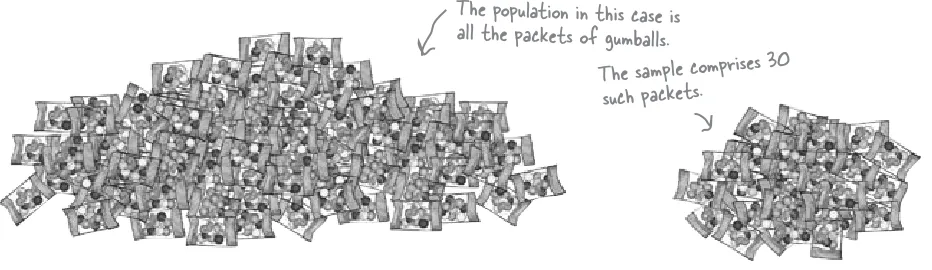
Test a gumball sample, not the whole gumball population 418
How sampling works 419
When sampling goes wrong 420
How to design a sample 422
Define your sampling frame 423
Sometimes samples can be biased 424
Sources of bias 425
How to choose your sample 430
Simple random sampling 430
How to choose a simple random sample 431
There are other types of sampling 432
We can use stratified sampling... 432
...or we can use cluster sampling... 433
...or even systematic sampling 433
Mighty Gumball has a sample 439
table of contents
Making Predictions
11
Wouldn’t it be great if you could tell what a population was
like, just by taking one sample?
Before you can claim full sample mastery, you need to know how to use your samples
to best effect once you’ve collected them. This means using them to accurately predict
what the population will be like and coming up with a way of saying how reliable your
predictions are. In this chapter, we’ll show you how knowing your sample helps you
get to know your population, and vice versa.
estimating your population
So how long does flavor really last for? 442
Let’s start by estimating the population mean 443
Point estimators can approximate population parameters 444
Let’s estimate the population variance 448
We need a different point estimator than sample variance 449
Which formula’s which? 451
It’s a question of proportion 454
So how does this relate to sampling? 459
The sampling distribution of proportions 460
So what’s the expectation of P
s? 462
And what’s the variance of P
s? 463
Find the distribution of P
s 464
P
s follows a normal distribution 465
We need probabilities for the sample mean 471
The sampling distribution of the mean 472
Find the expectation for X 474
What about the the variance of X? 476
So how is X distributed? 480
If n is large, X can still be approximated by the normal distribution 481
Guessing with Confidence
Sometimes samples don’t give quite the right result.
You’ve seen how you can use point estimators to estimate the precise value of the
population mean, variance, or proportion, but the trouble is, how can you be certain that
your estimate is completely accurate? After all, your assumptions about the population
rely on just one sample, and what if your sample’s off? In this chapter, you’ll see another
way of estimating population statistics, one that allows for uncertainty. Pick up your
probability tables, and we’ll show you the ins and outs of confidence intervals.
constructing confidence intervals
12
Mighty Gumball is in trouble 488
The problem with precision 489
Introducing confidence intervals 490
Four steps for finding confidence intervals 491
Step 1: Choose your population statistic 492
Step 2: Find its sampling distribution 492
Step 3: Decide on the level of confidence 494
Step 4: Find the confidence limits 496
Start by finding Z 497
Rewrite the inequality in terms of m 498
Finally, find the value of X 501
You’ve found the confidence interval 502
Let’s summarize the steps 503
Handy shortcuts for confidence intervals 504
Step 1: Choose your population statistic 508
Step 2: Find its sampling distribution 509
Step 3: Decide on the level of confidence 512
Step 4: Find the confidence limits 513
table of contents
13
Not everything you’re told is absolutely certain.
The trouble is, how do you know when what you’re being told isn’t right? Hypothesis tests give you a way of using samples to test whether or not statistical claims are likely to be true. They give you a way of weighing the evidence and testing whether extreme results can be explained by mere coincidence, or whether there are darker forces at work. Come with us on a ride through this chapter, and we’ll show you how you can use
hypothesis tests to confirm or allay your deepest suspicions.
Statsville’s new miracle drug 522
Resolving the conflict from 50,000 feet 526
The six steps for hypothesis testing 527
Step 1: Decide on the hypothesis 528
Step 2: Choose your test statistic 531
Step 3: Determine the critical region 532
Step 4: Find the p-value 535
Step 5: Is the sample result in the critical region? 537
Step 6: Make your decision 537
What if the sample size is larger? 540
Let’s conduct another hypothesis test 543
Step 1: Decide on the hypotheses 543
Step 2: Choose the test statistic 544
Use the normal to approximate the binomial in our test statistic 547
Step 3: Find the critical region 548
Let’s start with Type I errors 556
What about Type II errors? 557
Finding errors for SnoreCull 558
We need to find the range of values 559
Find P(Type II error) 560
Sometimes things don’t turn out quite the way you expect.
When you model a situation using a particular probability distribution, you have a
good idea of how things are likely to turn out long-term. But what happens if there are
differences between what you expect and what you get? How can you tell whether
your discrepancies come down to normal fluctuations, or whether they’re a sign of
an underlying problem with your probability model instead? In this chapter, we’ll
show you how you can use the χ2 distribution to analyze your results and sniff out
suspicious results.
14
There may be trouble ahead at Fat Dan’s Casino 568
Let’s start with the slot machines 569
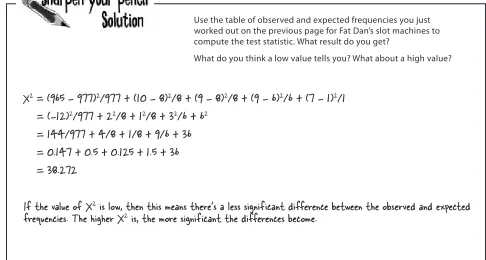
The 2 test assesses difference 571
So what does the test statistic represent? 572
Two main uses of the 2 distribution 573
represents degrees of freedom 574
What’s the significance? 575
Hypothesis testing with 2 576
You’ve solved the slot machine mystery 579
Fat Dan has another problem 585
The 2 distribution can test for independence 586
You can find the expected frequencies using probability 587
So what are the frequencies? 588
We still need to calculate degrees of freedom 591
Generalizing the degrees of freedom 596
And the formula is... 597
You’ve saved the casino 599
There’s Something Going On…
table of contents
15
Have you ever wondered how two things are connected?
So far we’ve looked at statistics that tell you about just one variable—like men’s height,
points scored by basketball players, or how long gumball flavor lasts—but there are other
statistics that tell you about the connection between variables. Seeing how things are
connected can give you a lot of information about the real world, information that you can
use to your advantage. Stay with us while we show you the key to spotting connections:
correlation and regression.
Let’s analyze sunshine and attendance 607
Exploring types of data 608
Visualizing bivariate data 609
Scatter diagrams show you patterns 612
Correlation vs. causation 614
Predict values with a line of best fit 618
Your best guess is still a guess 619
We need to minimize the errors 620
Introducing the sum of squared errors 621
Find the equation for the line of best fit 622
Finding the slope for the line of best fit 623
Finding the slope for the line of best fit, continued 624
We’ve found b, but what about a? 625
You’ve made the connection 629
Let’s look at some correlations 630
The correlation coefficient measures how well the line fits the data 631
There’s a formula for calculating the correlation coefficient, r 632
Find r for the concert data 633
Find r for the concert data, continued 634
What’s My Line?
correlation and regression
Feel that funky rhythm, baby.
#1. Other ways of presenting data 644
#2. Distribution anatomy 645
#3. Experiments 646
#4. Least square regression alternate notation 648
#5. The coefficient of determination 649
#6. Non-linear relationships 650
#7. The confidence interval for the slope of a regression line 651
#8. Sampling distributions - the difference between two means 652
#9. Sampling distributions - the difference between two proportions 653
#10. E(X) and Var(X) for continuous probability distributions 654
i
The Top Ten Things (we didn’t cover)
leftovers
Even after all that, there’s a bit more.
There are just a few more things we think you need to know. We wouldn’t feel right about ignoring them,even though they only need a brief mention. So before you put the book down,
take a read through these short but important statistics tidbits.
ii
Looking Things up
statistics tables
Where would you be without your trusty probability tables?
Understanding your probability distributions isn’t quite enough. For some of them, you
need to be able to look up your probabilities in standard probability tables. In this
appendix you’ll find tables for the normal, t and Χ2 distributions so you can look up
probabilities to your heart’s content.
Standard normal probabilities 658
t-distribution critical values 660
Intro
In this section we answer the burning ques
tion: “So
why DID they put that in a Statistics book?”
I can’t believe they put
that
in ahow to use this book
Who is this book for?
Who should probably back away from this book?
If you can answer “yes” to all of these:If you can answer “yes” to any of these: this book is for you.
this book is not for you.
[Note from marketing: this book is
for anyone with a credit card.]
Do you need to understand statistics for a course, for your line of work, or just because you think it’s about time you learned what standard deviation means or
how to find the probability of winning at roulette? 1
1
Do you want to learn, understand, and remember how to use probability and statistics to get the right results, every time?
2 2
Do you prefer stimulating dinner party conversation to dry, dull, academic lectures?
3 3
Are you someone who’s never studied basic algebra?
(You don’t need to be advanced, but you should understand basic addition and subtraction, multiplication and division.)
1 1
Are you a kick-butt statistician looking for a reference
book?
2 2
Are you afraid to try something different? Would you rather have a root canal than mix stripes with plaid? Do you believe that a statistics book can’t be serious if Venn diagrams are anthropomorphized?
“How can this be a serious book on statistics?” “What’s with all the graphics?”
“Can I actually learn it this way?”
Your brain craves novelty. It’s always searching, scanning, waiting for something unusual. It was built that way, and it helps you stay alive.
So what does your brain do with all the routine, ordinary, normal things you encounter? Everything it can to stop them from interfering with the brain’s real job—recording things that matter. It doesn’t bother saving the boring things; they never make it past the “this is obviously not important” filter. How does your brain know what’s important? Suppose you’re out for a day hike and a tiger jumps in front of you, what happens inside your head and body?
Neurons fire. Emotions crank up. Chemicals surge. And that’s how your brain knows...
This must be important! Don’t forget it!
But imagine you’re at home, or in a library. It’s a safe, warm, tiger-free zone. You’re studying. Getting ready for an exam. Or trying to learn some tough
technical topic your boss thinks will take a week, ten days at the most. Just one problem. Your brain’s trying to do you a big favor. It’s trying to make sure that this obviously non-important content doesn’t clutter up scarce resources. Resources that are better spent storing the really big things. Like tigers. Like the danger of fire. Like how you should never have posted those “party” photos on your Facebook page. And there’s no simple way to tell your brain, “Hey brain, thank you very much, but no matter how dull this book is, and how little I’m registering on the emotional Richter scale right now, I really do want you to keep this stuff around.”
We know what you’re thinking
We know what your brain is thinking
Your brain think
s
THIS is imp
ortant.
Your brain think
s
THIS isn’t w
orth
saving.
how to use this book
We think of a “Head First” reade
r as a learner.
So what does it take to learn something? F
irst, you have to get it, then make sure
you don’t forget it. It’s not about pushing f
acts into your head. Based on the
latest research in cognitive science, neurobiology
, and educational psychology,
learning takes a lot more than text on a pa
ge. We know what turns your brain on.
Some of the Head First learning principles:
Make it visual. Images are far more memorable than wor
ds alone, and make learning much
more effective (up to 89% improvement in
recall and transfer studies). It also makes things
more understandable. Put the words w
ithin or near the graphics they
relate to, rather than on the bottom or on
another page, and learners will be up
to twice as likely to solve problems related to the content.
Use a conversational and personalized style.
In recent
studies, students performed up to 40% better on post-learning tests if the content spoke directly to the reader, using a first-pers
on,
conversational style rather than taking a formal tone. Tell stories instead of lecturing. Use casual language. D
on’t take yourself too
seriously. Which would you pay more attention t
o: a stimulating
dinner party companion, or a lecture?
Get the learner to think more deeply.
In other words,
unless you actively flex your neurons, nothi
ng much happens in
your head. A reader has to be motivated, e
ngaged, curious, and inspired to solve problems, draw
conclusions, and generate new knowledge. And for that, you ne
ed challenges, exercises,
and thought-provoking questions, and activities that involve bo
th sides of the brain
and multiple senses.
Get—and keep—the reader’s attention.
We’ve all had the “I really want to
learn this but I can’t stay awake past page
one” experience. Your brain pays attention
to things that are out of the ordinary, inter
esting, strange, eye-catching, unexpected.
Learning a new, tough, technical topic doesn’t have to be boring
. Your brain
will learn much more quickly if it’s not.
Touch their emotions. We now know that y
our ability to remember
something is largely dependent on its emo
tional content. You remember
what you care about. You remember when
you feel something. No, we’re not talking
heart-wrenching stories about a boy and h
is dog. We’re talking emotions like surprise,
curiosity, fun, “what the...?” , and the feelin
g of “I Rule!” that comes when you solve a
puzzle, learn something everybody else th
inks is hard, or realize you know something
that “I’m more mathematically inclined tha
n thou” Bob from class doesn’t.
S
Red Black
We have absolutely
nothing in common.
We’re exclusive events
Metacognition: thinking about thinking
I wonder how I can trick my brain into remembering this stuff...
If you really want to learn, and you want to learn more quickly and more deeply, pay attention to how you pay attention. Think about how you think. Learn how you learn.
Most of us did not take courses on metacognition or learning theory when we were growing up. We were expected to learn, but rarely taught to learn.
But we assume that if you’re holding this book, you really want to learn statistics. And you probably don’t want to spend a lot of time. If you want to use what you read in this book, you need to remember what you read. And for that, you’ve got to understand it. To get the most from this book, or any book or learning experience, take responsibility for your brain. Your brain on this content.
The trick is to get your brain to see the new material you’re learning as Really Important. Crucial to your well-being. As important as a tiger. Otherwise, you’re in for a constant battle, with your brain doing its best to keep the new content from sticking.
So just how DO you get your brain to treat statistics like it was a hungry tiger?
There’s the slow, tedious way, or the faster, more effective way. The
slow way is about sheer repetition. You obviously know that you are able to learn and remember even the dullest of topics if you keep pounding the same thing into your brain. With enough repetition, your brain says, “This doesn’t feel important to him, but he keeps looking at the same thing over and over and over, so I suppose it must be.”
The faster way is to do anything that increases brain activity, especially different types of brain activity. The things on the previous page are a big part of the solution, and they’re all things that have been proven to help your brain work in your favor. For example, studies show that putting words within the pictures they describe (as opposed to somewhere else in the page, like a caption or in the body text) causes your brain to try to makes sense of how the words and picture relate, and this causes more neurons to fire. More neurons firing = more chances for your brain to get that this is something worth paying attention to, and possibly recording.
A conversational style helps because people tend to pay more attention when they perceive that they’re in a conversation, since they’re expected to follow along and hold up their end. The amazing thing is, your brain doesn’t necessarily care that the “conversation” is between you and a book! On the other hand, if the writing style is formal and dry, your brain perceives it the same way you experience being lectured to while sitting in a roomful of passive attendees. No need to stay awake.
how to use this book
Here’s what WE did:
We used pictures, because your brain is tuned for visuals, not text. As far as your brain’s concerned, a picture really is worth a thousand words. And when text and pictures work together, we embedded the text in the pictures because your brain works more effectively when the text is within the thing the text refers to, as opposed to in a caption or buried in the text somewhere.
We used redundancy, saying the same thing in different ways and with different media types, and multiple senses, to increase the chance that the content gets coded into more than one area of your brain.
We used concepts and pictures in unexpected ways because your brain is tuned for novelty, and we used pictures and ideas with at least some emotional content, because your brain is tuned to pay attention to the biochemistry of emotions. That which causes you to feel something is more likely to be remembered, even if that feeling is nothing more than a little
humor, surprise, or interest.
We used a personalized, conversational style, because your brain is tuned to pay more attention when it believes you’re in a conversation than if it thinks you’re passively listening to a presentation. Your brain does this even when you’re reading.
We included more than 80 activities, because your brain is tuned to learn and remember more when you do things than when you read about things. And we made the exercises challenging-yet-do-able, because that’s what most people prefer.
We used multiple learning styles, because you might prefer step-by-step procedures, while someone else wants to understand the big picture first, and someone else just wants to see an example. But regardless of your own learning preference, everyone benefits from seeing the same content represented in multiple ways.
We include content for both sides of your brain, because the more of your brain you engage, the more likely you are to learn and remember, and the longer you can stay focused. Since working one side of the brain often means giving the other side a chance to rest, you can be more productive at learning for a longer period of time.
And we included stories and exercises that present more than one point of view,
because your brain is tuned to learn more deeply when it’s forced to make evaluations and judgments.
We included challenges, with exercises, and by asking questions that don’t always have a straight answer, because your brain is tuned to learn and remember when it has to work at something. Think about it—you can’t get your body in shape just by watching people at the gym. But we did our best to make sure that when you’re working hard, it’s on the right things. That you’re not spending one extra dendrite processing a hard-to-understand example, or parsing difficult, jargon-laden, or overly terse text.
We used people. In stories, examples, pictures, etc., because, well, because you’re a person. And your brain pays more attention to people than it does to things.
So, we did our part. The rest is up to you. These tips are a starting point; listen to your brain and figure out what works for you and what doesn’t. Try new things.
Drink water. Lots of it.
Your brain works best in a nice bath of fluid. Dehydration (which can happen before you ever feel thirsty) decreases cognitive function.
Make this the last thing you read before bed. Or at least the last challenging thing.
Practice solving problems!
There’s only one way to truly master statistics:
practice answering questions. And that’s what you’re going to do throughout this book. Using statistics is a skill, and the only way to get good at it is to practice. We’re going to give you a lot of practice: every chapter has exercises that pose problems for you to solve. Don’t just skip over them—a lot of the learning happens when you solve the exercises. We included a solution to each exercise—don’t be afraid to peek at the solution if you get stuck! (It’s easy to get snagged on something small.) But try to solve the problem before you look at the solution. And
Listen to your brain.
Feel something.
Your brain needs to know that this matters. Get involved with the stories. Make up your own captions for the photos. Groaning over a bad joke is still better than feeling nothing at all.
Pay attention to whether your brain is getting overloaded. If you find yourself starting to skim the surface or forget what you just read, it’s time for a break. Once you go past a certain point, you won’t learn faster by trying to shove more in, and you might even hurt the process.
Talk about it. Out loud.
Speaking activates a different part of the brain. If you’re trying to understand something, or increase your chance of remembering it later, say it out loud. Better still, try to explain it out loud to someone else. You’ll learn more quickly, and you might uncover ideas you hadn’t known were there when you were reading about it.
Part of the learning (especially the transfer to long-term memory) happens after you put the book down. Your brain needs time on its own, to do more processing. If you put in something new during that processing time, some of what you just learned will be lost.
Read the “There are No Dumb Questions”
That means all of them. They’re not optional sidebars—they’re part of the core content!
Don’t skip them.
Slow down. The more you understand, the less you have to memorize.
Don’t just read. Stop and think. When the book asks you a question, don’t just skip to the answer. Imagine that someone really is asking the question. The more deeply you force your brain to think, the better chance you have of learning and remembering.
Cut this out and stick it
on your refrigerator.
Here’s what YOU can do to bend
your brain into submission
Do the exercises. Write your own notes.
We put them in, but if we did them for you, that would be like having someone else do your workouts for you. And don’t just look at the exercises. Use a pencil. There’s plenty of evidence that physical activity while learning can increase the learning.
how to use this book
Read Me
This is a learning experience, not a reference book. We deliberately stripped out everything that might get in the way of learning whatever it is we’re working on at that point in the book. And the first time through, you need to begin at the beginning, because the book makes assumptions about what you’ve already seen and learned.
We begin by teaching basic ways of representing and summarizing data, then move on to probability distributions, and then more advanced techniques such as hypothesis testing.
While later topics are important, the first thing you need to tackle is fundamental building blocks such as charting, averages, and measures of variability. So we begin by showing you basic statistical problems that you actually solve yourself. That way you can immediately do something with statistics, and you will begin to get excited about it. Then, a bit later in the book, we show you how to use probability and probability distributions. By then you’ll have a solid grasp of statistics fundamentals, and can focus on learning the concepts. After that, we show you how to apply your knowledge in more powerful ways, such as how to conduct hypothesis tests. We teach you what you need to know at the point you need to know it because that’s when it has the most value.
We cover the same general set of topics that are on the AP and A Level curriculum.
While we focus on the overall learning experience rather than exam preparation, we provide good coverage of the AP and A Level curriculum. This means that while you work your way through the topics, you’ll gain the deep understanding you need to get a good grade in whatever exam it is you’re taking. This is a far more effective way of learning statistics than learning formulae by rote, as you’ll feel confident about what you need when, and how to use it.
We help you out with online resources.
Our readers tell us that sometimes you need a bit of extra help, so we provide online resources, right at your fingertips. We give you an online forum where you can go to seek help, online papers, and other resources too. The starting point is
The activities are NOT optional.
The exercises and activities are not add-ons; they’re part of the core content of the book. Some of them are to help with memory, some are for understanding, and some will help you apply what you’ve learned. Don’t skip the exercises. The crossword puzzles are the only thing you don’t have to do, but they’re good for giving your brain a chance to think about the words and terms you’ve been learning in a different context.
The redundancy is intentional and important.
One distinct difference in a Head First book is that we want you to really get it. And we want you to finish the book remembering what you’ve learned. Most reference books don’t have retention and recall as a goal, but this book is about learning, so you’ll see some of the same concepts come up more than once.
The Brain Power and Brain Barbell exercises don’t have answers.
the review team
Cary Collett
Dru Kleinfeld
Michael Prerau
Andy Parker
Ariana Anderson
Danielle Levitt
Ariana Anderson is teaching assistant and PhD Candidate in the Department of Statistics at UCLA. Her research interests include data-mining and pattern recognition.
Dru Kleinfeld is a graduate of Cornell University, class of 2007, with a BA in Economics. Dru currently lives in New York City and works in the Human Resources Department of Morgan Stanley.
Danielle Levitt is currently a first year medical student in Tel Aviv, Israel. In her free time she enjoys listening to music, swimming in the ocean, and spending time with my friends and family.
Having started his career as a research physicist, Andy Parker thought he knew a thing or two about statistics. Sadly, having read this book, that turned out not to be the case. Andy spends most of his time now, worrying about what other important things he may have forgotten.
Michael J. Prerau is a researcher in Computational Neuroscience creating new statistical methods to analyze how the neurons encode information in the brain. He is a Ph.D. student in the Program in Neuroscience at Boston University, as well as a research associate in the Neuroscience Statistics Research Laboratory in the Department of Anesthesia and Critical Care at Massachusetts General Hospital.
Matthew Vadeboncoeur is a graduate student studying ecosystem ecology at the Complex Systems Research Center at the University of New Hampshire.
Not pictured (but just as awesome):
Jeffrey Maddelena and Matt Vadeboncoeur
Thanks also to Keith Fahlgren, Bruce Frey,
and Leanne Lockhart for technical feedback.
The technical review team
Acknowledgments
My editor:
Heartfelt thanks go to my editor, Sanders Kleinfeld. Sanders has been a delight to work with, and over the course of phone calls, emails and chat clients has become a good friend. He’s amazingly dedicated and hard-working, and the advice and support I’ve received from him have been first-rate. Thanks Sanders! You’re awesome and I couldn’t have done this without you.
Lou Barr
Brett McLaughlin
My family and friends:I wish there was space to mention everyone who has helped me along the way, but special thanks must go to David, Mum, Dad, Steve Harvey, Gill Chester, Paul Burgess, Andy Tatler, and Peter Walker. You guys have kept me going, and I can’t tell you how
much I’ve appreciated your support and encouragement. Thank you.
The O’Reilly team:
A big thank you goes to Brett McLaughlin for flying me over to Boston for the Head First boot camp, and giving me the
opportunity of a lifetime. Brett’s instincts for Head First are phenomenal, and I’ve truly appreciated all the guidance he’s given me over the course of the book. Thanks, Brett. It’s hard to imagine what this book would have been like without Lou Barr. Lou is an amazing graphics designer who has sprinkled magic through all the pages of this book. Not only that, she’s added so much to the overall learning
experience. No challenge has been too great for her, and I’m so grateful to her.
The rest of the Head First team also deserve a great big thank you. Catherine Nolan helped me through the early stages of the book and made me feel at home in Head First land, Brittany Smith kept production running smoothly,
Laurie Petrycki trusted me enough to let me write this book (and borrow her office earlier in the year—thanks Laurie!),
Keith McNamara did a great job organizing the tech review team, and Caitrin McCullough managed everything on the website. Thanks guys!
A special mention goes to Kathy Sierra and Bert Bates
for being the original masterminds behind this wonderful series of books. It’s an honor to be part of it.
safari books online
Safari® Books Online
When you see a Safari® icon on the cover of your favorite technology book that means the book is available online through the O’Reilly Network Safari Bookshelf.
Safari offers a solution that’s better than e-books. It’s a virtual library that lets you easily search thousands of top tech books, cut and paste code samples, download
chapters, and find quick answers when you need the most accurate, current
I want to look clean and pretty, so I give the right impression.
First Impressions
Can’t tell your facts from your figures?
Statistics help you make sense of confusing sets of data. They make the
complex simple. And when you’ve found out what’s really going on, you
need a way of visualizing it and telling everyone else. So if you want to
pick the best chart for the job, grab your coat, pack your best slide rule, and
Statistics are everywhere
Everywhere you look you can find statistics, whether you’re browsing the Internet, playing sports, or looking through the top scores of your favorite video game. But what actually is a statistic?
Statistics are numbers that summarize raw facts and figures in some meaningful way. They present key ideas that may not be immediately
apparent by just looking at the raw data, and by data, we mean facts or figures from which we can draw conclusions. As an example, you don’t have to wade through lots of football scores when all you want to know is the league position of your favorite team. You need a statistic to quickly give you the information you need.
The study of statistics covers where statistics come from, how to calculate them, and how you can use them effectively.
Gather data
Analyze
Draw conclusions
When you’ve analyzed
your data, you make
decisions and predictions.
Once you have data, you can analyze it
and generate statistics. You can calculate
probabilities to see how likely certain ev
ents
are, test ideas, and indicate how confident
you are about your results.
At the root of statis
tics is data.
Data can be gathered by looking
through existing sourc
es, conducting
experiments, or by conduc
ting surveys.
You can say what you want with statistics, even lie.
This stock’s so hot it’s smokin’ The profit’s holding
steady, but it’s nothing special.
But why learn statistics?
Understanding what’s really going on with statistics empowers you. If you really get statistics, you’ll be able to make objective decisions, make accurate predictions that seem inspired, and convey the message you want in the most effective way possible.
Statistics can be a convenient way of summarizing key truths about data, but there’s a dark side too.
Statistics are based on facts, but even so, they can sometimes be misleading. They can be used to tell the truth—or to lie. The problem is how do you know when you’re being told the truth, and when you’re being told lies? Having a good understanding of statistics puts you in a strong position. You’re much better equipped to tell when statistics are inaccurate or
misleading. In other words, studying statistics is a good way of making sure you don’t get fooled.
As an example, take a look at the profits made by a company in the latter half of last year.
How can there be two interpretations of the same
Month Jul Aug Sep Oct Nov Dec Profit (millions) 2.0 2.1 2.2 2.1 2.3 2.4
A tale of two charts
So how can we explore these two different interpretations of the same data? What we need is some way of visualizing them. If you need to visualize information, there’s no better way than using a chart or graph. They can be a quick way of summarizing raw information and can help you get an impression of what’s going on at a glance. But you need to be careful because even the simplest chart can be used to subtly mislead and misdirect you.
Here are two time graphs showing a companies profits for six months. They’re both based on the same information, so why do they look so different? They give drastically different versions of the same information.
See what I mean, the profit’s about the same each month.
Both of these charts are
based on the same information,
but they look wildly different.
What’s going on?
Jul Aug Sep Oct Nov 0.5
Jul Aug Sep Oct Nov 2.1
Take a look at the two charts on the facing page. What would you say are the key differences? How do they give such different first impressions of the data?
Q:
Why not just go on the data? Why chart it?A:
Sometimes it’s difficult to see what’s really going on just by looking at the raw data. There can be patterns and trends in the data, but these can be very hard to spot if you’re just looking at a heap of numbers. Charts give you a way of literally seeing patterns in your data. They allow you to visualize your data and see what’s really going on in a quick glance.Q:
What’s the difference between information and data?A:
Data refers to raw facts and figures that have been collected.Information is data that has some sort of added meaning.
Month
Pr
ofit (millions of
dollar
s) Company Profit per Month
Jul Aug Sep Oct Nov 2.1
Take a look at the two charts. What would you say are the key differences? How do they give such different first impressions of the data?
The first chart shows that the profit is relatively
steady. It achieves this by having the vertical axis
start at 0, and then plotting the profit for each
month against this.
Look, the vertical
axes are different
on each chart.
The axis for this chart
starts at 2.0, not 0.
No wonder the profit
looks so awesome.
The second chart gives a different impression by
making the vertical axis start at a different place
and adjusting the scale accordingly. At a glance, the
profits appear to be rising dramatically each month.
It’s only when you look closer that you see what’s
really going on.
Both charts are based on the same underlying data,
but they each send a different message.
Software can’t think for you.
Chart software can save you a lot of time and produce effective charts, but you still need to understand what’s going on.
At the end of the day, it’s your data, and it’s up to you to choose the right chart for the job and make sure your data is presented in the most effective way possible and conveys the message you want. Software can translate data into charts, but it’s up to you to make sure the chart is right.
Month
Pr
ofit (millions of
dollar
s) Company Profit per Month
Jul Aug Sep Oct Nov 0.5
Why should I care about charts? Chart software can handle everything for you, that’s what it’s there for.
Manic Mango needs some charts
One company that needs some charting expertise is Manic Mango, an innovative games company that is taking the world by storm. The CEO has been invited to deliver a keynote presentation at the next worldwide games expo. He needs some quick, slick ways of presenting data, and he’s asked you to come up with the goods. There’s a lot riding on this. If the keynote goes well, Manic Mango will get extra sponsorship revenue, and you’re bound to get a hefty bonus for your efforts.
The first thing the CEO wants to be able to do is compare the percentage of satisfied players for each game genre. He’s started off by plugging the data he has through some charting software, and here are the results:
Take a good look at the pie chart that the CEO has produced. What does each slice represent? What can you infer about the relative popularity of different video game genres?
Sport 27,500 Strategy
11,500 Action 6,000
Shooter 3,500
Other 1,500
Sport
Pie charts work by splitting your data into distinct groups or categories. The chart consists of a circle split into wedge-shaped slices, and each slice represents a group. The size of each slice is proportional to how many are in each group compared with the others. The larger the slice, the greater the relative popularity of that group. The number in a particular group is called the frequency.
Pie charts divide your entire data set into distinct groups. This means that if you add together the frequency of each slice, you should get 100%. Let’s take a closer look at our pie chart showing the number of units sold per genre:
This slice is much larger than all the
others, which means that the frequency
is highest for this category.
The slice here is much smaller than
the others, so this means sales are
a lot lower for this category.
Genre Units soldSports 27,500 Strategy 11,500 Action 6,000 Shooter 3,500 Other 1,500
So when are pie charts useful?
We’ve seen that the size of each slice represents the relative frequency of each group of data you’re showingg. Because of
this, pie charts can be useful if you want to compare basic proportions. It’s usually easy to tell at a glance which groups have a high frequency compared with the others. Pie charts are less useful if all the slices have similar sizes, as it’s difficult to pick up on subtle differences between the slice sizes.
So what about the pie chart that the Manic Mango CEO has created?