Advances in Intelligent Systems and Computing
744
Thi Thi Zin
Jerry Chun-Wei Lin
Editors
Big Data Analysis
and Deep Learning
Applications
Volume 744
Series editor
The series “Advances in Intelligent Systems and Computing” contains publications on theory, applications, and design methods of Intelligent Systems and Intelligent Computing. Virtually all disciplines such as engineering, natural sciences, computer and information science, ICT, economics, business, e-commerce, environment, healthcare, life science are covered. The list of topics spans all the areas of modern intelligent systems and computing such as: computational intelligence, soft computing including neural networks, fuzzy systems, evolutionary computing and the fusion of these paradigms, social intelligence, ambient intelligence, computational neuroscience, artificial life, virtual worlds and society, cognitive science and systems, Perception and Vision, DNA and immune based systems, self-organizing and adaptive systems, e-Learning and teaching, human-centered and human-centric computing, recommender systems, intelligent control, robotics and mechatronics including human-machine teaming, knowledge-based paradigms, learning paradigms, machine ethics, intelligent data analysis, knowledge management, intelligent agents, intelligent decision making and support, intelligent network security, trust management, interactive entertainment, Web intelligence and multimedia. The publications within“Advances in Intelligent Systems and Computing”are primarily proceedings of important conferences, symposia and congresses. They cover significant recent developments in the field, both of a foundational and applicable character. An important characteristic feature of the series is the short publication time and world-wide distribution. This permits a rapid and broad dissemination of research results.
Advisory Board Chairman
Nikhil R. Pal, Indian Statistical Institute, Kolkata, India e-mail: [email protected]
Members
Rafael Bello Perez, Universidad Central“Marta Abreu”de Las Villas, Santa Clara, Cuba e-mail: [email protected]
Emilio S. Corchado, University of Salamanca, Salamanca, Spain e-mail: [email protected]
Hani Hagras, University of Essex, Colchester, UK e-mail: [email protected]
LászlóT. Kóczy, Széchenyi István University, Győr, Hungary e-mail: [email protected]
Vladik Kreinovich, University of Texas at El Paso, El Paso, USA e-mail: [email protected]
Chin-Teng Lin, National Chiao Tung University, Hsinchu, Taiwan e-mail: [email protected]
Jie Lu, University of Technology, Sydney, Australia e-mail: [email protected]
Patricia Melin, Tijuana Institute of Technology, Tijuana, Mexico e-mail: [email protected]
Nadia Nedjah, State University of Rio de Janeiro, Rio de Janeiro, Brazil e-mail: [email protected]
Ngoc Thanh Nguyen, Wroclaw University of Technology, Wroclaw, Poland e-mail: [email protected]
Jun Wang, The Chinese University of Hong Kong, Shatin, Hong Kong e-mail: [email protected]
Editors
Big Data Analysis
and Deep Learning
Applications
Proceedings of the First International
Conference on Big Data Analysis and
Deep Learning
Editors Thi Thi Zin
Faculty of Engineering University of Miyazaki Miyazaki
Japan
Jerry Chun-Wei Lin
Department of Computing, Mathematics, and Physics
Western Norway University of Applied Sciences (HVL)
Bergen Norway
ISSN 2194-5357 ISSN 2194-5365 (electronic) Advances in Intelligent Systems and Computing
ISBN 978-981-13-0868-0 ISBN 978-981-13-0869-7 (eBook) https://doi.org/10.1007/978-981-13-0869-7
Library of Congress Control Number: 2018944427 ©Springer Nature Singapore Pte Ltd. 2019
This work is subject to copyright. All rights are reserved by the Publisher, whether the whole or part of the material is concerned, specifically the rights of translation, reprinting, reuse of illustrations, recitation, broadcasting, reproduction on microfilms or in any other physical way, and transmission or information storage and retrieval, electronic adaptation, computer software, or by similar or dissimilar methodology now known or hereafter developed.
The use of general descriptive names, registered names, trademarks, service marks, etc. in this publication does not imply, even in the absence of a specific statement, that such names are exempt from the relevant protective laws and regulations and therefore free for general use.
The publisher, the authors and the editors are safe to assume that the advice and information in this book are believed to be true and accurate at the date of publication. Neither the publisher nor the authors or the editors give a warranty, express or implied, with respect to the material contained herein or for any errors or omissions that may have been made. The publisher remains neutral with regard to jurisdictional claims in published maps and institutional affiliations.
Printed on acid-free paper
This Springer imprint is published by the registered company Springer Nature Singapore Pte Ltd. part of Springer Nature
This volume composes the proceedings of thefirst International Conference on Big Data Analysis and Deep Learning (ICBDL 2018), which is jointly organized by University of Miyazaki, Japan, and Myanmar Institute of Information Technology, Myanmar. ICBDL 2018 took place in Miyazaki, Japan, on May 14–15, 2018. ICBDL 2018 is technically co-sponsored by Springer; University of Miyazaki, Japan; Myanmar Institute of Information Technology, Myanmar; and Harbin Institute of Technology, Shenzhen, China.
The focus of ICBDL 2018 is on the frontier topics in data science, engineering, and computer science subjects. Especially, big data analysis, deep learning, infor-mation communication, and imaging technologies are the main themes of the conference.
All submitted papers have gone through the peer review process. Forty-five excellent papers were accepted for thefinal proceeding. We would like to express our sincere appreciation to the reviewers and the International Technical Program Committee members for making this conference successful. We also would like to thank all authors for their high-quality contributions.
We would like to express our sincere gratitude to Prof. Dr. Tsuyomu Ikenoue, the President of the University of Miyazaki who has made the conference possible. Finally, our sincere thanks must go to the host of the conference, the University of Miyazaki, Japan.
March 2018 Thi Thi Zin
Conference Program Committee Chair
Organizing Committee
General Chair
Tsuyomu Ikenoue University of Miyazaki, Japan
General Co-chairs
Win Aye Myanmar Institute of Information Technology, Myanmar
Masahito Suiko University of Miyazaki, Japan Toshiaki Itami University of Miyazaki, Japan
Advisory Committee Chairs
Mitsuhiro Yokota University of Miyazaki, Japan Masugi Maruyama University of Miyazaki, Japan
KRV Raja Subramanian International Institute of Information Technology, Bangalore, India
Pyke Tin University of Miyazaki, Japan
Hiromitsu Hama Osaka City University, Japan
Program Committee Chair
Thi Thi Zin University of Miyazaki, Japan
Program Committee Co-chair
Mie Mie Khin Myanmar Institute of Information Technology, Myanmar
Publication Chairs
Thi Thi Zin University of Miyazaki, Japan
Jerry Chun-Wei Lin Western Norway University of Applied Sciences (HVL), Norway
Invited Session Chairs
Soe Soe Khaing University of Technology, Yatanarpon Cyber City, Myanmar
Myint Myint Sein University of Computer Studies, Yangon, Myanmar
International Technical Program Committee Members
Moe Pwint University of Computer Studies, Mandalay, Myanmar
Win Zaw Yangon Institute of Technology, Myanmar Aung Win University of Technology, Yatanarbon Cyber City,
Myanmar
Thi Thi Soe Nyunt University of Computer Studies, Yangon, Myanmar Khin Thida Lynn University of Computer Studies, Mandalay,
Myanmar
Myat Myat Min University of Computer Studies, Mandalay, Myanmar
Than Nwe Aung University of Computer Studies, Mandalay, Myanmar
Mie Mie Tin Myanmar Institute of Information Technology, Myanmar
Hnin Aye Thant University of Technology, Yatanarbon Cyber City, Myanmar
Takashi Toriu Osaka City University, Japan Atsushi Ueno Osaka City University, Japan Shingo Yamaguchi Yamaguchi University, Japan
Chien-Ming Chen Harbin Institute of Technology (Shenzhen), China Tsu-Yang Wu Fujian University of Technology, China
Big Data Analysis
Data-Driven Constrained Evolutionary Scheme for Predicting
Price of Individual Stock in Dynamic Market Environment. . . 3 Henry S. Y. Tang and Jean Hok Yin Lai
Predictive Big Data Analytics Using Multiple Linear
Regression Model. . . 9 Kyi Lai Lai Khine and Thi Thi Soe Nyunt
Evaluation for Teacher’s Ability and Forecasting Student’s
Career Based on Big Data . . . 20 Zun Hlaing Moe, Thida San, Hlaing May Tin, Nan Yu Hlaing,
and Mie Mie Tin
Tweets Sentiment Analysis for Healthcare on Big Data Processing
and IoT Architecture Using Maximum Entropy Classifier. . . 28 Hein Htet, Soe Soe Khaing, and Yi Yi Myint
A Survey on Influence and Information Diffusion in Twitter
Using Big Data Analytics. . . 39 Radia El Bacha and Thi Thi Zin
Real Time Semantic Events Detection from Social Media Stream . . . 48 Phyu Phyu Khaing and Than Nwe Aung
Community and Outliers Detection in Social Network. . . 58 Htwe Nu Win and Khin Thidar Lynn
Analyzing Sentiment Level of Social Media Data Based on SVM
and Naïve Bayes Algorithms . . . 68 Hsu Wai Naing, Phyu Thwe, Aye Chan Mon, and Naw Naw
Deep Learning and its Applications
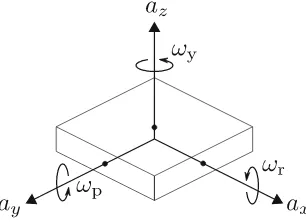
Accuracy Improvement of Accelerometer-Based Location
Estimation Using Neural Network . . . 79 Noritaka Shigei, Hiroki Urakawa, Yoshihiro Nakamura,
Masahiro Teramura, and Hiromi Miyajima
Transparent Object Detection Using Convolutional Neural Network. . . 86 May Phyo Khaing and Mukunoki Masayuki
Multi-label Land Cover Indices Classification of Satellite Images
Using Deep Learning . . . 94 Su Wit Yi Aung, Soe Soe Khaing, and Shwe Thinzar Aung
Real-Time Hand Pose Recognition Using Faster Region-Based
Convolutional Neural Network. . . 104 Hsu Mon Soe and Tin Myint Naing
Data Mining and its Applications
School Mapping for Schools of Basic Education in Myanmar . . . 115 Myint Myint Sein, Saw Zay Maung Maung, Myat Thiri Khine,
K-zin Phyo, Thida Aung, and Phyo Pa Pa Tun
GBSO-RSS: GPU-Based BSO for Rules Space Summarization . . . 123 Youcef Djenouri, Jerry Chun-Wei Lin, Djamel Djenouri,
Asma Belhadi, and Philippe Fournier-Viger
Machine Learning Based Live VM Migration for Efficient
Cloud Data Center. . . 130 Ei Phyu Zaw
Dynamic Replication Management Scheme for Distributed
File System. . . 139 May Phyo Thu, Khine Moe Nwe, and Kyar Nyo Aye
Frequent Pattern Mining for Dynamic Database by Using
Hadoop GM-Tree and GTree. . . 149 Than Htike Aung and Nang Saing Moon Kham
Investigation of the Use of Learning Management System (Moodle)
in University of Computer Studies, Mandalay . . . 160 Thinzar Saw, Kyu Kyu Win, Zan Mo Mo Aung, and Myat Su Oo
User Preference Information Retrieval by Using Multiplicative
Adaptive Refinement Search Algorithm. . . 169 Nan Yu Hlaing and Myintzu Phyo Aung
Proposed Framework for Stochastic Parsing of Myanmar Language. . . 179 Myintzu Phyo Aung, Ohnmar Aung, and Nan Yu Hlaing
Information Communication Systems and Applications
FDTD Based Numerical Calculation of Electromagnetic Wave
Radiation in Multi-layer Circular Cylindrical Human Head . . . 191 Z. M. Lwin and M. Yokota
Improved Convergence in Eddy-Current Analysis by Singular
Value Decomposition of Subdomain Problem. . . 199 Takehito Mizuma and Amane Takei
Development and Validation of Parallel Acoustic Analysis Method
for the Sound Field Design of a Large Space. . . 206 Yuya Murakami, Kota Yamamoto, and Amane Takei
Secret Audio Messages Hiding in Images. . . 215 Saw Win Naing and Tin Myint Naing
Location Based Personal Task Reminder System
Using GPS Technology. . . 224 Thwet Hmue Nyein and Aye Mon Yi
Intelligent Systems
Front Caster Capable of Reducing Horizontal Forces
on Step Climbing. . . 233 Geunho Lee, Masaki Shiraishi, Hiroki Tamura, and Kikuhito Kawasue
Mobile Location Based Indexing for Range Searching. . . 240 Thu Thu Zan and Sabai Phyu
Building Travel Speed Estimation Model for Yangon City
from Public Transport Trajectory Data. . . 250 Thura Kyaw, Nyein Nyein Oo, and Win Zaw
Comparison Between Block-Encoding and Quadtree Compression
Methods for Raster Maps. . . 258 Phyo Phyo Wai, Su Su Hlaing, Khin Lay Mon, Mie Mie Tin,
and Mie Mie Khin
Video Monitoring System and Applications
A Study on Estrus Detection of Cattle Combining Video Image
and Sensor Information . . . 267 Tetsuya Hirata, Thi Thi Zin, Ikuo Kobayashi, and Hiromitsu Hama
A Study on Detection of Abnormal Behavior by a Surveillance
Camera Image . . . 284 Hiroaki Tsushita and Thi Thi Zin
A Study on Detection of Suspicious Persons for Intelligent
Monitoring System. . . 292 Tatsuya Ishikawa and Thi Thi Zin
A Study on Violence Behavior Detection System Between
Two Persons. . . 302 Atsuki Kawano and Thi Thi Zin
Image and Multimedia Processing
Object Detection and Recognition System for Pick and Place Robot . . . 315 Aung Kaung Sat and Thuzar Tint
Myanmar Rice Grain Classification Using Image
Processing Techniques . . . 324 Mie Mie Tin, Khin Lay Mon, Ei Phyu Win, and Su Su Hlaing
Color Segmentation Based on Human Perception
Using Fuzzy Logic . . . 333 Tin Mar Kyi and Khin Chan Myae Zin
Key Frame Extraction Techniques. . . 342 Mie Mie Khin, Zin Mar Win, Phyo Phyo Wai, and Khaing Thazin Min
A Study on Music Retrieval System Using Image Processing. . . 346 Emi Takaoka and Thi Thi Zin
Analysis of Environmental Change Detection Using Satellite
Images (Case Study: Irrawaddy Delta, Myanmar). . . 355 Soe Soe Khaing, Su Wit Yi Aung, and Shwe Thinzar Aung
Analysis of Land Cover Change Detection Using Satellite Images
in Patheingyi Township . . . 364 Hnin Phyu Phyu Aung and Shwe Thinzar Aung
Environmental Change Detection Analysis in Magway
Division, Myanmar. . . 374 Ei Moh Moh Aung and Thu Zar Tint
Author Index. . . 385
Data-Driven Constrained Evolutionary
Scheme for Predicting Price of Individual
Stock in Dynamic Market Environment
Henry S. Y. Tang(✉) and Jean Hok Yin Lai(✉) Hong Kong Baptist University, Kowloon Tong, Hong Kong [email protected], [email protected]
Abstract. Predicting stock price is a challenging problem as the market involve multi-agent activities with constantly changing environment. We propose a method of constrained evolutionary (CE) scheme that based on Genetic Algo‐ rithm (GA) and Artificial Neural Network (ANN) for stock price prediction. Stock market continuously subject to influences from government policy, investor activity, cooperation activity and many other hidden factors. Due to dynamic and non-linear nature of the market, individual stock price movement are usually hard to predict. Investment strategies used by regular investor usually require constant modification, remain secrecy and sometimes abandoned. One reason for such behavior is due to dynamic structure of the efficient market, where all revealed information will reflect upon the stock price, leads to dynamic behavior of the market and unprofitability of the static strategies. The CE scheme contains mech‐ anisms which are temporal and environmental sensitive that triggers evolutionary changes of the model to create a dynamic response towards external factors. Keywords: Genetic Algorithm · Artificial neural network · Data-driven Evolutionary · Stock · Prediction
1
Introduction
Stock market is often seen as a dynamic structure with significant changes over time [1], this nature leads challenges in predicting the individual stock price within the market.
Due to the statistical basis and advancement of automatic trading, technical analysis has gained popularity over time. Attempts have been made using different approaches based on human behavior to create a model in predicting the price movement of the stock [2]. Timeseries analysis and machine learning algorithms are commonly used models for the task [3], however, most of the studies are not concerning the dynamic nature of the market where the parameters of the models are obtained and fixed through measuring the statistical confidence or learning algorithm from historical data. This approach might suffer from poor performance in long run due to market structure shift.
© Springer Nature Singapore Pte Ltd. 2019
1.1 Artificial Neural Network
Inspired by human brain’s ability of non-linear, parallel and complex computation power, artificial neural networks are proven to be a universal function approximator given enough neurons within the hidden layer of the network. [4] Different attempts using artificial neural network to predict stock trends were presented in [5], where it indicates the possible feasibility of such approach with curtain classes of neural networks.
1.2 Genetic Algorithms (GA)
John Holland proposed the idea of GA in 1970 inspired by the process of biological evolution. [6] This method provided us with a learning method to find an optimal solution given an optimization function (fitness function). GA search the solution by encodes the solution to a chromosome which represents a potential solution to the problem. The chromosome is then tested by the fitness function which will return a fitness value representing the survival abilities. Fitness function is specifically designed for a partic‐ ular problem, it provides an evaluation of the goodness of the chromosome to the problem. The chromosome with higher fitness value indicating a better solution towards the specific problem. Theses chromosome will produce offspring based on the fitness value through crossover operation, the chromosome with higher fitness value will be selected out and have more offspring. All offspring will then experience a mutation operation, where the chromosome might mutate under predefined probability. Given enough generation, the GA will find a near-optimum solution to the problem. In terms of financial applications, in [7], an ensemble system based on GA were proposed to forecast stock market. In [8], a framework based on Web robot, GA and Support Vector Machine was proposed for data analysis and prediction.
2
Problem Scenario and Assumptions
The problem of stock price movement prediction can be seen as a binary classification problem. The output y of our model has the property of y∈ [0,1], where 0 representing a down-trend prediction and 1 representing an up-trend prediction.
In real-world, stock price of individual company was affected by multi-factors including temporal events, competitors, collaborators and other factors simultaneously. Since the weighting of the combination of factors very likely to change over time, making any non-dynamic model might not be suitable for stock price movement predic‐ tion in long run.
We assume that for any given time t there exist a f(.,.) decision boundary such that the expected error of the decision boundary is smaller than a critical value 𝜀, where
approximate function f∗(x)
tat timet∼f(x,t). We further assume that the approximated function f∗(x)
t decision boundary will shift continuously against time, where f∗(x)
t∼f ∗(x)
t+Δt (2)
Based on the assumptions, for creating an effective approximation function, the scheme should solve below problem.
2.1 Shift Detection (Trigger)
For the scheme to be functional against market structure shift, we require a mechanism to detect the shifting signal and start triggering the evolution process. This mechanism might only consider the presence of the shift but not consider the reason of the shift and the reaction against it.
2.2 Shift Direction
Once we have detected the presence of the shift, we need more information on what type of shift is occurring, for example there is a new player introduced into the market or new regulation announced. Different external environment influence will cause the market and investor behavior changes drastically. Therefore, we need to understand what kind of shift we are experiencing currently.
2.3 Shift Degree
After we know the goal of the evolution, it is sensible for us to consider how fast the model should evolve and from which path. Scheduling of the evolution will allow us progressively reaching the goal. During the evolution, result from problem 2 need to revise for more accurate estimation.
3
Methodology
In this section, we introduce a scheme to solve the problem indicated in previous section. The architecture of the scheme consists of three major structure. A detection function, evolution function and model base. In terms of operation, the detection function contin‐ uously monitoring the new data feed to the system, once the function detected the market shift, it will start triggering the evolution process and request the model base to support its operation. Finally, the new model produced will replace the current model and stored in the model base.
3.1 Shift Detection Function
In phase one of the scheme, most recent historical data is used, e.g. 4 months to the past from now, and separate into different sections U(i) chronologically, and for each section, we run the current model f∗(x)
t and compute the error rate, where
section error(i) = 1
If observed some progressive error increase against i, then the scheme determines that there exists a shift in the market structure and trigger the evolutionary process.
3.2 Shift Direction and Shift Degree
In the proposed model, we used the word constrained to describe the evolutionary process being bounded by current and previous models stored in model base.
The chromosome of each model is the weight and activation function of the model. Figure 1 show that the construction of a chromosome of a neural network, where each layer of the network can be represented as a m × n matrix ML
m,n. Each row i of matrix ML
m,n is the weight of all connection of neuron i at layer
L to its descendant. Each model will contain one or more layer of matrix ML
m,n and a vector of activation functions attached to each layer.
Fig. 1. Illustration of an ANN model and its respective chromosome representation. Two types of crossover operation exist within the evolutionary scheme. First is the neuron swap operation, where the crossover lines only locate between rows of matrix ML
m,n
. Due to consistency between different layers, the child layer must be the same dimension as its parents. Notice that for this operation, the activation function vector is following the swap as illustrated in Fig. 2a. Second crossover operation will be the connection swap operation. In this operation, the crossover lines only locate within randomly selected rows of the matrix ML
m,n
Fig. 2a. Type one crossover operation Fig. 2b. Type two crossover operation Mutation will occur with certain probability on both the weight on the matrix set and the set of activation function vector. Therefore, the activation function of a neuron can mutate from sigmoid function to tanh or other possible activation functions or vice versa. The number of child produced by the current model and a previous model will base on the error rate of the previous model produced with current data feed. More children will be produced by models that having lower error rate.
The reason of choosing the current model as the major partner is because according to assumption 2, the current model will be a good starting point as the parent of the next evolutionary point.
3.3 Fine Tuning
After the crossover and mutation process, the child model will experience a fine tuning and selection stage. At this stage, the data feed will be used to fine tuning the child model by using backpropagation training method with small learning rate. The fitness function is the cross-validation error result of the fine-tuned child model. The next generation will be created based on the fitness function result and the crossover of the fine-tuned child model. The process will terminate until reaching the desire score of fitness or reaching maximum generation.
4
Discussion
Since the possible outcome of the model are based on the number of previous model that stored on the model base, the method for initializing the scheme can be further improved to introduce more constructive model at early stage.
This paper only provided the concept of the proposed model, it is encouraged for further experiment on the real-world data and compared the proposed model with a randomized approach to illustrate the efficiency of the speed of convergence of the GAs and accuracy towards individual stock price prediction for a long-extended period.
References
1. Hamilton, J.D., Lin, G.: Stock market volatility and the business cycle. J. Appl. Econometrics 11(5), 573–593 (1996). Special Issue: Econometric Forecasting
2. Barberis, N., Thaler, R.: A survey of behavioral finance. In: Handbook of the Economics of Finance, vol. 1, Part B, pp. 1053–1128 (2003). Chap. 18
3. Murphy, J.J.: Technical analysis of the financial markets: a comprehensive guide to trading methods and applications, New York Institute of Finance (1999)
4. Haykin, S.: Neural Networks and Learning Machines, 3rd edn. Pearson, Upper Saddle River (2009)
5. Saad, E.W., Prokhorov, D.V., Wunsch, D.C.: Comparative study of stock trend prediction using time delay, recurrent and probabilistic neural networks. IEEE Trans. Neural Netw. 9(6), 1456–1470 (1998)
6. Holland, J.H.: Adaptation in natural and artificial systems, p. 183. The University of Michigan Press, Michigan (1975)
7. Gonzalez, R.T., Padilha, C.A., Couto, D.A.: Ensemble system based on genetic algorithm for stock market forecasting. In: IEEE Congress on Evolutionary Computation (CEC) (2015) 8. Wang, C.-T., Lin, Y.-Y.: The prediction system for data analysis of stock market by using
Predictive Big Data Analytics Using Multiple
Linear Regression Model
Kyi Lai Lai Khine1and Thi Thi Soe Nyunt2(&) 1
Cloud Computing Lab, University of Computer Studies, Yangon, Myanmar [email protected]
2
Head of Software Department,
University of Computer Studies, Yangon, Myanmar [email protected]
Abstract. Today fast trending technology era, data is growing very fast to become extremely huge collection of data in all around globe. This so-called “Big Data”and analyzing on big data sets to extract valuable information from them has also become one of the most important and complex challenges in data analytics research. The challenges of limiting memory usage, computational hurdles and slower response time are the main contributing factors to consider traditional data analysis on big data. Then, traditional data analysis methods need to adapt in high-performance analytical systems running on distributed environment which provide scalability andflexibility. Multiple Linear Regres-sion which is an empirical, statistical and mathematically mature method in data analysis is needed to adapt in distributed massive data processing because it may be poorly suited for massive datasets. In this paper, we propose MapReduce based Multiple Linear Regression Model which is suitable for parallel and distributed processing with the purpose of predictive analytics on massive datasets. The proposed model will be based on “QR Decomposition” in decomposing big matrix training data to extract model coefficients from large amounts of matrix data on MapReduce Framework with large scale. Experi-mental results show that the implementation of our proposed model can effi -ciently handle massive data with a satisfying good performance in parallel and distributed environment providing scalability andflexibility.
Keywords: Big data
Multiple linear regressionPredictive analytics MapReduceQR decomposition1 Introduction
Nowadays, the Internet represents a big storage where great amounts of information are generated every second. The IBM Big Data Flood Infographic describes 2.7 Zettabytes of data exist in the today digital universe. Moreover, according to this study from Facebook there are 100 Terabytes updated daily and an estimate of 35 Zettabytes of data generated leading to a lot of activities on social networks annually by 2020. Amir and Murtaza expressed that big data moves around 7 Vs: volume, velocity, variety, value and veracity, variability and visibility. Storing huge volume of data available in various formats which is increasing with high velocity to gain values out it is itself a ©Springer Nature Singapore Pte Ltd. 2019
big deal [3]. Big data analytics can be defined as the combination of traditional ana-lytics and data mining techniques together with any large voluminous amount of structured, semi-structured and unstructured data to create a fundamental platform to analyze, model and predict the behavior of customers, markets, products, services and so on.“Hadoop”has been widely embraced for its ability to economically store and analyze big data sets. Using parallel processing paradigm like MapReduce, Hadoop can minimize long processing times to hours or minutes. There exists three types of big data analytics: descriptive analytics which answer the question:“What has happened?”, use data aggregation and data mining techniques to provide insight into the past, predictive analytics which also replies like this “What could happen in future?” applying statistical models like regression and forecasts to understand the future. It comprises a variety of techniques that can predict future outcomes based on historical and current data and the last one, prescriptive analytics for optimization and simulation algorithms to advice on possible outcomes for the question: “What should we do to happen in future?”[7]. Extracting useful features from big data sets also become a big issue because many statistics are difficult to compute by standard traditional algorithms when the dataset is too large to be stored in a primary memory. The memory space in some computing environments can be as large as several terabyte and beyond it. However, the number of observations that can be stored in primary memory is often limited [10].
2 Regression Analysis and Big Data
Statistics takes important role in big data because many statistical methods are used for big data analysis. Statistical software provides rich functionality for data analysis and modeling, but it can handle only limited small amounts of data. Regression can be seen in many areas widely used such as business, the social and behavioral sciences, the biological sciences, climate prediction, and so on. Regression analysis is applied in statistical big data analysis because regression model itself is popular in data analysis. There are two approaches for big data analysis using statistical methods like regression. The first approach is that we consider extracting the sample from big data and then analyzing this sample using statistical methods. This is actually the traditional statistical data analysis approach assuming that big data as a population. Jun et al. [8] already expressed that in statistics, a collection of all elements which are included in a data set can be defined as a population in the respectivefield of study. That is why; the entire population cannot be analyzed indeed according to many factors such as computational load, analyzing time and so on. Due to the development of computing environment for big data and decreasing the cost of data storage facilities, big data which close to the population can be analyzed for some analytical purposes. However, the computational burden still exists as a limitation in analyzing big data using statistical methods. The second approach is that we consider about splitting the whole big data set into several blocks without using big population data. The classical regression approach is applied on each block and then respective regression outcomes from all blocks are combined as final output [6]. This is only a sequential process of reading and storing data in primary memory block by block. Analyzing data in each block separately may be convenient whenever the size of data is small enough for implementing the estimation procedure in various computing environments. However, a question, how to replace sequential processing of several data blocks that can adversely affect in response time still remains as an issue for processing increasing volume of data [12]. Jinlin Zhu, Zhiqiang Ge and et al. proved that MapReduce framework is a sort of resolution to this problem for the replacement of sequential processing with the use of parallel distributed computing that enables distributed algorithms in parallel processing on clusters of machines with varied features.
3 Multiple Linear Regression
the appropriate value for b and ƹ to predict the value of y based on the inputs parameters, x. For simple linear regression, meaning only one predictor, the model is:
Y¼b0þb1X1þe ð1Þ
This model includes the assumption that theeis a sample from a population with mean zero and standard deviationr. Multiple linear regression, meaning more than one predictor is represented by the following:
Y¼b0þb1X1þb2X2þ þbnXnþe ð2Þ where Y is the dependent variable; X1, X2,…., Xn are the independent variables measured without error (not random);b0;b1;. . .;bn are the parameters of the model. This equation defines how the dependent variable Y is connected to the independent variables X [5]. The primary goal of multiple linear regression analysis is to find b0;b1;. . .;bn so that the sum of squared errors is the smallest (minimum). The most powerful and mathematically mature data analysis method, multiple linear regression is focused on a central approach traditionally where the computation is only done on a set of data stored in a single machine. With an increasing volume of data, the transition to the algorithm in distributed environment is hardly possible to implement. Multiple linear regression, a classical statistical data analysis method, also proves unsuitable to facilitate the scalability of the data processed in the distributed environment due to computing memory and response time. In this work, our contribution is to show the adaptation of classical data analysis algorithms generally and predictive algorithms specifically for multiple linear regression providing a response to the phenomenon of big data. In big data era, it is an essential requirement to solve the transition to the scalability of the algorithms for parallel and distributed massive data processing with the use of MapReduce paradigm seems like a natural solution to this problem.
3.1 MapReduce Framework
lists of pairs with the specific keys are combined andfinally passed down to the Reduce phase. In the Reduce phase, it takes lists of <Key, Value> pairs that are resulted from previous process to compute the desirablefinal output in <Key, Value> pairs.
4 The Proposed MapReduce Based Multiple Linear
Regression Model with QR Decomposition
With the massive volume of data, training multiple linear regression on a single machine is usually very time-consuming task tofinish or sometimes cannot be done. Hadoop is an open framework used for big data analytics and its main processing engine is MapReduce, which is one of the most popular big data processing frame-works available. Algorithms that need to be highly parallelizable and distributable across huge data sets can also be executable on MapReduce using a large number of commodity computers. In this paper, a MapReduce based regression model using multiple linear regression will be developed. We focus particularly on the adaptation of multiple linear regression in distributed massive data processing. This work shows an approach that the parallelism of multiple linear regression, a classical statistical learning algorithm that can meet the challenges of big data in parallel and distributed envi-ronment like MapReduce paradigm. However, we have still a big problem or issue to solve how to split or decompose the large input matrix in computing the regression model parameter“b”for the multiple linear regression analysis. In resolving the values of“b”, we actually need to load the transpose of the input matrix and multiplication with its original matrix and then other subsequent complex matrix operations. It is impossible to process the entire huge input matrix at once. Therefore, matrix decom-position for the proposed regression model is contributed to overcome the limitations and the challenges of multiple linear regression in huge amount of data. We would like to present a new computational approach; the proposed regression model with QR Decomposition which provides computing on the decomposed or factorized matrix with scalability that is much faster than computing on the original matrix immediately without any decomposition.
rows than columns (m > n) causing a common problem arisen in many real-world applications. As we already known that data in a MapReduce processing is represented by a collection of Key-Value pairs. When we apply MapReduce to analyze matrix-form data, a key represents the identity of a row and a value represents the elements in that row [4]. Therefore, the matrix is also a collection of Key-Value pairs assuming that each row has a distinct key for simplicity although sometimes each key may represent a set of rows [2]. To determine multiple linear regression model’s coefficient, “b”the computational approach QR Decomposition is to simplify the calculation by decom-posing the data matrix X into two matrices“Q”and“R”as follows:b¼ XTX 1XTY
By Substituting X¼QR;b¼ QTRTQR 1
QTRTY;we obtain
b¼ð ÞR 1QTY ð3Þ
4.1 Implementation of the Proposed Model
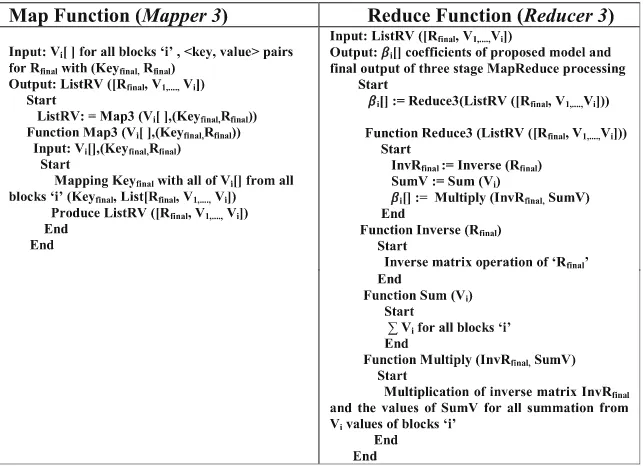
The computation of the coefficients “bi[]” of multiple linear regression using QR Decomposition on MapReduce framework will be three-stage processing or iterations to facilitate parallel and distributed processing of the proposed model in efficient manner. In the following section, we would like to present the algorithm with three-stage MapReduce processing including main or driver function in respective tables.
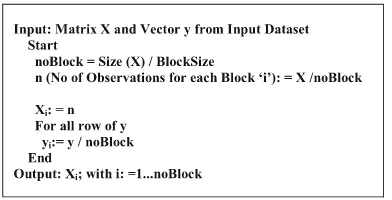
Algorithm for the Proposed Model
The algorithm for the proposed model takes as parameters block numbers to be used to divide the large training input matrix‘X’and distribute it on several tasks of “Map” functions. The ‘Map’ function of the first stage takes ‘Xi’ sub-matrices decomposed from big training data ‘X’ matrix for all ‘noBlock’. The two result matrices ‘Qi’ and ‘Ri’ with the respective ‘Keyi’ are produced for the ‘Reduce’ function. The main idea here is to highlight that each‘Map’process load into memory at the maximum size of a matrix (BlockSize, n) which significantly overcomes the problem of “out of memory” with big matrix training data. Likewise, the ‘Reduce’ process will also receive a maximum array with size (n*noBlock, n). Therefore, choosing the number of blocks should be considered according to the size or number of machines in the cluster we applied. The more increasing computing power may be simply adding new machines into the cluster for the purpose of improving the ‘MapReduce Framework Parallelism’. The second stage receives input from the result offirst stage and the yi of for all blocks ‘i’. In the ‘Map’ function, the vector y is decomposed into several vector yi (number of blocks) and then sent to ‘Reduce’ function with associated key‘Keyi’. The third orfinal stage uses the input from second stage including set of vectors of‘Vi’and‘R values of all‘Vi’vectors together to get thefinal vector V. Moreover,‘R
Table 1. Main or driver function for the proposed model
Table 2. First stage map/reduce function for the proposed model
Table 3. Second stage map/reduce function for the proposed model
5 Experimentation, Discussion and Conclusion
5.1 Experimental Setup
We applied Apache Hadoop (Version 2.7.1) Framework which already consists of MapReduce processing engine and Hadoop Distributed File System (HDFS). For cluster setup, there are three machines with the specification of CPU (2.4 GHz 4 Core, RAM 4 GB, HDD 500 GB). One machine serves as master (“NameNode”) and the rest two machines act as slaves (“DataNode”) to test our proposed model with java implementation. In this experiment, the dataset with 1.5 hundred thousand samples which is applied in the simulation of one way roads or streets navigation for city Yangon, Myanmar. This training matrix form dataset composed of“150000”rows and “225”columns. Then, the performance measures in execution time upon four condi-tions (Figs.1and 2):
1. Single or conventional processing not distributed environment without applying decomposition technique
2. Parallel processing not in distributed environment and also without applying decomposition technique
3. Single or conventional processing not distributed environment but applying decomposition technique
4. Parallel and distributed processing and also applying decomposition technique (the proposed idea) are presented in the following diagrams.
Fig. 1. The performance measures in four conditions
Fig. 2. The overall performance measures between four conditions
5.2 Discussion and Conclusion
According to the experimental results, our proposed work can handle the input massive training matrix (m, n) by distributing the computation on“Map”tasks and then local matrix decomposition function for optimization of the proposed model and finally combine and extract model coefficients“b”on“Reduce”tasks without facing any risk of“out of memory”. Moreover, we can also prove that our approach provides more efficient computation and response time in compare with others. In this paper, our contributing idea is to show that the adaptation of classical regression analysis gen-erally and multiple linear regression especially is possible to provide a response to the phenomenon of big data analysis. Therefore, our focus mainly places upon traditional multiple linear regression for parallel and distributed massive data processing with MapReduce paradigm. We intend to increase processing performance by avoiding limited memory utilization on massive data providing scalability and flexibility. Moreover, the proposed model will be provided with the purpose of solving extremely large matrices where the problems of entire matrix would not be able tofit in memory and several reads and writes to the hard disk drive would be required to do. We will consider further improvements in our proposed model by adding a preprocessing step making the input training matrix into tall-and-skinny matrix form (very large number of rows but fewer numbers of columns) which is an important and commonly used in linear regression models for the model. And then, we will present further performance evaluation results and comparative studies for prediction accuracy outcomes obtained from the model.
References
1. Adjout, M.R., Boufares, F.: A massively parallel processing for the multiple linear regression. In: 2014 Tenth International Conference on Signal-Image Technology & Internet-Based Systems (2014)
2. Ahsan, O., Elman, H.: QR Decomposition in a Multicore Environment (2014)
3. Amir, G., Murtaza, H.: Beyond the hype: Big data concepts, methods and analytics. Int. J. Manage.35, 137–144 (2014)
4. Benson, A.R., Gleich, D.F, Demmel, J.: Direct QR factorizations for tall-and-skinny matrices in MapReduce architectures. In: 2013 IEEE International Conference on Big Data (2013)
5. Dergisi, T.B., Sayfasi, D.W.: Multivariate multiple regression analysis based on principal component scores to study relationships between some pre- and post-slaughter traits of broilers. J. Agric. Sci.17, 77–83 (2011)
6. Fan, T.H., Lin, D.K.J., Cheng, K.F.: Regression analysis for massive datasets. Data Knowl. Eng.61, 554–562 (2007)
7. Florina, C., Elena, G.: Perspectives on Big Data and Big Data Analytics (2013)
8. Jun, S., Lee, S.J., Ryu, J.B.: A divided regression analysis for big data. Int. J. Softw. Eng. Appl.9, 21–32 (2015)
9. King, M.L., Evans, M.A.: Testing for block effects in regression models based on survey data. J. Am. Stat. Assoc.63, 1227–1236 (1986)
11. Nugraha, A.S., Basaruddin, T.: Analysis and comparison of QR decomposition algorithm in some types of matrix. In: 2012 Proceedings of the Federated Conference on Computer Science and Information Systems (2012)
12. Tang, L., Zhou, L., Song, P.X.K.: Method of divide-and-combine in regularized generalized linear models for big data (2016)
13. Xiang, J., Meng, H., Aboulnaga, A.: Scalable matrix inversion using MapReduce (2014) 14. Zhu, J., Ge, Z., Song, Z.: Distributed parallel PCA for modeling and monitoring of
large-scale plant-wide processes with big data. IEEE Trans. Industr. Inform.13, 1877–1885 (2009)
and Forecasting Student
’
s Career
Based on Big Data
Zun Hlaing Moe(&), Thida San, Hlaing May Tin, Nan Yu Hlaing, and Mie Mie Tin
Myanmar Institute of Information Technology, Mandalay, Myanmar
[email protected], [email protected], [email protected], [email protected],
Abstract. This paper attempts to offer the evaluation of teacher’s ability and the forecasting of students’ career opportunities. Teacher’s ability is decided based on the student’s feedback, active participation in the class, students’result in the tests and the teacher’s competency. Feedback is an essential element in the learning process. Students’feedback is an effective tool for teacher evalu-ation resulting in teacher development. The career opportunity available for a student is a significant area that determines the ranking of a university. This research will also forecast the student’s career based on their individual subject grade. The system analyzes the teacher’s ability by using Sentiment Analysis which is known as Opinion Mining technique. Student career forecast is based on predictive analytic. It comprises of a variety of techniques that predict future outcomes based on historical and current data.
Keywords: Big data
Mining
Sentiment Analysis
Predictive analytic Career
Ability
Grade
1 Introduction
The role of teachers and students’ performances is vital for the reputation of a uni-versity. An effective teacher will normally have the following features: teaching skill, class room management, knowledge of subject, knowledge of curriculum, clear objectives for lessons, engaging personality and teaching style, higher expectation upon students and communication skill.
Evaluation based on student feedback is an important strategy for informing and refining teaching quality. So, this research will analyze the teacher ability by collecting feedback from students for an individual teacher. Purpose of collecting feedback from the student is to know how the teacher’s ability can affect on the progress of teaching and learning system of the university. There are a number of factors to analyze the ability of a teacher. The teacher’s experience, knowledge and abilities largely affect to the career opportunity of students. Therefore, the system will also analyze the teacher ability through their teaching methods and classroom management, etc.
©Springer Nature Singapore Pte Ltd. 2019
Students and their performance play a key role in a country’s social and economic growth. Their creations and innovations enable to improve their university’s image. So, students’success is one of the most important things for a university.
This research will also predict the students’career. So, we can know how many students have graduated from the university and who were getting great jobs in which industries. Student’s career is forecasted by reviewing their grade upon their each subject.
This paper includes the basic concepts of relating to big data. Big data is the data sets that are voluminous and complex. There are three dimensions of challenges in data management to big data; extreme Volume of data, the wide Variety of data type and the Velocity at which the data must be processed.
A big data volume is relative and varies by factors, such as time and the type of the data. What may be deemed big data today may not meet the threshold in the future because storage capacities will increase, allowing even bigger data sets to be captured. A big data variety refers to the structural heterogeneity in a dataset. Technological advances allow firms to use various types of structured, semi-structured, and unstructured data. A big data velocity refers to the rate at which data are generated and the speed at which it should be analyzed and acted upon [1].
This paper is organized into 7 sections. Related work is presented in Sect.2 and process of the system in Sect.3. In Sect.4, implementation of the system that consists of important factors on analyzing the teacher’s ability and forecasting the student’s career. Section5contains the expected results. Conclusion is in Sect.6.
2 Related Work
There are many researches which have already analyzed the teacher’s ability and predicted the students’ grades and performances. This section describes the related work of the system. The paper by [2] compared the results of the student feedback gathered paper-based and web based survey of faculty’s teaching. Students are the main stakeholders of institutions or universities and their performance plays a significant role in a country’s social and economic growth by producing creative graduates, innovators and entrepreneurs [3].
The paper by [4] is predicting the student’s performance based on student’s interest, ability and strengths. The research work [5] predicts thefinal grade of the student from each course by using Pearson’s correlation coefficient method. Our research mainly focuses on analyzing the teacher’s ability and forecasting the student’s career. Our system will use predictive analytic.
Baradwaj and Pal [6] conducted a research to analyze students’performance based on a group of 50 students. They focused during a period of 4 years (2007–2010), with multiple performance indicators, including “Previous Semester Marks”, “Class Test Grades”, “Seminar Performance”, “Assignments”, “General Proficiency”, “ Atten-dance”, “Lab Work”, and “End Semester Marks”. Multiple factors are theoretically assumed to affect students’performance in higher education [7] and they predicted the students’performance based on related personal and social factors.
In this research paper, the aim is to focus on analyzing the teacher’s ability from the student’s feedback and forecasting the student’s career using the following attributes such as grade for each semester.
3 Processing
The student marks from period of 2015 to 2017 are collected as a dataset, which is used to create a regression to forecast the student’s career based on theirfinal grade of each year. This dataset includes features, such as practical marks, lab marks, quiz marks, surprise test marks, assignment marks, class activity marks and mid-term marks and final exam marks, which will be used to forecast the career of students.
3.1 Data Collection
For our research, the data of undergraduate students will be collected from Myanmar Institute of Information Technology during the period of (2015 to 2017). Initially about 360 student records will be collected. In our University, there are two degree programs, Computer Science & Engineering and Electronic & Communication Engineering. In our university, one hundred and twenty students increase every year. So, in the next ten years, student data will be bigger and bigger. And then, if our university expand the program such as (e.g. diploma, master, PhD), so our data will also increase more and more. So, the main goal of research is to forecast the student’s career opportunity after graduation.
Training Data. In this research paper, the whole dataset will be split into two, one is training dataset with 80% and 20% is used as testing dataset. In this research, the system will use the period of 2015 to 2017 students’data as the training phase.
Testing Data. In the testing process, we will separate 20% of CSE students from the third year from the original dataset. It will be used to test with the model.
4 Implementation
This system will implement two sections. First is analyzing the teacher’s ability and second is forecasting the student’s career opportunity.
4.1 Analyzing the Teacher’s Ability
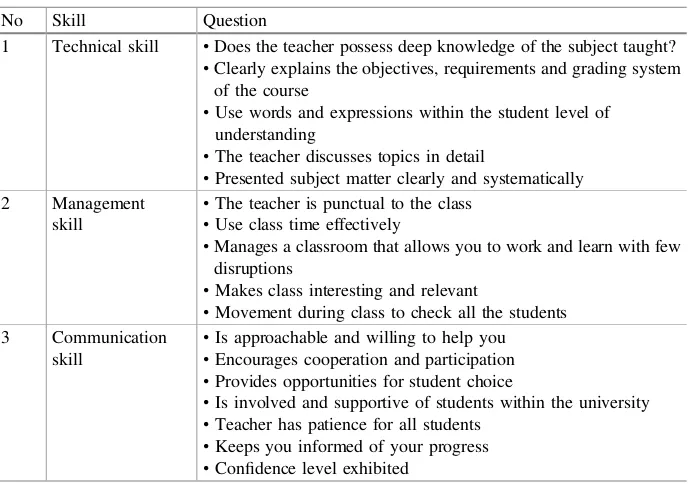
strength and weaknesses in a teaching and then can improve their teaching ability. In the feedback, there arefive rating scales to analyze the teacher’s ability. R1 is unsat-isfactory, R2 is fair, R3 is satunsat-isfactory, R4 is very good and R5 is excellent. This system will analyze the teacher’s ability based on technical skill, management skill and communication skill. The following table shows some facts that deal with above three skills (Table1).
Teacher Ability Based on Three Skills. The system gathered data from a total of hundred students who studied the degree program in Computer Science in the Myanmar Institute of Information Technology (MIIT) during the years 2015 and 2017. The system will show the teacher’s ability by bar chart based upon the skills.
The Fig. 1 shows the evaluation results of the teacher’s ability based on the questions on technical, management and communication skills of a teacher. The stu-dents responded 100% excellent rating on these questions:“The teacher is punctual to the class”,“The teacher discusses topics in detail” and “The teacher possesses deep knowledge of the subject taught”. All students gave very good rate on the question: “Teacher can thoroughly explain or use tactics another way to understand the topic”. 62% of students gave satisfactory rate and 38% of students responded in very good rate on the question: “Teacher has patience for all the students”. According to these responses, teacher can be assumed as an excellent teacher.
Table 1. Features for three skills to collect feedback
No Skill Question
1 Technical skill •Does the teacher possess deep knowledge of the subject taught?
•Clearly explains the objectives, requirements and grading system of the course
•Use words and expressions within the student level of understanding
•The teacher discusses topics in detail
•Presented subject matter clearly and systematically
2 Management
skill
•The teacher is punctual to the class
•Use class time effectively
•Manages a classroom that allows you to work and learn with few disruptions
•Makes class interesting and relevant
•Movement during class to check all the students 3 Communication
skill
•Is approachable and willing to help you
•Encourages cooperation and participation
•Provides opportunities for student choice
•Is involved and supportive of students within the university
•Teacher has patience for all students
•Keeps you informed of your progress
•Confidence level exhibited
4.2 Forecasting the Student’s Career
The important attributes in forecasting student’s career are student’s grades. Fore-casting student’s career, the system will mainly use semester grade point average (SGPA) and cumulative grade point average (CGPA). Some papers have used CGPA to predict student’s performance [8–10].
The system will forecast the student’s career by reviewing their grades. If a student possessed and conserved their best grade till he graduated, it will help them to get good career.
Student’s Career Based on Grades. The following graphs are reviewing the stu-dent’s grade points for each course. For instance, the system reviews the CSE student’s grade fromfirst year to second year.
Figure2(a) and 2(b) represent course’s grade point of each subject for each semester of thefirst year. There arefive courses infirst semester and seven courses in second semester.
Fig. 1. Student survey for teacher ability
Figure3(a) and 3(b) represent course’s grade point of each subject for each semester of the second year. There are seven course andfive lab grade points in first semester and six courses in second semester.
Figure4shows the student’s progression according to the result of his grade. The system will show the student progression by comparing Semester Grade Point Average (SGPA) every year. According to thefigure, student career will be unfavorable because his grade decreased year by year.
Fig. 2(b). 2ndSemester of 1st Year grade point
Fig. 3(a). 1stSemester of 2nd Year grade point
5 Expected Result
An expected result will show number of qualified teachers in our university, number of students who get greater jobs and how the teacher ability can effect on the students’ career. The system will show the performance of the teacher and how many out-standing students have been produced.
6 Conclusion
Our research paper is analyzing the teacher’s ability and forecasting the student’s career. Analyzing the teacher’s ability is useful to help teachers improve their teaching methodology. Feedback is an effective tool for teacher development. This paper has reviewed the feedback from the students. Forecasting the student’s career is also very useful to know the product of university and its standard. This paper forecasts the
Fig. 3(b). 2ndSemester of 2nd Year grade point
2.7 2.62
2.35
2.01
0 0.5 1 1.5 2 2.5 3
1st Semester 2nd Semester 1st Semester 2nd Semester
1st year 2nd year
SGPA
students’career with analytical methods and predictive methods. In conclusion, anal-ysis and forecast on teacher and student performance has motivated us to carry out further research to be applied in our environment. It will help the educational system to monitor the students’performance in a systematic way.
References
1. Osmanbegovi, E., Sulji, M.: Data mining approach for predicting student performance. Econ. Rev.10(1) (2012)
2. Ardalan, A., Ardalan, R., Coppage, S., Crouch, W.: A comparison of student feedback obtained through paper-based and web-based surveys of faculty teaching38(6) (2007) 3. Yadav, S.K., Bharadwaj, B., Pal, S.: Data mining applications: a comparative study for
predicting student’s performance. Int. J. Innov. Technol. Creative Eng.1(12), 13–19 (2011)
4. Dietz-Uhler, B., Hurn, J.E.: Using learning analytics to predict (and improve) student success: a faculty perspective. J. Interact. Online Learn.12, 17–26 (2013)
5. Ephrem, B.G., Balasupramanian, N., Al-Shuaily, H.: Projection of Students’Exam Marks using Predictive Data Analytics
6. Gandomi, A., Haider, M.: Beyond the hype: big data concepts, methods and analytics 7. Saa, A.A.: Educational data mining & students’ performance prediction. (IJACSA).
International Journal of Advanced Computer Science and Applications7(5), 212–220 (2016)
8. Baradwaj, B.K., Pal, S.: Mining educational data to analyze students’ performance. (IJACSA) Int. J. Adv. Comput. Sci. Appl.2(6), 2011 (2011)
9. Angeline, D.M.D.: Association rule generation for student performance analysis using apriori algorithm. SIJ Trans. Comput. Sci. Eng. Appl. (CSEA)1(1), 12–16 (2013)
10. Quadri, M.M., Kalyankar, N.: Drop out feature of student data for academic performance using decision tree techniques. Glob. J. Comput. Sci. Technol.10(2) (2010)
on Big Data Processing and IoT Architecture
Using Maximum Entropy Classi
fi
er
Hein Htet(&), Soe Soe Khaing(&), and Yi Yi Myint(&)
University of Technology (Yatanarpon Cyber City), Pyin Oo Lwin, Myanmar
[email protected], [email protected], [email protected]
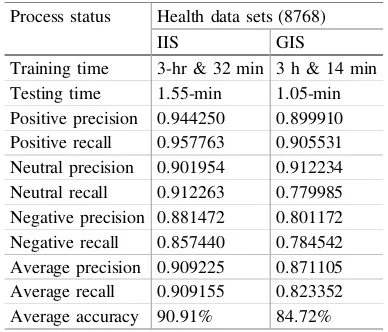
Abstract. People are too rare to discuss or talk about their health problems with each other and, it is very poor to notice about their realistic health situation. But nowadays, most of the people friendly used social media and people have started expressing their feelings and activities on it. Focus only on Twitter, users’ created tweets composed of news, politics, life conversation which can also be applied for doing a variety of analysis purposes. Therefore, healthcare system is developed to mine about the health state of Twitter user and to provide health authorities to easily check about their continental health behavior based on the Twitter data. Maximum Entropy classifier (MaxEnt) is used to perform senti-ment analysis on their tweets to suggest their health condition (good, fair, or bad). It is interacting with Twitter data (big data environment) and so, Internet of Things (IoT) based big data processing framework is built to be efficiently handled large amount of Twitter user’data. The aim of this paper is to propose healthcare system using MaxEnt classifier and Big Data processing using Hadoop framework integrated with Internet of Things architecture.
Keywords: Sentiment analysis
Big data frameworkIoT1 Introduction
Most of the people regard as an unimportant case about sharing the situation of their health problems and most of them are very poor to understand about their realistic health condition. During these days, people use social media (Twitter, Facebook, etc.) and start sharing in the public domain about feelings and activities.
Therefore, health monitoring system is developed by doing social media sentiment analysis to be useful for the people who are very poor to understand about their health state. Moreover, it is used to provide health authorities for checking about the level of their continental health behavior. Among supervised machine learning algorithms, Maximum Entropy classifier is applied in the case of tweets sentiment analysis for data training and accurately classifying to get the positive, negative, and neutral health results. Big Data processing framework is built to efficiently handle for storing steadily increased Twitter users’ data. As an overall, this paper purposes fetching tweets by applying the Twitter API, then preprocessed these data on the cloud server and crawled
©Springer Nature Singapore Pte Ltd. 2019
T. T. Zin and J. C.-W. Lin (Eds.): ICBDL 2018, AISC 744, pp. 28–38, 2019.
to the big data processing framework to store for further usages. Then, it is analyzed by the MaxEnt classifier and finally produced about the health condition percentage by positive, negative, neutral for the specific testing users or for the specific continents.
This paper is composed with eighth sections. Sections2and3are about the related work and overall system architecture. Data collection, Data store and processing, data analysis are in the Sects. 4,5and6consequently. Experimental results are explained in the Sect.7and the Sect.8is about the conclusion and future work.
2 Related Work
Sentiment analysis research on the Twitter data are doing by most of the researchers in the world.Syed Akib Anwar[1] proposed that Public sentiments are the main things to be noticed for collecting the feedback of the product. The twitter is the social media used in this paper for collecting the reviews about any product. The reviews collected are analyzed based on the locations, features and gender. Then, data extraction, data processing is performed and the product analysis using sentiment score is performed. The next researcher, Aarathi Patil[2] proposes that the sentiment analysis can be done on any product or event by using the social media based on the location. There are four major steps involved in this paper. First step is to create Twitter application which is used to mine the twitter4j and analyze the data. Next, the tweets are collected by using the secret tokens from the twitter. These collected tweets are saved in an excel
file. Preprocessing of data has been carried out and then, the filtered out tweets are classified by using the Naive Bayes classifier. The sentiment scores are provided as 1 for negative sentiment, 2 for neutral sentiment and 3 for positive sentiments.
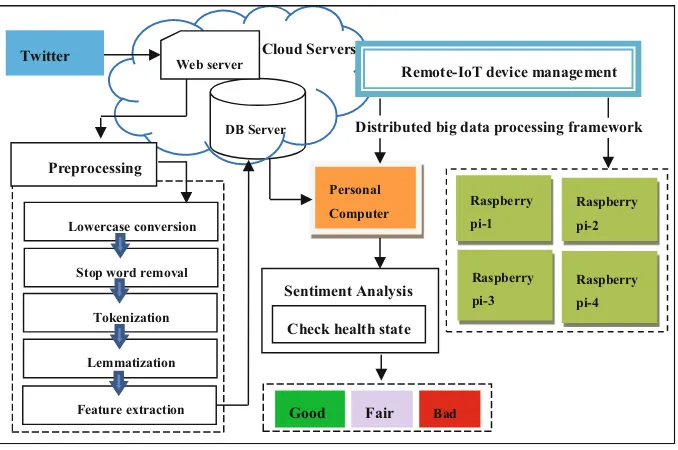
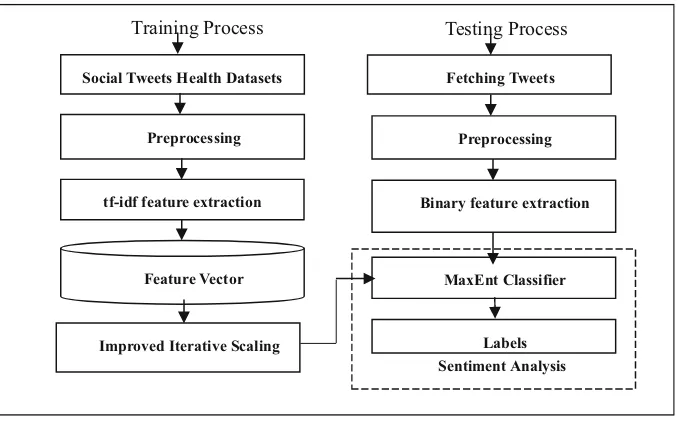
3 Overall System Architecture
Overall system architecture described in Fig.1, it is firstly crawled data from the Twitter via Twitter API to the cloud web server. These raw tweets-data need to be cleaned and so, it is going to the preprocessing stage. Preprocessing stage is very important stage which transforms the raw data into the valuable data for doing ana-lytical process. Firstly, it is needed to convert the raw tweets text into the same format (lowercase). After that, it is needed to remove stop words such as a, an, the, is, etc. Then, tokenization which breaks tweets set into each words is performed and it is needed to pass to the lemmatization stage that is grouping words based on the several grouping format in this system which are nouns, verbs, adjectives and adverbs.
After that, feature sets correspondence with the health data is added to the feature vector and this resultant feature vector will be stored back to the cloud database server. In the local side, IoT based big data distributed processing framework is built using one PC for master node and four Raspberry pi boards for data nodes. Big data processing ecosystem such as Hadoop, MapReduce, and Hive data warehouse is configured within this framework.
Sentiment analysis for stating the behavior of Twitter users’health is performed at local side framework and the predicted health state (good, fair, or bad) percentage results are shown to the tested Twitter’users.
4 Data Collection
This section is also thefirst stage of doing data analytics and involves collection of data from several types of data sources, data marts and data warehouses. In this system, data are gathering from the social media- Twitter. Open API is used to fetch data from the Twitter. To get data from the Twitter, it is required to have API, API secret key, access token and access token secret. After fulfill these requirements, it can be obtained Twitter data with the help REST API and Twitter4J. It is returned the datafile to the developers by the csv or json format. These are some sample training data concerned with health.
Positive Tweets
“Health risks of light drinking in pregnancy confirms that abstention is the safest approach\u2026 https://t.co/YcfHfoZfcB UK”.
Neutral Tweets
Negative Tweets
“15-Year-Old Gets Extreme #Cosmetic surgery-https://t.co/2Yk3XN1qPY <<”
5 Data Store and Processing
In Data Store and Processing stage, data is storing into big data’data warehouse (Hive) which is a batch oriented data warehousing layer built on the core elements of Hadoop (HDFS and MapReduce). At shown in Fig.2, the resultant feature words are imported to the Hadoop Distributed File System (HDFS) with the aid of FLUME which is used for the purpose of import and export unstructured data. The imported data from the HDFS must be send to map reduce paradigm which is also a primary usage tools in solving big data problems.
Twitter API can response up to 3600 tweets per user and maximum 200 tweets once at a time. A tweet will have maximum 140 characters and so, there will be the data size 3.6 Mb for each Twitter user to predict their health state. The more the tested users, the more storage space is required to persistence their data. Therefore, big data processing framework, Hadoop ecosystem is applied.
5.1 Hadoop
Hadoop is an open source platform based on the Java that provides implementations of both MapReduce and Googlefile system technologies. Moreover, Hadoop is an open source framework in the case of processing large scale data sets across clusters of low-cost commodity hardware. Hadoop ecosystem, one of the big data solution tech-niques, is used for handling large amount of users’testing data that are used to predict their health state and two primary components of Hadoop mainly used in this proposed system are [3]:
Data from Cloud servers
Hadoop Distributed mode (Raspberry pi 3 Model-B)
Hadoop Distributed File System
MapReduce
Hive Sentiment Analysis
Flume