Published online July 20, 2014 (http://www.sciencepublishinggroup.com/j/aff) doi: 10.11648/j.aff.20140304.12
ISSN: 2328-563X (Print); ISSN:2328-5648 (Online)
The most important factors affecting yield of the
Eucalyptus
species
Siti Latifah
1, Teodoro Reyes Villanueva
2, Myrna Gregorio Carandang
2,
Nathaniel Cena Bantayan
2, Leonardo M. Florece
31
Forestry Program Study, Sumatera Utara University, Medan, Indonesia
2
Forest Resources Management, University of the Philippines Los Banos, Los Banos, Philippines
3
Environmental Science, University of the Philippines Los Banos, Los Banos, Philippines
Email address:
sitilatifah [email protected] (S. Latifah), [email protected] (T. R. Villanueva), [email protected] (M. G. Carandang), [email protected] (N. C. Bantayan)
To cite this article:
Siti Latifah, Teodoro Reyes Villanueva, Myrna Gregorio Carandang, Nathaniel Cena Bantayan, Leonardo M. Florece. The Most Important Factors Affecting Yield of the Eucalyptus Species.Agriculture, Forestry and Fisheries. Vol. 3, No. 4, 2014, pp. 217-223. doi: 10.11648/j.aff.20140304.12
Abstract:
This study was conducted primarily to obtain factors affecting yield for forest plantation Eucalyptus spp in Aek Nauli, North Sumatera, Indonesia. The data in this study used 650 rhombic plots consisting of 106 PSPs and 544 inventory plots with several variations of plot size. Stands features referred to diameter, height, merchantable volume, age, species, spacing, site index, basal area, and density of Eucalyptus species. Geographical features referred to slope, elevation, rain fall and soil of the study area .The most important factors affecting yield of the E. hybrid, E. urophylla, and all Eucalyptus species are rainfall followed by soil group A while for E. grandis, E. pellita andmixed Eucalyptus are stand density, elevation, interaction site index and age, respectively.Keywords:
Stand, Geografhic, Yield, Eucalyptus1. Introduction
The global forest plantations have increased by nearly 12 million ha/year in 1990s, less than 4 million ha/year compared in 1980s (FAO, 2001; ITTO, 2001). This increase in forest plantations establishment indicates that there is steadily increasing investment in forestry. Therefore, the current problem is not only the availability of the investment but also the ability to plan, manage, control and sell the forest plantations products successfully [2].
Growth modeling of plantation timber species is a vital tool for the prediction of yield from future harvesting and estimating financial returns. One criterion of sustainable forest management is sustainability of yield [3]. These requirements have implications for model design, implementation and use. Reliable predictions depend on reliable models and reliable input data. The yield is dependent on several factors, the most important being the species composition, stand age, site quality, genetic variation, stand density, management regime and environmental conditions [ 4].
Forest management decisions are predicated on information and projection about current and future resource conditions. Inventories taken at one point in time provide information on current volumes and related statistics. Managers of these plantations require precise and reliable predictions of future stand yield. [3].
There are many complex and interrelated factors that influence the quantity, quality, and distribution of growth in a forest stand. Some of the more important factors are stand age, site quality, genetic variation, stand density, management regime and environmental conditions. Thus the purpose of this study is to obtain factors affecting yield of the eucalyptus.
2. Material and Method
2.1. Study Site
Porsea subdistric, Simalungun regency, North Sumatera Province, Indonesia. The study area has the highest annual rainfalll in October and the lowest in August. Based on its topography, the study area has a rainfall range of 85 – 434 mm/month, it has an elevation range from 350 to 1400 msal and it has top soil depth ranges from 10 to 44 cm. The study area covered an area 189,975 ha with Aek Nauli sector has an area 21341.8 ha.. Geographically, it is located between 02° 40’00” to 02° 50’00” north latitude and 98° 50’00” to 99° 10’00” east longitude .[ 7 ]
2.2. Materials
The concerned institutions and organizations were requested to facilitate data gathering for the research. These institutions included agencies in Indonesia such as PT. TPL, National Coordination Agency for Survey and Maping
(BAKOSURTANAL , Badan Kordinasi Survei dan
Pemetaan Nasional ), Agency for Meteorology and Geophysics-regional I Sampali , Medan, Agency for Watershed Management in Asahan Barumun, North Sumatera. Secondary data were collected from the libraries and internet-base sources of the institutions/ agencies in the Philippines and Indonesia. Libraries used included SEARCA, College of Forestry and Natural Resources (CFNR), UPLB and University of North Sumatera
The data in this study used 650 rhombic plots consistin of 106 permanent sample plots (PSPs) and 544 inventory plots with several variations of plot size, from 0.02 to 0.04 ha.. PSPs have an area of 3.44 ha. It consisted of 106 plot or 273 observations. Inventory plot has an area of 21.76 ha. It consisted of 544. Thus, the total area of the plots in this study site is 25.2 ha.
The primary data and secondary data were digitally encoded. Field observation was conducted to gather stands and geographic data. Stands features referred to diameter, height, merchantable volume, age, species, spacing, site index, basal area, and density of Eucalyptus plantations. Geographical features referred to slope, elevation, rain fall and soil of the study area.
Species were grouped into E.hybrid (E.hyb), E. grandis
(E.gra), E. pellita, E. urophylla (E. uro), mixed Eucalyptus,
and all Eucalyptus species. The data sets derived from 470 E.
hybrid, 94 E.grandis, 23 E. pellita, 46 E. urophylla and 119 mixed E. observations. E. hybrid is breeding from E.
urophylla vs E. grandis and E. pellita vs E. grandis. Mixed
Eucalyptus observations consisted of E.hybrid, E.grandis, E. pellita, and E. urophylla species.
2.3. Data Analysis
To determine the factors that most influence the yield of eucalyptus, partial coefficient determination (R2)of the final models for Each Eucalyptus species was used [8]. The coefficient of partial determination can be defined as the percent of variation. This coefficient is used to provide insight into whether or not one or more additional predictors may be useful in a more fully specified regression model.
It
helps toprovide the proportion of the variance of one variable which is predictable from the other variable. It is a way of measurement which allows determining how clear it can be in making predictions from a certain data provided. [1].
Coefficients of determination (R2) represent the proportion of SST (Total Sum of Square) that is explained by use of the regression model. It is a measure of how well the regression line represents the data [1]. The computational formula for R2 as follow:
Where:
SS reg = the regression sum of squares SS tot = the total sum of square
Usually, the higher the value of R2 is, the better the regression model will be. This is because if R2 is larger, a greater portion of the total error is explained by the included independent variable and a smaller portion of errors is attributed to other variables and randomness. The range of r-square is from 0 to 1. An R2 = 90%, implies that 90% variation in Y is attributable to the variation in X.
3. Results and Discussion
3.1. Descriptive Statistic for Stand Variables of the Study Area
Stand variables used in this study consisted of merchantable volume in cubic meter per hectare, basal area in square meters per hectare, age in year, diameter at breast height in centimeter, height in meter, site index in meter, stand density in number of tree per hectare, and spacing in square meters.
The summary descriptive statistics of the actual stand variables to develop the models are shown in Table 1. The merchantable volume ranges from 0.0003 to 289.5 m3/ha. Merchantable volume averages for E. hybrid, E.grandis, E. pellita, E. urophylla, mixed Eucaylptus and all species
The study site has a basal area ranges of 0.0128 to 28.064 m2/ha. The basal area averages for E. hybrid, E.grandis, E. pellita, E. urophylla, mixed Eucaylptus and all species are 6.59731m2/ha, 10.076 m2/ha, 10.831 m2/ha, 6.369 m2/ha, 2.372 m2/ha and 6.479 m2/ha, respectively.
The stand ranges in age from 0.17 to 6.7 years. The stand age averages for E. hybrid, E.grandis, E. pellita, E. urophylla, mixed Eucaylptus and all species are 2.0 year, 3.1 year, 3.03 year, 2.048 year, 1.34 year, and 2.08 year, respectively. In terms of stand age, E. hybrid has both the highest age (6.7year) and the lowest age (0.17 year).
24.80 cm. The average diameter for E. hybrid, E.grandis, E. pellita, E. urophylla, mixed Eucalyptus and all species observations are 7.274 cm, 11.213 cm, 10.901cm, 7.586 cm, 4.294 cm and 7.424 cm, respectively. In terms of stand diameter, E. hybrid has the highest diameter (24.80 cm) and mixed Eucalyptus has the lowest stand diameter (0.34 cm).
Regarding stand height in this study area, the stand height ranges from 31.5 to 0.14 m. The stand height averages for E.
hybrid, E.grandis, E. pellita, E. urophylla, mixed Eucalyptus
and all species are 10.234 m, 15.514 m, 12.151 m, 11.227 m, 6.667 m, and 10.449 m, respectively. In terms of stand
height, E. grandis has the highest average stand height (5.514 m) and mixed Eucalyptus has the lowest average stand height (6.667 m).
The study site has a site index ranges from 25.936 to 0.154 m. The site index averages, respectively, for E. hybrid, E.grandis, E. pellita, E. urophylla, Mixed Eucalyptus and all species are10.323 m, 15.747 m, 16.359 m, 12.255 m, 6.464 and 10.693 m. E. pellita have the highest average site index (16.359 m ) and mixed Eucalyptus have the lowest average site index (6.464 m ).
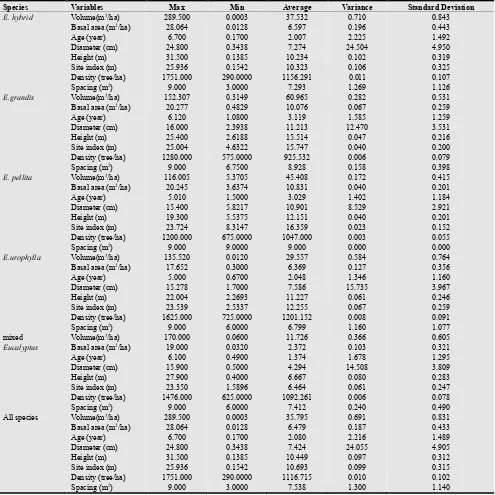
Table 1. Descriptive statistics for actual stand variables of models E. hybrid, E. grandis, E.pellita, mixed Eucalyptus and all species in Aek nauli sector
Species Variables Max Min Average Variance Standard Deviation
E. hybrid Volume(m3/ha) 289.500 0.0003 37.532 0.710 0.843
Basal area (m2/ha) 28.064 0.0128 6.597 0.196 0.443
Age (year) 6.700 0.1700 2.007 2.225 1.492
Diameter (cm) 24.800 0.3438 7.274 24.504 4.950
Height (m) 31.500 0.1385 10.234 0.102 0.319
Site index (m) 25.936 0.1542 10.323 0.106 0.325
Density (tree/ha) 1751.000 290.0000 1156.291 0.011 0.107
Spacing (m2) 9.000 3.0000 7.293 1.269 1.126
E.grandis Volume(m3/ha) 152.307 0.3149 60.965 0.282 0.531
Basal area (m2/ha) 20.277 0.4829 10.076 0.067 0.259
Age (year) 6.120 1.0800 3.119 1.585 1.259
Diameter (cm) 16.000 2.3938 11.213 12.470 3.531
Height (m) 25.400 2.6188 15.514 0.047 0.216
Site index (m) 25.004 4.6322 15.747 0.040 0.200
Density (tree/ha) 1280.000 575.0000 925.532 0.006 0.079
Spacing (m2) 9.000 6.7500 8.928 0.158 0.398
E. pellita Volume(m3/ha) 116.005 5.3705 45.408 0.172 0.415
Basal area (m2/ha) 20.245 3.6374 10.831 0.040 0.201
Age (year) 5.010 1.5000 3.029 1.402 1.184
Diameter (cm) 15.400 5.8217 10.901 8.529 2.921
Height (m) 19.300 5.5375 12.151 0.040 0.201
Site index (m) 23.724 8.3147 16.359 0.023 0.152
Density (tree/ha) 1200.000 675.0000 1047.000 0.003 0.055
Spacing (m2) 9.000 9.0000 9.000 0.000 0.000
E.urophylla Volume(m3/ha) 135.520 0.0120 29.557 0.584 0.764
Basal area (m2/ha) 17.652 0.3000 6.369 0.127 0.356
Age (year) 5.000 0.6700 2.048 1.346 1.160
Diameter (cm) 15.278 1.7000 7.586 15.735 3.967
Height (m) 22.004 2.2693 11.227 0.061 0.246
Site index (m) 23.539 2.5337 12.255 0.067 0.259
Density (tree/ha) 1625.000 725.0000 1201.152 0.008 0.091
Spacing (m2) 9.000 6.0000 6.799 1.160 1.077
mixed Volume(m3/ha) 170.000 0.0600 11.726 0.366 0.605
Eucalyptus Basal area (m2/ha) 19.000 0.0320 2.372 0.103 0.321
Age (year) 6.100 0.4900 1.374 1.678 1.295
Diameter (cm) 15.900 0.5000 4.294 14.508 3.809
Height (m) 27.900 0.4000 6.667 0.080 0.283
Site index (m) 23.350 1.5896 6.464 0.061 0.247
Density (tree/ha) 1476.000 625.0000 1092.261 0.006 0.078
Spacing (m2) 9.000 6.0000 7.412 0.240 0.490
All species Volume(m3/ha) 289.500 0.0003 35.795 0.691 0.831
Basal area (m2/ha) 28.064 0.0128 6.479 0.187 0.433
Age (year) 6.700 0.1700 2.080 2.216 1.489
Diameter (cm) 24.800 0.3438 7.424 24.055 4.905
Height (m) 31.500 0.1385 10.449 0.097 0.312
Site index (m) 25.936 0.1542 10.693 0.099 0.315
Density (tree/ha) 1751.000 290.0000 1116.715 0.010 0.102
Spacing (m2) 9.000 3.0000 7.538 1.300 1.140
Table 1 indicates that stand density ranges from 290 to 1751 tree/ha. Results show that E. hybrid has the highest
Spacing in this study site ranges from 3 to 9 m2. Results
observations has the lowest average spacing (6.799 m).
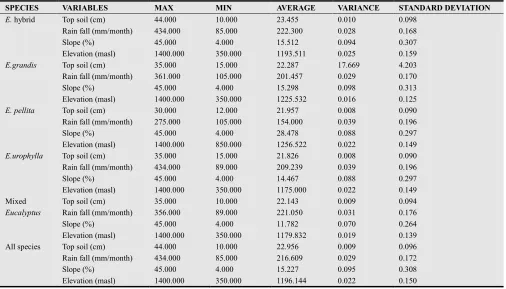
3.2. Descriptive Statistic for Geographic Variables of the Study Area
Geographic variables were obtained and these were top soil depth in centimeter, monthly rainfall in millimeter, slope in percent, elevation in masl, and groups of soil. In regression analysis, the dependent variables are frequently influenced not only by quantitative variables but also by variables of spatial, temporal or qualitative nature. Descriptive statistic about max, min, mean, variance and standard deviation for soil groups were not needed because of a nominal scale. It is no more than giving each feature a name and is thus purely subjective and descriptive in nature. It divides the data based on qualitative considerations. It is usually coded numerically by ones or zeroes to indicates presence or absence of an attribute. Descriptive statistic geographic variables to develop the models are shown in Table 2. Dummy variables for group of soil are shown in Table 3.
Table 2 indicates that top soil depth is from 10 to 44 cm. Results show that average top soil depth for E. hybrid, E.grandis, E. pellita, E. urophylla, mixed Eucalyptus and all species observations are 23.455 cm, 22.287 cm, 21.957 cm, 21.826 cm, 22.143 cm and 22.956 cm, respectively. In terms of top soil depth, E. hybrid observations have the highest
average top soil depth (23.455 cm) and mixed Eucalyptus
observations have the lowest average top soil depth (22.143 cm). Regarding monthly rainfall, Table 2indicates that E. hybrid observations has the highest average monthly rain fall ( 222.3 mm) and E. pellita observations has the lowest monthly rainfall (154 mm).
Table 2 shows that Aek Nauli sector has a field slope of 4 – 45 %. The average field slope for E. hybrid, E.grandis, E. pellita, E. urophylla, Mixed Eucalyptus and all species observations are 15.51% cm, 15.29%, 28.47%, 14.47%, 11.78% cm and 15.23%, respectively. In terms of field slope,
E. pellita observations have the highest average field slope (28.47%) and Mixed Eucalyptus observations have the lowest average field slope (11.78 %).
Aek Nauli sector has an elevation ranges from 350 to 1400 masl. Elevation in the research area averages for E. hybrid, E.grandis, E. pellita, E. urophylla, mixed Eucalyptus
and all species observations are 1193.511 masl, 1225.532 masl, 1256.522 masl, 1175.000 masl, 1179.832 masl, and 1196.144 masl, respectively. Eucalyptus grandis
observations have the highest average elevation.
The type of soil in Aek nauli sector is shown in Table 3, majority of the areas has type soil C(55.85 %) followed by and soil type A (26.33%), soil type E (10.77%), soil type D (5.32%) and soil type B (1.73%)
Table 2. Descriptive statistics for geographic variables of the models E. hybrid, E. grandis, E. pellita, mixed Eucalyptus and all species
SPECIES VARIABLES MAX MIN AVERAGE VARIANCE STANDARD DEVIATION
E. hybrid Top soil (cm) 44.000 10.000 23.455 0.010 0.098
Rain fall (mm/month) 434.000 85.000 222.300 0.028 0.168
Slope (%) 45.000 4.000 15.512 0.094 0.307
Elevation (masl) 1400.000 350.000 1193.511 0.025 0.159
E.grandis Top soil (cm) 35.000 15.000 22.287 17.669 4.203
Rain fall (mm/month) 361.000 105.000 201.457 0.029 0.170
Slope (%) 45.000 4.000 15.298 0.098 0.313
Elevation (masl) 1400.000 350.000 1225.532 0.016 0.125
E. pellita Top soil (cm) 30.000 12.000 21.957 0.008 0.090
Rain fall (mm/month) 275.000 105.000 154.000 0.039 0.196
Slope (%) 45.000 4.000 28.478 0.088 0.297
Elevation (masl) 1400.000 850.000 1256.522 0.022 0.149
E.urophylla Top soil (cm) 35.000 15.000 21.826 0.008 0.090
Rain fall (mm/month) 434.000 89.000 209.239 0.039 0.196
Slope (%) 45.000 4.000 14.467 0.088 0.297
Elevation (masl) 1400.000 350.000 1175.000 0.022 0.149
Mixed Top soil (cm) 35.000 10.000 22.143 0.009 0.094
Eucalyptus Rain fall (mm/month) 356.000 89.000 221.050 0.031 0.176
Slope (%) 45.000 4.000 11.782 0.070 0.264
Elevation (masl) 1400.000 350.000 1179.832 0.019 0.139
All species Top soil (cm) 44.000 10.000 22.956 0.009 0.096
Rain fall (mm/month) 434.000 85.000 216.609 0.029 0.172
Slope (%) 45.000 4.000 15.227 0.095 0.308
Table 3. Number and proportion of geographic variables on ranking type of soil for all species in Aek Nauli sector
Dummy –Soil Group Frequency Percent
Soil A 1 Rating = 1 198 26.330
Soil A : for group of soil dystrandepts, hydrandepts Soil B : for group of soil dystropepts, dystrandepts Soil C : for group of soil dystropepts, hapludults Soil D: for group of soil dystropepts, humitropepts
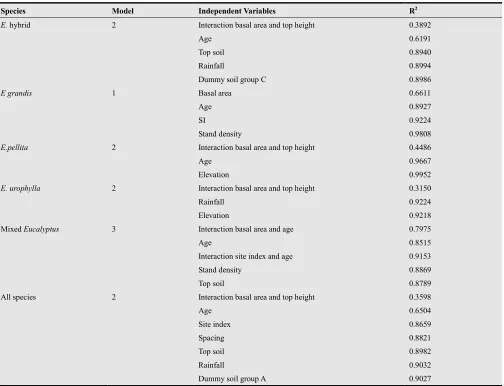
3.3. Factors Affecting Yield
Large areas of Eucalyptus plantations have the potential to alter the diversity of plant across landscapes. The effects of plantations differ strongly based on the characteristics of the surrounding landscapes and management regime (especially understory vegetation control) [11]
The main target of sustainable management of Eucalyptus
plantations is maintaining long-term productivity of the land [4]. As the Eucalyptus plantations area expands, rotation lengths shorten, and inappropriate plantation establishment and management techniques are applied. Based on the final models for each eucalyptus species, there are several factors affecting the yield of Eucalyptus plantations which can be shown in Table 4.
The most important factor affecting yield of the E. hybrid is rainfall (R2 = 89.94%), followed by dummy soil group C (R2 = 89.86%) and top soil (R2 = 89.40%). Partial coefficient Determination (R2) for rainfall is equal to 89.94 %, it means that error sum of square (ESS) can be reduced by 89 % if rainfall is added to the regression model already containing age, top soil and dummy soil group C .
Stand density is the most important factor affecting yield of the E. grandis followed by site index, because it had the highest partial R2 = 0.9808. It means that error sum of square can be reduced by 98.08 % if stand density is added to the regression model already containing basal area, top height, and age. The final model of E. grandis had the regression coefficient for stand density - 0.00054. It means that there is a decrease in volume by0.00054 per unit increase in stand density holding other independent variables constant. Stand density is a measure of how many trees are growing per unit area. Together, site and density tell us how much timber we can produce, as well as what kind of wood quality we can expect at harvest time.
Elevation is the most important factor affecting yield of the E. pellita followed by age, because it had the highest partial R2 = 0.9952. It means that error sum of square can be reduced by 99.52 % if elevation is added to the regression model already containing basal area, top height, and age.
The final model of E. pellita had the regression coefficient for elevation - 0.00023. It means that there is an increase in yield by 0.00023 per unit decrease in elevation holding other independent variables constant. Elevation affects on plants are mostly indirect, because they modify other site factors especially climate and soil. A rise in elevation is accompanied by a fall in temperature. Since the distribution of plants is limited by temperature, elevation likewise sets boundaries on species distribution [9]
Rainfall is the most important factor affecting yield of the
E. urophylla, followed by elevation, because it had the highest partial R2 = 0.9224. It means error sum of square can be reduced by 92.24 % if rainfall is added to the regression model already containing basal area, top height, and elevation. The final model of E. urophylla had the regression coefficient for rainfall 0.00351. It means that there is an increase in yield by 0.00351 per unit increase rainfall.
Interaction site index with age is the most important factor affecting yield of the mixed Eucalyptus, followed by stand density because it had the highest partial R2 = 0.9153. It means that error sum of square can be reduced by 91.53 % if site index and age are added to the regression model already containing basal area, age, stand density and top soil. The final model of mixed Eucalyptus had the regression coefficient for interaction site index with age 0.81678. It means that there is an increase in yield by 0.81678 per unit increase in interaction site index with age holding another independent variables constant.
Table 4. Partial coefficient determination (R2)of the final models for Each Eucalyptus species.
Species Model Independent Variables R2
E. hybrid 2 Interaction basal area and top height 0.3892
Age 0.6191
Top soil 0.8940
Rainfall 0.8994
Dummy soil group C 0.8986
E grandis 1 Basal area 0.6611
Age 0.8927
SI 0.9224
Stand density 0.9808
E.pellita 2 Interaction basal area and top height 0.4486
Age 0.9667
Elevation 0.9952
E. urophylla 2 Interaction basal area and top height 0.3150
Rainfall 0.9224
Elevation 0.9218
Mixed Eucalyptus 3 Interaction basal area and age 0.7975
Age 0.8515
Interaction site index and age 0.9153
Stand density 0.8869
Top soil 0.8789
All species 2 Interaction basal area and top height 0.3598
Age 0.6504
Site index 0.8659
Spacing 0.8821
Top soil 0.8982
Rainfall 0.9032
Dummy soil group A 0.9027
Rainfall is the primary of water in the forest plantations. The amount of rainfall actually reaching the forest floor depends on the characteristics of the canopy, rain, and other climatic factors. Rainfall in Eucalyptus plantations plays two major roles, namely: as a factor causing soil detachment, dispersal and transport and a supplier of moisture to the soil. Water is considered to be a vital factor in the life of
Eucalyptus plantations affecting growth and reproduction of the various organisms found therein
4. Conclusions
The most important factors affecting yield of the E. hybrid, E. urophylla, and all Eucalyptus species are rainfall followed by soil group A while for E. grandis, E. pellita and mixed Eucalyptus are stand density, elevation, interaction site index and age, respectively. The main target of sustainable management of Eucalyptus plantations is maintaining long-term productivity of the land. Resource managers and decision makers should consider the most important factors affecting the yield namely; for, E.
urophylla, and E. all species are rainfall followed by soil group A while for E. grandis, E. pellita and mixed
Eucalyptus is stand density, elevation, interaction site index and age, respectively.
Acknowledgement
This research is part of PhD thesis of the first author funded by SEAMEO-BIOTROP DIPA 2008. The authors extend deeply acknowledgment to the Ministry of Education and Culture – Republics Indonesia for scholarship and support to accomplish this paper. Sincerely appreciation is also extended to anonymous reviewer for correction and comments. Gratitude is also extended to PT. Toba Pulp Lestari which gave permission to conduct this research in its area.
References
[1] ANALYST SOFT. 2008. Stat Plus.
[2] Aruan a. l. P. 2000. The Future Role of Plantation Forests and
Forest-Based Industry.
Http://Www.Fao.Org/Docrep/Article/Wfc/Xii/0142-A1.Htm [3] AVERY, T.E and H.E BURKHART. 1994. Forest
Measurement. Fourth Edition. New York: McGraw-Hill, Inc. 408 pp.
[4] DAVIS, L.S., K.N. JOHNSON, P.S. BETTINGER and T.E. HOWARD. 2001. Forest Management to Sustain Ecological, Economic and Social Values. McGraw-Hill Companies, Inc. 1221 Avenue of the Americas, New York. NY 10020. 804 p. [5] FAO. 2001. Global Forest Resources Assessment.2000. Main
report.FAO, Rome, Italy. 479 p
[6] ITTO. 2001. Annual Review and Assessment of the World Timber Situation.
[7] PERSEROAN TERBATAS TOBA PULP LESTARI (PT. TPL). 2008. Summary of the Annual Work Plan Efforts Timber Forest Products Utilization in the Industrial Timber Plantation Forests.
[8] LATIFAH, S. , VILLANUEVA TR, CARANDANG, MG, BANTAYAN, N.C, FLORECE, L.M. 2014. . Predicting Growth and Yield Models for Eucalyptus Species in Aek Nauli, North Sumatera, Indonesia. Journal of Agriculture, Forestry and Fisheries. Vol. 3, No. 4, 2014, pp. 209-216. doi: 10.11648/j.aff.20140304.11
[9] VILLANUEVA, T. R. 2005. Upland Ecosystem Management. Second Edition. University of the Philippines. Open University, Laguna, Philippines.
[10] WEI, X, and NUNO M.G.B. 2000. Genetic Gains and Levels of Relatedness from Best Linier Unbiased Prediction of
Eucalyptus Europhylla for Pulp Production in Southeastern China. Canadian Journal of Forestry Research. 30 (10): 1601-1607