Chair of Technical Information Systems, Dresden University of Technology, Germany
Chair of Technical Information Systems Department of Computer Science Dresden University of Technology D-01062 Dresden, Germany
http://www.iai.inf.tu-dresden.de/en/tis/index.html
Log-based State Machine Construction for
Analyzing Internal Logistics of Semiconductor
Equipment
Technical Report
by Volodymyr Vasyutynskyy
Based on:
Röder, A.; Vasyutynskyy, V.; Kabitzsch, K.; Zarbock, T.; Luhn, G.: Log-based State Machine Construction for Analyzing Internal Logistics of Semiconductor Equipment.
Log-based State Machine Construction for Analyzing Internal
Logistics of Semiconductor Equipment
André Röder
1, Volodymyr Vasyutynskyy
1, Klaus Kabitzsch
1, Thomas Zarbock
2, Gerhard Luhn
21 Dresden University of Technology, Faculty of Computer Science
D-01062 Dresden, Germany. E-mail: {aroeder, vv3, kk10}@inf.tu-dresden.de
2
Infineon Technologies Dresden GmbH & Co. OHG Königsbrücker Str. 180, D-01099 Dresden, Germany E-mail: {Gerhard.Luhn,Thomas.Zarbock}@infineon.com
Abstract
For evaluation of equipment productivity and diagnosis purposes state-transition models of equipments are necessary. In most cases these models are not provided by equipment manufacturers and therefore must be constructed by analysts (process engineers) based on log files. The construction of such models is a very time-consuming process that is impeded by the unknown structure of the events in the logs. The approach presented in this paper aims to automate the process of model construction by combining finite state machine generation with event text analysis. Some heuristics and user interaction are used to increase the efficiency of the model generation process. The approach was tested on different equipment types at Infineon Dresden.
Section 1 Introduction
Today more than ever, a high pressure of competition and a small profit per unit characterizes the semiconductor market. As production equipment is more expensive compared to other industries, the raising of equipment utilization is very important for manufacturers competing in this market to follow Moore’s Law. In fact, nowadays equipment productivity is, after miniaturization, the second most significant factor in lowering production costs and rising efficiency [1], and its potential is still growing.
To support semiconductor manufacturers in measuring the equipment utilization, Semiconductor Equipments and Materials International organization (SEMI) released several standards defining productivity indicators. One of them is SEMI E79 Standard [2] introducing overall equipment efficiency (OEE) and intrinsic equipment efficiency (IEE). While OEE calculation is already widely automated, there are still some obstacles in the automation of IEE calculation. The major problem is the measurement of the “value-added in-process time”, which reflects the time periods used for the processing steps for one object (e.g. wafer) done by the equipment. An evaluation of these time periods is enabled by event log messages provided by the equipment. The events contain information about changes of the inner states of each of the equipment modules, eventually along with the actual time stamp and the identifier of processed object. To calculate time periods from the event log, a state-transition model of the equipment and the proper assignment of events to equipment states is required. Unfortunately, these models are normally not provided by equipment manufacturers. Therefore, these models have to be re-engineered by analysts at the equipment users side. Another SEMI Standard used in this context is SEMI E90 [3], which provides information needed for IEE calculation. Both events and their specification are satisfying this standard only poorly and are under steady changes by most equipment suppliers since the SEMI E90 is relatively new. Manual inspections of equipment event logs at Infineon Dresden showed the need for optimization of equipment internal logistics (IEE improvement). As the equipment internal logistic problems are equipment specific, inspections have to be done for each equipment type. Since manual log inspection is a very time-consuming process, an automatic construction of state-transition models is required. The automation in this task enables a fast identification of logistic problems and a detailed basis for tool-to-tool matching. The resulting state-transition models can be also used for diagnosis purposes [4].
Some recent works ([5], [6], [7]) used log files to generate the state-transition models in form of finite state machines or Petri nets for applications in various domains like software path analysis, data mining etc. However, these works assumed that the event structure is known and have not taken in account event attributes that may be ambiguous. For semiconductor equipment a standardized event protocol is absent not only between different manufacturers but also within the same equipment type. As a consequence, event logs of different equipment types or different modules of same equipment differ a lot, even if the tools are providing equal functionality. In addition, not all available events are enabled by default, causing gaps in the logs. As consequence, the analyst needs help for investigating the event structure.
generation with the analysis of event text structure with the help of Levenshtein distance [8]. It also uses some heuristics and user interaction to increase the analysis efficiency. It allows the user to analyze event logs of semiconductor equipment profoundly, resulting in rapid evaluation of productivity indicators for different types of equipment. Further applications of generated models are fast analysis of equipment internal substrate movement parameters (usage of equipment modules, process duration etc.), fault detection and classification, tool-to-tool matching (best module, „golden tool“ construction) etc. If test logs of equipment are available, even evaluation of the equipment before its purchase is possible. The generated models can also provide data for simulation tools. The obtained models and performance characteristics can also be helpful for communication with equipment manufacturers in case of trouble, since more precise situation descriptions can be delivered. The corresponding tool
ModelGenerator implements the approach. The results of the log analysis can be visualized in the tool in multiple ways, supporting the analysts’ intuition. The algorithm was tested on a set of logs from four equipment types at the Infineon Factory in Dresden.
The article is organized as follows. Section 2 describes the general algorithm of the model generation. In Section 3 the relevant steps of the algorithm are considered. The achieved results and conclusions are discussed in Sections 3 and 4 appropriately.
Section 2 Method Description
Assumptions
First of all, some considerations about equipment construction and event logging have to be made. From the logistical point of view, equipment consists of stations (modules) that transport, process or store substrates, e.g., wafers. Events are generated if some actions or logging conditions have been fulfilled. The event logs are permanently saved in operational databases. The separate events (records) include the following attributes:
Time stamp of event logging. The time format may differ for different equipment types. The granularity of the time stamp should be sufficiently small to define the order of events. This condition is not always fulfilled.
•
Module information like module name etc. These names are very often ambiguous. Then, it may be necessary to compose lists of equivalents of modules and their names.
Substrate information. To enable substrate tracking through the equipment, unique substrate names should be provided. The minimum level of detail requested by the SEMI E90 standard is the substrate name providing information of the substrate lot and the slot used by the substrate. However, in most cases equipments only provide substrate names that consist of the name of the station through which the substrates transport box entered the equipment and the slot name in the box. It is important to track out the parallel moves of substrates in equipment, otherwise the complicated and not always robust methods are required to separate such concurrent processes like in [9].
Event parameters that include information about process values like temperature, pressure, etc. These parameters as rule have no influence on the construction of state-transition models, so they can be omitted during model generation.
The following assumptions are made about the event structure:
The time format of the events has to be known. Usually the time format can easily be read from the log manually. An automatic recognition of the time format is not provided as the algorithm would need too much background information.
The level of details of the logs must be sufficient for analysis purposes. Usually not all possible events are enabled since it would lead to an overload of communication channels and produce an unnecessary data volume. Nevertheless, some types of events must always be enabled to support the determination of important characteristics. In some cases, additional events can be switched on to test some modules of the equipment more precisely.
The events have to be separated from each other in a log. Usually, each event is deposed in a new text line. Log files must be long enough to allow the complete coverage of all possible states. This length depends on scheduling mechanisms. The log must include several substrate-processing cycles.
The parameters of the events have to support the aggregation of events to event types. Therefore, they have to provide a unique text pattern for each event type, e.g., some parts of the events must give a hint about its event type. This feature allows applying the text analysis algorithms.
Equipment model (substrate move model), representing the equipment from the substrate point of view. It consists of the equipment modules and describes the internal structure of the equipment. It also describes the paths on which substrate objects are routed through the equipment. The non-deterministic finite automata (NFA) are used, where the equipment stations correspond to states and the moves of the substrate objects between them to the transitions of NFA. These moves are identified by so called move events. This model is able to describe the parallel wafer moving processes. The moving route of a single wafer is a subset of this model.
•
• Station model (module model), representing the order of events in a single station or module of the equipment. It specifies the inner states and transitions inside of one equipment component. Since only one substrate can be processed in the station at a moment, the deterministic finite automata (DFA) are sufficient for this case.
The hierarchical model allows the adequate representation of the equipment and simplifies the model generation, since the event log can be filtered for each submodel before generation. For the construction of the equipment model only move events are used. If the construction of a station model is intended, the log is filtered for events associated to this station. Figure 1 shows the equipment model of AMAT Centura Etching
Figure 1: The hierarchical model of equipment.
General Algorithm
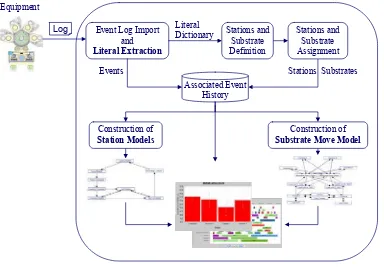
According to the assumptions made, an algorithm for the semi-automatic construction of equipment models was developed. The flow chart of model generation is shown in Figure 2.
Figure 2: Flow chart of model generation.
Station
The basic steps of the algorithm are as follows:
•
Literal extraction. The text of each event is divided in character sequences, named literals, which are defined as a sequence of characters between two delimiters, e.g., blanks. The result is saved in a dictionary, which is intended to help the analyst to identify equipment module and substrate object names used in the event log. The user can assign one or more literals to each equipment module or substrate object, since modules and objects can be labeled ambiguously in a log.•
Assignment of events to modules and substrates. Based on the assignments of the previous step, the event log is parsed again. Every log event is assigned to the equipment modules and substrate objects, whose literals were found in the event text.•
Aggregation of event types. A similarity recognition algorithm is used to aggregate event types from the events of the given event log. The basic idea behind this step is that events of one type are equal in a certain sequence of literals, called stem. They may differ in other literals representing actual values provided by the event, e.g., wafer number, temperature etc. The similarity of the event to the event type is defined according to a modified version of the Levenshtein distance [8].•
Construction of the equipment model. To build the equipment model, the algorithm extracts move events that always belong to two equipment modules and a substrate object.•
Construction of module models. The temporal order of the assigned event types in the log is analyzed to provide more profound information about the internal states of an equipment module. The analyst may disable irrelevant types to support the algorithm. The result is a complete state-transition model of a module.•
Visualization. The results of log analysis are presented in a variety of visualizations. The steps are discussed in the next section in detail.Section 3 Model Generation
Preliminary analysis
Event Log Import and Literal Extraction
Before the identification of event structure can start, the text of each event is divided in character sequences, or
literals, which are substrings separated by some delimiters (usually blanks or semicolons). The delimiters have to be specified by the analyst. The literals are the elementary smallest “bricks” of the event text taken in account. The auxiliary characters like numbers or symbols (commas, hyphens etc.) are ignored since they do not provide relevant information about the event type. Only literals containing at least one character, which were not ignored, are saved then in a literaldictionary.
Station and Substrate Definition
The next problem to be solved is the ambiguous labeling of items (modules and substrates). To enable the construction of an equipment model all synonym labels of a station or a substrate have to be associated to their owner. Since the station and substrate terms in the log are not standardized, a user dialog is necessary to perform this task. The assignment has to be done only once, when a new equipment type is analyzed or new events were switched on for logging in the already analyzed equipment. Otherwise, the synonyms are simply mapped to the stations or substrates on the basis of the available synonym dictionary while reading the log file.
Equipment Model Construction
The equipment model represents the paths within the equipment on which substrate objects can move between the equipment stations. The states of the model correspond to the stations. Move events represent the substrate movements in an event log. If a move event exists that reflects the move of a substrate between two stations, the station nodes in the model are linked in the appropriate direction. The model-constructing algorithm filters such events from the event log and tracks the path of every substrate.
The analyst can edit the generated model to adapt the presentation to his taste. The models can be saved for using in later evaluation, e.g., comparing with other equipments. In addition, statistical information about the frequency of the usage of paths between two stations is obtained in this step.
Figure 3: Equipment model generated based on an event log with 2000 records (screenshot of ModelGenerator). Equipment: AMAT Centura dry etching tool.
Aggregation of Events to Event-Types
Next problem is the unknown structure of the event text that is in most cases formulated in sentences that can be read by analysts. The parameter values are spread over the event text without a particular structure. For model analysis an event type must be defined, which characterizes the basic meaning of certain groups of events. Events of the same type refer to the same state transition within a station. They may differ in the parameter values or referred substrates.
In the majority of cases the equipment manufacturers do not provide any description of available event types. Therefore, the event types have to be aggregated from the set of log event instances. This is achieved by comparing events and grouping similar ones. The idea behind this comparison is that events of the same type are equal in some literals, a so-called kernel of the event type. Similar
events are grouped by using a kind of prefix trees
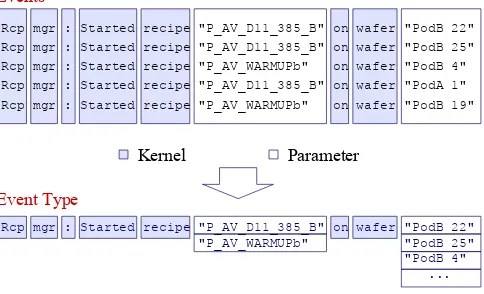
that contain the literals of the event text. Each literal position in the event is represented as a branch in the event type. The literals of similar events are added as leafs to the branches of the event type stem. The kernel of the event type is represented by the branches. These branches have only one leaf, since they are supposed to contain the unique attribute of the event type. The literals that contain the parameter values, e.g., wafer parameters or temperature, correspond to the branches with more than one leaf, because their values vary. An example of the reconstruction of the event type from a set of events is shown in Figure 4.
Parameter Kernel
Rcp mgr : Started recipe "P_AV_D11_385_B" on wafer "PodB 22" Rcp mgr : Started recipe "P_AV_D11_385_B" on wafer "PodB 25" Rcp mgr : Started recipe "P_AV_WARMUPb" on wafer "PodB 4" Rcp mgr : Started recipe "P_AV_D11_385_B" on wafer "PodA 1" Rcp mgr : Started recipe "P_AV_WARMUPb" on wafer "PodB 19"
Rcp mgr : Started recipe "P_AV_D11_385_B" on wafer "PodB 22" "P_AV_WARMUPb" "PodB 25" "PodB 4" ...
Event Type Events
Figure 4: Reconstruction of the event type from five events.
Distance Function
The manual assignment of events to event types by the analyst is a very time-consuming and error-prone process. To automate this process, similarity metrics for events and event types have to be defined. Levenshtein distance ([8], [10]) is used in this approach for this goal, which is both simple and general enough to cope with different types of logs. In its classic form, Levenshtein distance defines the similarity of two words. It uses a number of elementary operations to transform one word in another by transformation of single symbols. To adapt this similarity metric to the analysis of literals, Levenshtein distance was slightly modified in following way.
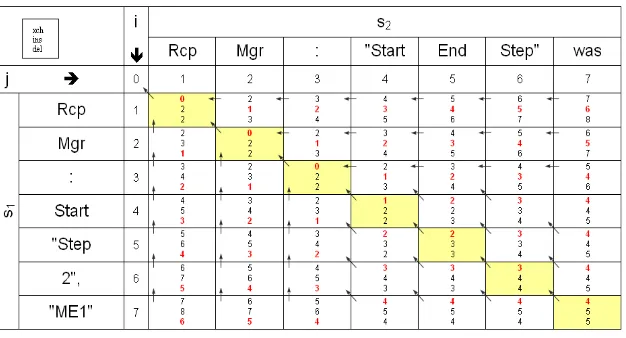
The distance between event e and event type E is defined as the number of literal modifications required to transform the event type in certain event. Three elementary transformation operations are distinguished:
Insert a literal of the event into a branch of the event type: insLeaf.
• •
The distance between the event and the event type is calculated by assigning costs to each elementary transformation operation and summing the costs of all operations needed to modify the event type. The path with minimal costs is calculated using the distance matrix with dimension i × j (s. Figure 5), where:
i = (number of literals in e) + 1
The costs of each operation type ci are given, as well as the maximal allowed distance from the event to the event type Dmax. The event types of a station are aggregated with the following procedure:
For each event of the station e and every known event type E the distance D(e, E) is calculated as shown in Figure 5.
If D(e, E)<Dmax, the event is assigned to the event type and the elementary operations are performed by following the cheapest path in the matrix using a backtracking algorithm. Since each event can be assigned to only one event type of a station, the procedure proceeds with the next
The values of operation costs and maximum distance are critical for the accuracy of algorithm. The following values turned out to be suitable for most logs:
Costs ci = 6...8 for each operation;
Maximum distance Dmax = 1...2 x number of branches of the event type.
The result is an automatically generated set of event types. In some cases events are aggregated. This may happen, if the distance of two manually distinguishable event types is lower than Dmax. The erroneous event types have to be corrected by the analyst. This is done with the help of a dialog, in which the analyst can decompose an erroneously combined event type in different ones, or delete the irrelevant event types.
The duration of the assignment procedure is linear to the number of events, i.e., O ~ O(n), where n is the number of events in the log. In practice, it takes only a few seconds for most logs and is negligible, since most time of the event type analysis is spent with fine tuning the algorithm parameters and correcting erroneously aggregated event types.
Station Model Construction
The station model is based on the reconstructed event types, which correspond to the states of the model. The transitions are built according to the temporal sequence of the events in the log that are associated to the event types. If event type E1 of a station is followed by event type E2 in the event log, a directed transition from E1 to E2 is added to the model. The model is built by iterating through the filtered event log and adding all detected transitions to the model. Such a straightforward algorithm is possible since all relevant event types were defined in the previous step, and no iterations or concurrent processes are possible. The different statistics about dwelling times etc. are extracted from the model automatically.
The resulting model can be represented by a directed graph. The analyst has the possibility to edit the generated models to correct mistakes made during model building. It should be mentioned, that the graphical representation of station models gives a lot of hints to the analyst. For instance, the faults can be easily detected in the log by following symptoms:
The false order of events in the log is detected as redundant transitions. The possible causes are false time stamps of events in the log, false scheduling or incorrect station assignment.
Redundant or missing states, appearing due to the erroneous station assignment, false events in a log etc. Extraordinary long or extraordinary short dwelling times, different alarms etc. may indicate scheduling problems in the equipment.
Visualization
Currently, the following types of visualizations were implemented:
State-transition graphs represent the resulting models, as shown in Figure 3. They are produced for each equipment type. The analyst can edit the graphs to adapt them to his vision.
• •
•
• • •
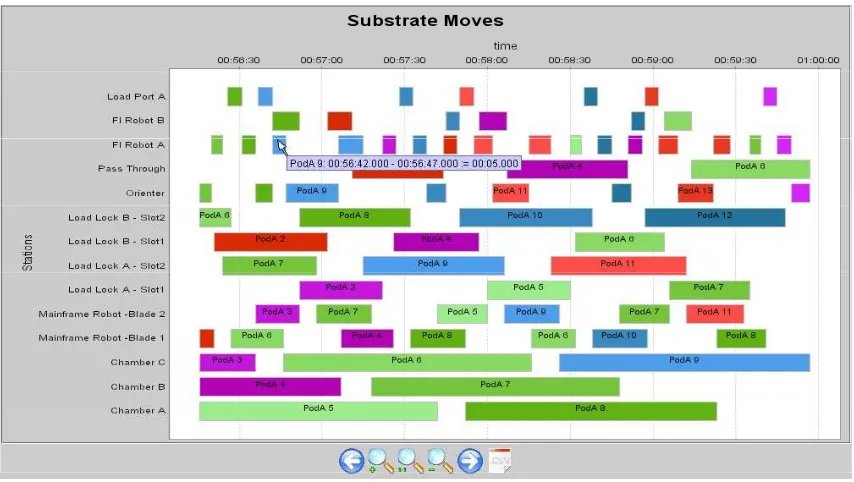
Gantt diagrams for station and substrate models, as recommended in [12]. They are produced for each log separately and allow following the movement of wafers through stations along with appropriate dwelling times and stating duration times of stations. An example of a Gantt diagram is shown in Figure 6.
Statistical charts with processing times of different stations and states, providing a general overview of the equipment productivity. By selection of the relevant stations additional details of equipment logistics can be viewed, e.g., extraordinary long or short processing times, large differences between the processing times in the stations with the same functionality (balancing problems) etc.
Figure 6: Gantt diagram for station and substrate model.
Section 4 Results
The tool was successfully tested for four equipment types: AMAT Centura Etchers, AMAT Endura Sputters, Novellus' SPEED CVD tools and Mattson ASPEN III Ashers. A significant acceleration of the event log analysis is a main achievement of the application of ModelGenerator. As usual, the manual evaluation requires 6-8 hours of analytical work for relatively small logs (2000 events and 22 states in an equipment). By using the developed tool this time was decreased to 30-40 Min. It should be mentioned, that the automatic generation of models alone takes about several seconds for most logs, although the tool was implemented in comparatively slow Java.
The number of erroneously aggregated events depends highly on the quality of the event logs and the parameters provided by the analyst. In most cases the amount of such event types could be reduced to a few ones by fine tuning the parameters. The most time during analysis took the manual event selection and correction of erroneously aggregated events. This step could not be further automated with the presented approach since the event texts were too arbitrary. Involving of further heuristics and more sophisticated similarity metrics may potentially bring a further improvement of accuracy, though experience tells that this would require too much development efforts. The proposed approach seems to be a good compromise between accuracy, development support and need for model correction by the analyst. The following factors influence the accuracy of generated models:
Structure of the event log: number of events, structure of the literals in an event, level of details of the log, gaps in the log, log length.
Definitions of stations and substrates: accuracy of the manual mapping of literals to stations and substrates by the analyst.
produced models, statistics and pictures can be exported to other tools for further analysis. The models can be also imported, e.g., if they were delivered by the equipment manufacturer or produced earlier. In that way available a priori information can be used in analysis.
Section 5 Conclusions and Future Work
This paper introduced an approach to log-based model generation, implemented in tool ModelGenerator. The goal was to automate the analysis of equipment logs through constructing finite state machine models in a semi-automated way. Event text analysis by means of the modified Levenshtein distance was used for discovering event types. Based on the found events the finite state machines were constructed. Though some actions have to be still performed by the analyst, the usage of the tool allows a significant acceleration of the log analysis. Since more than 100 types of equipment exist in a factory, the automation of their analysis facilitates more profound and effective evaluation. The detailed and consistent analysis of event logs at the factory may force the equipment manufacturers to provide more structured and better described logs. But even in that case the event text analysis may be necessary for merging or filtering of logs from different equipments or modules.
Future work will concern the further automation of tool performance evaluation. The comparison of models generated from the same tools in different time periods or from different equipments of the same type will be considered. The comparison will be made on the basis of model states and dwelling times, compared with historically best values. This would facilitate the construction of a “golden tool” providing a goal for further optimization activities. Further statistical data will be generated, like correlation of different events, connection to process models and shop floor level, detection of complex substrate movement patterns, automatic generation of IEE-values. This statistics will also be useful if equipment manufacturers will deliver the equipment models.
References
1. Shade, B., “Increase Productivity through E-Manufacturing”, semiconductor international, Vol. 24, No. 8 (2001), pp. 101–108.
2. SEMI-E79, “Standard for Definition and Measurement of Equipment Productivity, Semiconductor Equipment and Materials International”, rev. E79-0200.
3. SEMI-E90, “Specification for Substrate Tracking, Semiconductor Equipment and Materials International”, rev. E90-0702.
4. Kabitzsch, K., Kotte, G., Vasyutynskyy, V., “Monitoring and Diagnosis in MES of Semiconductor Manufacturing with EXTRAKT”, Proc. INCOM 2004, 11th IFAC Symposium on Information Control Problems In Manufacturing, Salvador, Brazil, April 2004.
5. Kabitzsch, K., Hartenstein, D., Miosga, I., “Automatische Generierung von
Zustandsmaschinenmodellen aus Ereignisspuren“. Elektrie, Berlin 49 (1995), pp. 473-477 (in German).
6. Cook, J. E., Wolf, A. L., “Discovering Models of Software Processes from Event-Based Data”, ACM Transactions on Software Engineering and Methodology, Vol. 7, No. 3. (1998), pp. 215-249.
7. Hong, J.-P., Kim, J.-K., Han, J.-H., Chae, S.-K., “Throughput Analysis and Productivity Enhancement for CVD Equipment“, Proc. ASMC’04, IEEE Advanced Semiconductor Manufacturing Conference, 2004, pp. 48-51.
8. Levenshtein, V. I., “Binary Codes Capable of Correcting Deletions, Insertions and Reversals”, Soviet Physics Doklady, Vol. 10 (1965), pp. 707-709.
9. Cook, J. E., Du, Z., Liu, C., Wolf, A. L., “Discovering Models of Behavior for Concurrent Workflows”. Computers in Industry, Vol. 53 (2004), pp. 297–319.
10. Okuda, T., Tanaka, E., Kasai, T., “A Method for the Correction of Garbled Words Based on the Levenshtein Metric”, IEEE Transactions on Computers, Vol. C-25 (1976), pp. 172-177.
11. Kozen, D.C., “Automata and Computability, Undergraduate Texts in Computer Science”, Springer Verlag, (1997).