WEB MAPPING SERVICES IN A CROWDSOURCE ENVIRONMENT FOR DISASTER
MANAGEMENT: STATE-OF-THE-ART AND FURTHER DEVELOPMENT
Piero Boccardo a, Paolo Pasquali b
a
Politecnico di Torino, DIST (Dipartimento Interateneo Di Scienze, Progetto e Politiche Del Territorio), viale Matteoli 39, 10125 Torino, Italy – [email protected]
b ITHACA Information Technology for Humanitarian Assistance, Cooperation and Action, via P.C. Boggio 61, 10139 Torino, Italy – [email protected]
ISPRS and OGC: Open Geospatial Consortium Forum
KEY WORDS: GIS, Impact Analysis, Interoperability, Mapping, Spatial Infrastructures, Web based
ABSTRACT:
The Haiti earthquake in 2010 has been considered a turning point in disaster response because of the support provided by collaborative communities such as OpenStreetMap, Ushahidi, CrisisMappers, Google MapMaker and others. Taking advantage of post-disaster satellite imagery these virtual communities were able to give an impressive contribution in mapping affected areas and in damage assessment. Nowadays the crowd sourcing, whether made of experts or not, can play an important role in preparedness and disaster response. In recent years the increase of web applications’ capabilities have enabled more efficient crowd sourcing of environmental data. The most successful integration of tools and data between organizations, institutions or even individuals, happens when the most open standards for interoperability are adopted, such as Web Mapping Services and Web Feature Services, defined by the Open Geospatial Consortium. In order to be widely accepted, the applications should be likely open source. It is unlikely that a single platform can fit every need or terms of use can be broadly accepted (e.g. data ownership). Therefore some organizations could prefer having more control on the application by downloading and running it as their own shared data repository and possibly as a hub for external contributors. Nevertheless, other users could prefer to access to a hosted site where they can simply upload and share their contributions. This paper will illustrate the GeoNode open source application and the principles behind the developing of a community. GeoNode is an example of how an application can be use as a global platform or as a distributed data node to promote the collaborative use of spatial data.
1. A MAJOR DISASTER RESPONSE
1.1 The 2010 Haiti earthquake
One of the key factors for the success of emergency operations is the access to updated and reliable reference datasets. They are the basic geographic framework on top of which additional spatial information (e.g. affected areas, damage assessment) can be produced and disclosed in order to help decision makers and field staff plan disaster response operations.
The 7.0 Mw earthquake that struck Haiti on January 12, 2010, with an epicentre near the capital Port-au-Prince, affected three million people killing more than 200,000 (according to government estimate). It was also reported that more than 1,000,000 people were made homeless and 250,000 poorly constructed residences and 30,000 commercial buildings collapsed or were severely damaged. One of the most devastating disasters of the last decades hit the poorest Western hemisphere country making more difficult the jobs of rescuers and aid workers by the lack of information about the layout of Port-au-Prince. After years of UN involvement in Haiti, all the data collected, such as road networks, health facilities, demographics and locations, were lost in the disaster and their curators tragically missing.
1.2 The Haiti emergency response
The Haiti earthquake in 2010 has been considered a turning point in disaster response because of the support provided by collaborative communities.
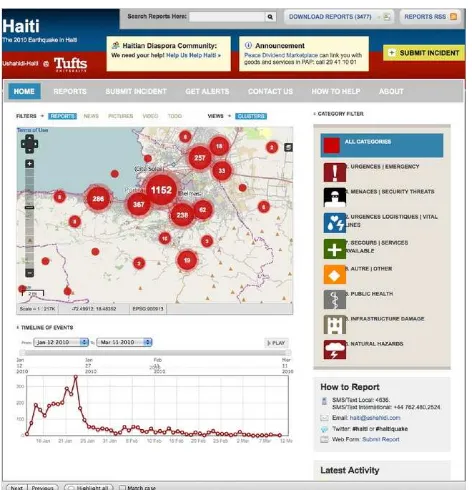
For the first time the affected population, thanks to the dissemination of mobile phones in the country, alerted the crisis responders where help was needed by typing basic text messages for free thanks to the Mission 4636 initiative (http://www.mission4636.org/). In the first month volunteers helped translate SMS written in Haitian Creole (Kreyòl), geo-located 2900 of them and transmitted the delivered messages to the Red-Cross guiding search-and-rescue teams. Information was also gathered through social media (blogs, Twitter and
Facebook), aggregated with text messages and shared using the
Ushahidi platform, an open source software first developed in Kenya to monitor local elections in 2007.
Moreover volunteer mappers helped to create what has been considered as the most comprehensive and up-to-date map available of Port-au-Prince and Haiti. This achievement was made possible by the collaboration between volunteers and data providers.
High-resolution imagery (with ground sample distance below 1m) has not traditionally been available at the field level early. For the response of the tsunami that heavily hit Banda Aceh in Indonesia in 2004, the collected imagery was made available to field staff three weeks after the event occurred (Crowley J. et al., 2010). Imagery can be critical for making operational decisions, especially in regards to logistics. But imagery also is time consuming to process and analyse, a task for which field staff can’t accomplish in little time.
Bank commissioned the Rochester Institute of Technology (RIT) and ImageCat to collect 15 cm aerial imagery of Port au Prince. Imagery from 21 to 29 January was then released into the public domain.
Figure 1. Ushahidi platform plotting Haitian reports on a map
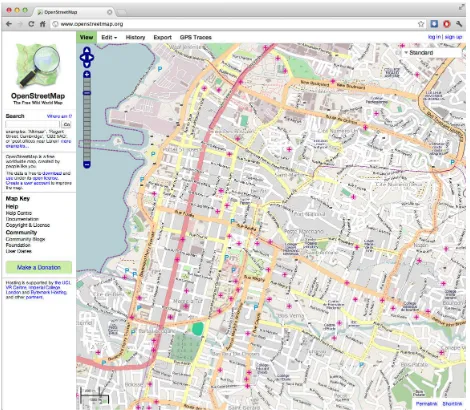
Figure 2. OSM Map of Port-au Prince before the quake
Figure 3. OSM Map of Port-au-Prince 24 hours later
1.3 Crowdsource mapping Haiti
In the first 24 hours after the quake, the OpenStreetMap site (http://www.openstreetmap.org/) logged more than 400 editing sessions in Haiti (Maron, 2010). Volunteers started to trace Yahoo imagery and gather information from old topographic maps. Before 12 January Port-au-Prince was a blank spot on the maps (Figure 2) and collecting geographic information was a priority (Figure 3).
The release of post-event high resolution imagery boosted the effort of the volunteers that started digitalizing roads, collapsed building, spontaneous camps and other features requested by relief groups (Figure 4).
OpenStreetMap became the de facto source of Haiti map data for many humanitarian agencies. This volunteer network was able to build a street map of Haiti from scratch in around two weeks, a project that otherwise would have taken almost a year (Figure 5).
Figure 4. OSM Map of Port-au-Prince one week later
1.4 Other Crowdsource mapping initiatives
The 2010 Haiti earthquake response highlighted the contribution provided by a community in response to a crisis. It was possible because of the level of access to mobile and online communication jointly with the collaboration between volunteer mappers (coordinated by the Crisis Mappers community), data providers (GeoEye/Google, Digital Globe) and large aid organizations (e.g. UN agencies).
Other emergencies than Haiti might not have the same magnitude, but be equally complex to manage. In recent years many crowd sourcing initiatives emerged to answer specific needs. In early 2011 during the Libyan revolution, IntaFeen.com provided a mobile check-in service like Foursquare in order to track volunteers heading into war zone to bring food and medical supplies. Their check-ins would also get posted on Twitter and Facebook, allowing families and friends in Egypt to track their whereabouts (Meier, 2011a).
Figure 5. OSM Map of Port-au-Prince as of 20 April 2012
2. SHARING INFORMATION
2.1 Setting the foundation
When a disaster occurs one of the priority is to establish a communication network. Humanitarian organizations know that effective coordination is based on how efficiently the information is shared. While in many places on the globe the internet connection is still an issue, many investments have being done in information and communication technologies (ICTs).
In Haiti the internet connection wasn’t a problem except in the very early days after the quake. Field staff was able to communicate with their headquarters and receive data coming from different sources. In the last few years the problem is leaning from sharing basic information (e.g. in paper maps, using radio equipment) to receive a huge amount of data and not being able to manage it.
That’s what happened in Haiti. Volunteer and technical communities like OpenStreetMap, Ushahidi, Sahana and Crisis Mappers created open platforms able to disseminate a continuous flow of data the emergency system was not prepared to receive due to the lack of adequate resources. Although a conservative and consolidated approach is widely adopted and recommended during a crisis response, the contribution from crowdsourcing will be more and more integrated into the system.
Crowd source mapping is a relative new field that has been evolving in the last two years of experience in Haiti, Libya, the Sudan, Somalia, Syria, the United States and the UK. Patrick Meier identifies the three core drivers of the crowd source mapping evolution as open-source mapping tools, mobile data technologies and the development of new methodologies (Meier, 2009). This is the innovative aspect: the tools are free and open-source and do not require much in the way of prior training. As the these elements rapidly evolve so does the crowd source mapping. It’s a complex phenomenon, rapidly adapting to different context and tools and how it could evolve in the next future and be integrated in the emergency system is beyond the scope of this article. What will be described are some patterns that can be identified in order to facilitate the dissemination of data before and during an emergency.
2.2 Interoperability
Collaborative systems rely on Spatial Data Infrastructures (SDI) that because of size, cost and number of interactions are expensive to develop and require skilled users. This is the reason why SDIs are often government (such as the US National Spatial Data Infrastructure) or big organizations related (such as the projects for a European SDI based on the INSPIRE initiative and the United Nations Spatial Data Infrastructure UNSDI). The traditional approach in implemeting a SDI seems not to be sustainable by smaller organizations, academia or individuals that could or wished to contribute with their own data or analysis. This is particularly emphasized during an emergency response. It’s not only a matter of cost but also of policies as barriers to participation, lack of incentives for contribution, high level of expertise required.
A different model of Spatial Data Infrastructure could be based on lessons learnt from the web communities and tools and features designed on Web 2.0 principles. Common patterns can be identified as following:
- make it extremely simple to share data; - provide user statistics;
- easily add comments, ratings, tags; - allow collaborative filtering;
- provide rankings of best ‘views’ and data sets contributed - such as highest rated, most viewed, most shared;
- allow connectivity between several instances to augment the collaborative potential of government GIS programs.
Nevertheless it must be pointed out that the basics for efficiently disseminate spatial data rely on proper organization of the data into repositories prepared in a suitable format for being shared. The most successful integration of tools and data between organizations, institutions or even individuals, happens when the most open standards are adopted. Many GIS officers and volunteer mappers use Open Geospatial Consortium standards like WMS (Web Mapping Service) and WFS (Web Feature Service). The OGC standards (http://www.opengeospatial.org/) are widely adopted both from Open Source and both from commercial platforms (such as ESRI products). These service interfaces are considered as the standard for interoperability between diverse sources, enabling overlay of rendered images and access to the raw data for further analysis and modelling.
2.3 Architecture frameworks
Figure 6. Google Map Maker
Both approaches use trusted users as moderators or reviewers in order to prevent vandalism and inaccuracies. The differences lay basically in the license offered (commercial use of data is forbidden in Google Map Maker) and access to data: Map Maker provides no programmatic access to data.
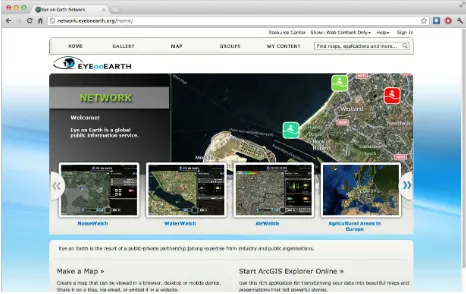
Another example is the Eye on Earth network (http://network.eyeonearth.org/), a joint collaboration of Microsoft, ESRI and the European Environment Agency (EEA). The platform is based on ESRI’s ArcGIS Online cloud services. The aim of the initiative is to provide a collaborative online service for hosting, sharing and discovering data on the environment and promoting the principles of public data access and citizen science.
Figure 7. Eye on Earth network
This architectural approach based on a hub platform because of its nature might typically be developed and hosted by a private corporation or non-profit organization. Having all users that interact with the same platform, interoperability between different systems is not an issue. Terms of use and data ownership are defined by the hosting platform itself.
A different approach to enable more efficient crowd sourcing of spatial data is based on a web application as a node of a network. In this case the data owners will continue to host their own repositories sharing it by each using the same or similar software. In this case, the core software supporting the node approach is likely to be open source to be widely accepted by different kind of users from smallest to largest organizations.
(http://geonetwork-opensource.org/). GeoNetwork is a decentralized metadata catalogue able to search geospatial data across multiple catalogues and combine distributed map services in the embedded map viewer. GeoNetwork is free and open source and supports different OGC standards such as CSW (Catalogue Service for the Web), WMS, WFS and WPS (Web Processing Service) and others.
In principles the same application could be used as a hub platform and as a node of a network. Some organizations can have a platform where they share their large amount of data but at the same time be able to interact with smaller nodes. On the other hand, some users could prefer to download the platform software and then set up the application having a complete control over it.
3. THE GEONODE APPLICATION
3.1 Introducing GeoNode
Both decision makers and staff in the field traditionally use hard copy maps as an important source of information. Maps are volatile, the situation represented on the map can become out of date very quickly. For instance, in Haiti the OSM map of Port-of-Prince grew up of information with a fast pace. IDP camps are a dynamic feature because a lot of people often changed place: new camps arose weeks after the quake while other changed of population reducing or increasing in an unpredictable manner.
In very recent years, humanitarian agencies, civil protection departments and other aid structures started expressing the need of having data beyond the maps, in order for them to be possible to reuse the data themselves to create new products, produce new analysis, changing the map layout, data styling, scale factor and bounding box.
Spatial and ArcSDE. GeoNetwork is a catalogue application to manage spatially referenced resources.
Figure 8. GeoNode Architecture
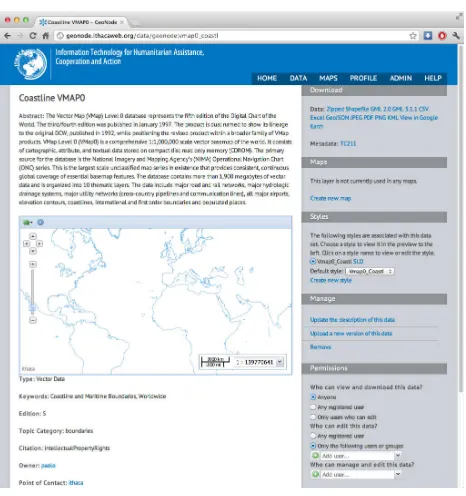
Figure 9. A dataset page in ITHACA GeoNode
GeoNode allows uploading vector and raster data using a user-friendly web form. After the uploading phase, the user is presented with a form to fill in the metadata using a Catalogue Services for the Web (CSW) interface. Metadata is automatically created and versioned. Data is published by GeoServer via WMS (Web Map Service), WFS (Web Feature Service) and WCS (Web Coverage Service) OGC standards. A map is a combination of layers. Users can start creating a map by uploading their own dataset and then select available layers as WMS provided also from different users and different sources. Otherwise can start from a map already created by another user and then adding, removing layers and changing scale and symbolization. Access permissions to datasets and maps are managed by a user friendly interface.
Figure 10. A map as a combination of layers
3.3 Further developments
There is a gap between desktop GIS and lightweight web applications the GeoNode community aims to fill. The direction is to lower the barriers to find and use geospatial information and at the same time make it easier to collaborate with organizations and volunteer mappers. The aim is to increase the quantity of high quality GIS data in the public sphere.
Several features are currently in deployment but not yet integrated in the main GeoNode repository. The Center for Geographic Analysis (http://gis.harvard.edu/icb/icb.do) at Harvard University has developed World Map a GeoNode based application with additional features. Some of them are going to be integrated in the core GeoNode. The CGA is currently developing the following functionalities: online digitalizing and layer editing, a modified layer tree to support folders/categories and drag/drop layers between categories, a history function to allow going back to previous version, the ability to search layers by keyword and highlight results, enhanced identify tool (displays results in side panel, with user-customizable attribute titles), allow users to add alias for field names and control sort order in identify results, added support for ArcGIS REST Service display.
Furthermore already available in Harvard World Map are the live connections to Picasa and YouTube feeds. In development is also a mobile client and the temporal data handling.
The OpenDRI has been funding the development of an improved user interface, printing function, map legend and a new core functionality that will enable a single GeoNode to act as a service by allowing it to be segmented into portals each with their own set of data layers, maps, users while still providing a global interface against all the data contained in the constituent portals. Each portal will have its own WMS, WFS, WCS and CSW endpoints allowing remote clients to retrieve data for an individual portal. Additionally, each portal will be able to have its look and feel (logo, colours, basic layout) modified by providing a custom CSS document which will be based on the global CSS document.
ITHACA is deploying a geonode-documents extension that enhances the concept of GeoNode map by allowing non georeferenced data attachments to it. In this perspective the Map becomes a kind of situation room where to find the most updated data related to a particular event. Documents are published also through the CSW catalogue and can be searched by keywords, by a spatial query and by their content thanks to a full text search (Peñate, 2012).
Conclusions
This paper describes how the crowd source mapping has become an important source of information during emergencies. This phenomenon is strictly related to the emerging of Web 2.0 technologies. Volunteers and affected population (the two aspects of the crowd), exchange information using ICT tools to be more effective in the crisis response phase.
The traditional crisis communication framework where information is only hierarchically shared between selected actors has no longer reason to exist. The emergency system should invest in information-sharing by adopting tools similar in principles to the ones used by the crowd source mappers. In this perspective, the GeoNode application has been presented.
References
Balbo S., 2012. A reference data access service in support of emergency management. Ph.D. Final Dissertation. Politecnico di Torino 2012
Carol R., 2010. Volunteer - driven Ushahidi Web platform contributes to relief efforts in Haiti.
http://www.tuftsdaily.com/volunteer-driven-ushahidi-web-
platform-contributes-to-relief-efforts-in-haiti-1.2155130#.T5ErHTIthOg (16 Feb 2010).
Castillo C., Mendoza M., Poblete B., 2010. Twitter Under Crisis: Can we trust what we RT?
http://research.yahoo.com/files/mendoza_poblete_castillo_2010 _twitter_terremoto.pdf
Crowley J., Johnson J., Schuyler E., 2010. Haiti CrisisMapping the Eartquake.
Harvard Humanitarian Initiative, 2011. Disaster Relief 2.0: The Future of Information Sharing in Humanitarian Emergencies. Washington, D.C. and Berkshire, UK: UN Foundation & Vodafone Foundation Technology Partnership, 2011.
Maron M., 2010. Haiti OpenStreetMap Response.
http://brainoff.com/weblog/2010/01/14/1518 (14 Jan 2010).
Meier P., 2012a. Crowdsourcing Humanitarian Convoys in Libya.
http://irevolution.net/2012/04/06/crowdsourcing-convoys-libya/ (16 Apr 2012)
Meier P., 2012b. Haiti and the Power of Crowdsourcing. http://blog.ushahidi.com/index.php/2012/01/12/haiti-and-the-power-of-crowdsourcing/ (12 Jan 2012)
Meier P., 2012c. Twitcident: Filtering Tweets in Real-Time for Crisis Response. http://irevolution.net/2012/04/15/twitcident/ (15 Apr 2012)
Peñate R., 2012. GeoNode Roadmapping Summit and Sprint, February 2012. http://geonode.org/2012/02/sprint/
(13 Feb 2012)
Rosenberg T., 2011. Crowdsourcing a Better World.
http://opinionator.blogs.nytimes.com/2011/03/28/crowdsourcin g-a-better-world/ (28 Mar 2011)
WikiProject Haiti, 2012. OpenStreetMap Haiti Portal. http://wiki.openstreetmap.org/wiki/WikiProject_Haiti#2010_Ea rthquake_Response (12 Apr 2012)
Ziemke J., 2011. Crisis Mapping: The Construction of an Interdisciplinary New Field. In: Journal of Map and Geography Libraries. Draft.
Acknowledgements