IMPLEMENTATION OF OPEN-SOURCE WEB MAPPING TECHNOLOGIES TO
SUPPORT MONITORING OF GOVERNMENTAL SCHEMES
Bhaskar Reddy Pulsani a
a Telangana State Remote Sensing Applications Centre, 8th Floor, B Block, Swarnajayanti Complex, Ameerpet-38, India
Commission VI, WG VI/4
KEY WORDS: Web GIS, Open Source, SharpMap, C#, ASP.NET, Government Schemes and Programs
ABSTRACT:
Several schemes are undertaken by the government to uplift social and economic condition of people. The monitoring of these schemes is done through information technology where involvement of Geographic Information System (GIS) is lacking. To demonstrate the benefits of thematic mapping as a tool for assisting the officials in making decisions, a web mapping application for three government programs such as Mother and Child Tracking system (MCTS), Telangana State Housing Corporation Limited (TSHCL) and Ground Water Quality Mapping (GWQM) has been built. Indeed the three applications depicted the distribution of various parameters thematically and helped in identifying the areas with higher and weaker distributions. Based on the three applications, the study tends to find similarities of many government schemes reflecting the nature of thematic mapping and hence deduces to implement this kind of approach for other schemes as well. These applications have been developed using SharpMap Csharp library which is a free and open source mapping library for developing geospatial applications. The study highlights upon the cost benefits of SharpMap and brings out the advantage of this library over proprietary vendors and further discusses its advantages over other open source libraries as well.
1. Introduction
Government undertakes various schemes for social and economic welfare of the people. These schemes are implemented by various ministries of the government some of which are funded by the central government and some by the state. Earlier, monitoring the privileges and benefits received by the beneficiaries for any government was not well established, but in the recent past, due to the technological advancements in information and communication technologies, many government departments have started to develop and maintain information systems for tracking the delivery of benefits. The information received by them is maintained as records in the database and many of the government departments lack the facilities or personal with expertise in presenting this information in the most creative and informative way. In a drive to help the organization to better understand and present data in the most informative way, Telangana State Remote Sensing Applications Centre (TRAC) has taken the responsibility of collecting data from several departments for building a web mapping interface which would thematically display data in the most dynamic way. There are several mapping libraries that exists to implement thematic mapping functionality through web but the present study concentrates its efforts to build a web interface using open source software SharpMap. The results and discussion section highlights upon the uses of this technology over licensed software such as ArcGIS technologies and also brings about the reasons of choosing this SharpMap over other open source software's.
2. Web based thematic implementation of government schemes using SharpMap
Thematic map is a type of map which shows distribution of a particular theme or subject area. The mapping concept is well know and common in GIS field. Desktop based thematic
implementation involves producing maps with image outputs. The outputted images are difficult to disseminate and are not dynamic in nature [10]. Change in the data requires repetition of this work and therefore calls for a dynamic implementation through web based system.
Choropleth is one among different types of thematic maps used for representing numeric value as color representation on a map. This kind of mapping is quantitative in nature and involves the mapping of percentages and rations in the current context. The other form of chloropleth representation is through qualitative mapping which involves depicting particular features on a map [11]. A further literature about the kinds of thematic maps can be found in the book published by Edward Hickin. To produce chloropleth maps, data on a particular theme is required. Everywhere around the world, governments undertakes welfare schemes to uplift the social conditions of the people. The implementations could be in various fields such social, health, political, cultural, economic, agricultural, or any other aspects. When the nature of individual schemes implemented by the government are analysed, they are based on a single idea, which in a way seem to reflect the implementation area of thematic mapping. Therefore, the government schemes form an ideal area where the implementation of thematic mapping could be carried out. Three thematic web mapping applications have been built for three government schemes to track and visually interpret information. Following are three programs for which the implementation of building a web mapping interface was taken up.
1. Mother and Child Tracking system(MCTS),
2. Telangana State Housing Corporation Limited (TSHCL)
3. Ground Water Quality Mapping (GWQM)
Table 1 displays set of parameters for each of the programmes mentioned above. Thematic maps for all these variables have been implemented. Let's see each of these in detail.
Table 1 : Attributes for which thematic maps are created
MCTS TSHCL GWQM
Antenatal Care Delivery Outcomes Postnatal Care Tracking of Children
Not Started House Completed In Progress Female Registered Schedule Tribe Registered Schedule Caste Registered Female Completed Schedule Tribe Completed Schedule Caste Completed Below basement Basement Roof
Total Average Ph
Total Dissolved Solids
Total Hardness Total Alkalinity Chloride Fluoride
2.1 Mother and Child Tracking System (MCTS):
This is a program for not only tracking pregnant women but also offers post natal support for children after delivery. The
program is aimed at improving maternity health of mothers and to reduce child mortality. To identify the distribution of various parameters mentioned in Table 1 of the first column for MCTS, a thematic representation of these parameters as a map could be seen in Figure 1. A legend defined using red colour rectangular box shows five categories under which the parameters have been classified with regards to percentage. These five categories have been further assigned a colour schema. The respective colours are used to identify the distribution of various parameters in the map area. When the parameters in the drop down of Select Category field changes, the thematic representation of the map also changes. District level representation of parameters as thematic maps has been show for MCTS. A dynamic statistics for districts could be seen toward the right for Rangareddy district. The kind of visual representation as a thematic map immediately helps to identify areas with low distribution of services like shown with blue colour circles in Figure 1.
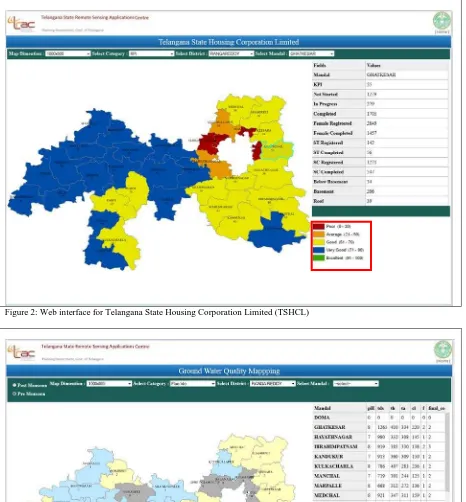
2.2 Telangana State Housing Corporation Limited (TSHCL):
The project aims at providing permanent houses to the weaker sections, underprivileged and to those who have lost their homes due to calamities. The housing is provided under various schemes implemented by the government. To track the distribution of services received at district/mandal level, the parameters in Table 1 of the second column for TSHCL
Figure 1: Web interface for Mother and Child Tracking System (MCTS)
This contribution has been peer-reviewed. The double-blind peer-review was conducted on the basis of the full paper.
under which the housing schemes are being implemented have been tracked. Parameters such as stage wise (Below Basement Level, Basement Level, Lintel Level, Roof level, Roof Caste and Completion) and physical wise progress for SC/ST housing (Registered, Completed, In Progress, Not Started) have been categorised to five categories like shown
in Figure 2 delineated with red colour rectangular box. Similar to MCTS, when the Select Category or parameters in the drop down changes, the thematic representation of the map also changes with distribution from poor to excellent (red colour rectangular box).
Like shown in Figure 2 Serilingampally, Balanagar, Alkajgiri and Uppal mandal areas of RangaReddy district is where the distribution of service is poor.
Ground Water Quality Mapping (GWQM):
Ground water is a natural and an essential resource for drinking in areas where there is no availability of surface water. This could be made available through open well or bore well or tube well. Not all groundwater is drinkable. The edible nature of water depends upon elements listed in Table 1 of the third column for GWQM, and it is always a good idea to check the quality of ground water when it is used for consumption. This program discusses on publishing ground water quality maps for the elements mentioned in GWQM section of Table 1. These elements are used to thematically display the quality of water dynamically. The elements have been classified into three categories for all the parameters. The legend section of Figure 3 delineated with red colour rectangular box shows the colour schema for the categories. The thematic representation shows the quality of ground water at district/mandal/village level. Areas where water is not portable are show in blue colour circles
Methodology
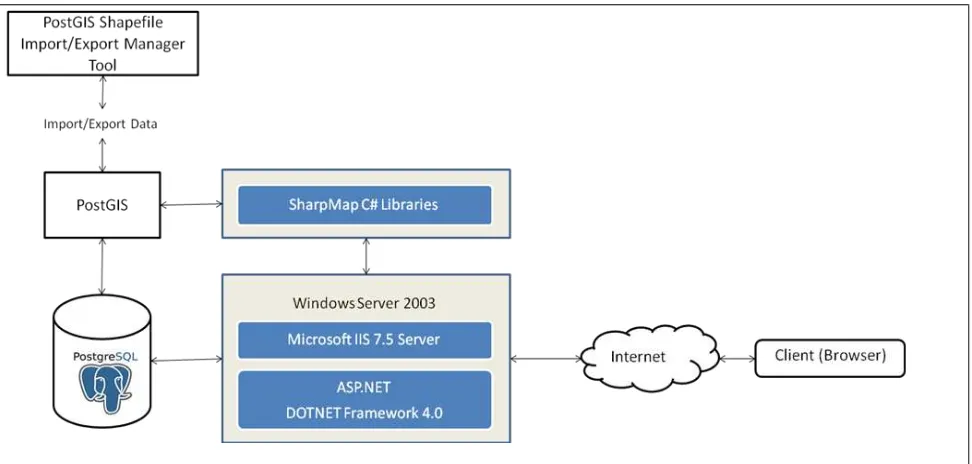
The architecture displayed in Figure 4 consists of three components. They are User layer, SharpMap layer and the Database layer. The system has been developed using ASP.NET and DotNet framework 4.0, and using open source technologies such as SharpMap and PostGIS [24] for PostgreSQL. In the mentioned software's, Windows Server 2008 is the operating system, Internet Information Services (IIS ) is the web server come application server, PostGIS is a spatial extension to the open source PostgreSQL database, C# is the server side language which is used in conjunction with ASP.Net for rendering web pages and SharpMap is an open source mapping library built using C# for rendering maps which again works in conjunction with ASP.NET.
2.3 User layer
This is the client interface of the application where the user performs the activity. All the three snapshot provided in Figure 1, Figure 2 and Figure 3 form the presentation layer. These interfaces have been programmed using ASP.Net components. The three application have been programmed to have the following major functionalities
1. Administrative level query for
district/mandal/village.
2. Thematic map showing the distribution of the parameters
3. Grid view showing the attributes as statistics based on district/mandal/village query.
4. Legend to help recognize the categories with respect to the parameters of the data.
5. Provision to change map dimensions
The thematic map for the three applications rendered using SharpMap (as a bitmap) was streamed as an image to the browser interface. The statistics were displayed using the GridView control of ASP.NET and the legend was manually prepared using computer graphics program called paintbrush for windows. The GridView control is one out of many controls provided by microsoft to display data. The control supports capabilities such as paging, sorting, creating, inserting, editing or deleting data and provides some easy set of objects to perform these tasks. For the current study ASP.NET controls reduced the amount of time needed to develop the application which in a way is also the purpose of microsoft for providing this web framework.
2.4 SharpMap Layer
SharpMap is an open source geospatial C# (csharp) library which can be used for developing mapping application on both desktop and web. The current release of sharpmap stands at version 2.0 and based on the .Net 4.0 framework. It compiles to a Dynamic link library (DLL) [15], which can be used to share across both desktop and web platforms. The
Figure 4 : Architecture of SharpMap application
This contribution has been peer-reviewed. The double-blind peer-review was conducted on the basis of the full paper.
library has provision to access data with various extensions for vector and raster. SharpMap C# libraries work in conjunction with ASP.Net in producing web mapping applications not only for thematic purpose but also for catering to the needs of different application that require producing maps with various other types such as political map, topographic map, etc.
In Figure 4 the SharpMap layer lies on IIS and shares the server side processing with ASP.NET. The SharpMap library renders a bitmap by processing the vector data on PostGIS. This is then streamed to the user interface as an image. To render the maps, SharpMap uses the Application Programming Interface (API) of the Graphics Device Interface (GDI) which is a core component of Microsoft for representing graphic objects. All the great styling feature like the brushes and pens can be used to render maps that display symbology for various purposes. All this processing is done at the server side complemented by visual studio which provides an Integrated Development Environment (IDE) for developing applications on desktop and web platforms. Therefore, like many other mapping libraries and Web Map Services (WMS) [22] servers, SharpMap has support for generating thematic maps with different styling options and can be used to query maps dynamically from many database providers and file systems.
2.5 Database layer
SharpMap has provision to connect to the open source spatial database PostGIS. Apart from having provision to connect to this database, it has support for various other databases such as MSSQL Server, Oracle and SpatialLite. Though SharpMap has support for reading ESRI Shapefile format (the most common file sharing format), PostGIS has been used as the source of reading the vector data. This is because accessing a file format is always slower when compared to accessing data through the database. Since the application has requirement for displaying statistics based on the attributes of the provided data, migrating the data to the database gives all the benefits of managing large sets of data, indexing, searching, sorting and querying. The left side component of Figure 4 shows the architectural part of the database implementation. Shapefile Import/Export tool of PostGIS loads the spatial data of the tanks into the desired database. SharpMap which has provision to connect to PostGIS queries the data and produces the desired thematic maps. These are then passed onto the user layer
3. Results and Discussions
Section 2 discusses about the thematic implementations of SharpMap on three different programs - MCTS, TSHCL and GWQM. All the maps generated for the three programs show distribution of parameters for various attributes thematically from below expectation to very good for MCTS (Figure 1), poor to excellent for TSHCL (Figure 2) and from non-potable to desirable for GWQM (Figure 3). We have seen that all the three programs share a common topic of showing maps thematically and displaying the attribute data statistically. Representation of maps this way helps to identify areas where the distribution is abnormal and assists the decision makers to concentrate more on these areas. Further steps could be implemented to mitigate and improve upon these areas. Earlier in section 2 we have discussed about the nature of government schemes and programs which
reflect the implementation area of thematic mapping. In the current study, an application was first developed for MCTS using SharpMap and then the code written for this application was adjusted, reprogrammed and extended with further functionality for implementing the other two programs TSHCL and GWQM. Similarly, the code could be extended not only to the three programs that have been implemented in the present context but also to many schemes and programs in the government sector where many share a common theme of showing maps thematically. Therefore, the code implementations and features of the three programs can be adopted by other programs of various departments in the government.
which application could be developed using SharpMap was put forward by Shengmao et. al. [2] for developing an application for fisheries. Another application showing similar benifits of SharpMap was developed for pipeline data management by Arie et al. [17]. The three applications developed for the present study, in similar terms, highlights upon the cost benefits of using the open source library SharpMap. Though SharpMap might not compete with proprietary software provider like ArcGIS or even for that matters with open source technologies such as OpenLayers, GeoServer or MapServer, it does provide functionality that is in par with the requirements of many of the programs and schemes undertaken by the government. A few demonstrations of these have been show in the current study with implementation in MCTS, TSHCL and GWQM.
There are several open source alternatives for implementing web interfaces like the ones developed in the current study. OpenLayers is one such JavaScript framework which is open source and which is widely used library for displaying interactive maps. It utilizes the mapping services published using GeoServer or MapServer. SharpMap, in a similar way, can be used for publishing WMS services which can be utilized by OpenLayers. The current study requires generation of thematic maps with respect to change in the attributes of the data selected through the dropdown of the web interface. This kind of functionality does not require any JavaScript based interactivity which in a way eliminates the use of JavaScript frameworks such as OpenLayers. SharpMap is well established for development using ASP.NET and the components provided by this framework would suffice to achieve the given task. If OpenLayers were to be used for development, then it would require installation of GeoServer for mapping service. A Styled Layer Descriptor (SLD) [8] file is needed to establish the colour schema which in turn should be loaded into the GeoServer Admin interface while publishing the layer. A software such as User-friendly Desktop Internet GIS (UDIG) [9] is further needed to create the SLD file. Since OpenLayers is client based, it requires the assistance of a server side programming language such as PHP [19], .NET or Java [20] for connecting to database to display statistics dynamically. Considering the involvement of so many software, implementation of chloropleth maps using WMS services was relatively difficult if OpenLayers and its related technologies are used. GeoJSON on the other hand provides the means for implementing chloropleth maps using OpenLayers. The library has good support for GeoJSON format and can be used for rendering chloropleth maps at client side with different colour representations. A single layer representation this way works well but if multiple layers have to be queried based on administrative levels and its sublevels, then it requires whole of the data to be loaded onto the client side i.e. district, mandal and village boundaries data should be loaded on the browser as GeoJSON. This type of approach is not ideal because the browsers have not much capability to handle large amounts of data, and if loaded, could lead to browser crash. Dynamic symbology for thematic maps was implemented with combination of WMS and SLD files by Burdziej [12] for developing a web based decision support system. He made use of open source technologies such as OpenLayer, JavaScript (GeoExt [13], ExtJS [14]), SLD, PHP and GeoServer for development. In the current context, the development of the three project would involve the use of technologies used by Burdziej (excluding PHP) and also requires additional technologies such as .NET and UDIG.
Due to the involvement of so many technologies, development of the three projects using these technologies was quite complicated.
UMN MapServer could also be used as an alternative for GeoServer for developing thematic based applications. It provides rendering of maps through a MapFile. This file acts as a configuration file where the destination to geographic data and parameters for color representations could be set. There are two ways in which MapServer provides rendering of maps. One is through Common Gateway Interface (CGI) [6] controls and the other is through MapScript. Dynamic rendering of thematic map using CGI controls was not possible. This possibility was provided by MapServer's MapScript through various programming languages such as PHP and Python [18]. Although considerable amount of MapScript documentation is available for these programming languages, the availability of documentation for .NET components of MapServer is lacking. Since .NET was the chosen language for server side processing, MapServer was not considered as an option for development.
SharpMap on the other hand provided all of the functionalities without having to depend on any other software technology except for C# with ASP.NET components. The development does not depend on any configuration file such as a MapFile for MapServer or any style based file such as SLD for GeoServer. The symbology is written on the server side using C# programming language and does not need any installation of map server. SharpMap's Dynamic Link Library (DLL) provides all the objects needed for generating the final map along with colour schema. SharpMap provides an easy medium of handling many functionalities using just this library. Aditionally, the familiarity with .NET technologis and C# programming language also formed one of the criteria for selecting SharpMap for the current study.
The current applications can be extended to have little more functionality like displaying the attribute of a polygon on mouse click event or a similar functionality in these terms. The three applications in the current study make use of simple ASP.NET components which are HTML and CSS based. These components are not based on JavaScript and hence offer little flexibility when it come to asynchronous based interactivity. An action performed at the client requires the whole page to be sent to the server for processing i.e. the browser needs to be reloaded for any client side action. The interactivity without having to reload the browser through JavaScript is more a user related experience that a projects requirement. SharpMap does offer AJAX [23] based components to tackle browser reload but these are basically developed to improve navigation facilities and map display. A limitation of SharpMap is the lack of Web Feature Service (WFS) [21] capabilities which offer geometry editing facilities. Furthermore, SharpMap's WMS implementation through AJAX is limited and needs improvement. OpenLayers in this regard is superior, however, based on the requirements of the current study and the inference that could be drawn regarding government schemes reflecting the nature of thematic implementation, SharpMap has shown to provide all the capabilities that are required by the projects. The projects implemented here and many government schemes that resemble them are statistical or quantitative in nature and hardly require any further enchantments away from the ones demonstrated in the current study.
This contribution has been peer-reviewed. The double-blind peer-review was conducted on the basis of the full paper.
The advantages of SharpMap lies on its ability to create application on both desktop and web. Like discussed in section 3.2 it has provision to read many vector and raster formats and connects to various databases. Although being an open source library and having capabilities to develop web based applications like demonstrated in this study, the utilization of this library seems to have been overlooked. Instance where SharpMap was used for developing application are few. An attempt was made to implement a weather forecasting system to monitor convective weather such as thunderstorm and hail, made use of SharpMap libraries [16]. Hardly few journal, in fact what the author could find was just the three journal mentioned here in the current study goes to show that a geospatial library with such good capabilities, has been underutilized. The referenced journals demonstrate the implementation of SharpMap on various fields and show the advantages in terms of cost effective nature of this library. Based on the implementation of the current study for MCTS, TSHCL and GWQM, it could be inferred that government schemes indeed reflect an area where thematic maps could be applied, to easily distinguish the spatial variations and to visually identify areas with weaker distributions. The realization of government schemes being close to the implementation of thematic mapping was not realised until gradual implementation of these three projects one after the other. The current study with implementation of chloropleth mapping has indeed provided examples as proof to assert this inference. This kind of chloropleth representation is one among many tools that could significantly enhance the decision making capabilities of a person. SharpMap in this regard is surely a library that can be used to develop applications with implementation not only in thematic mapping but also in various fields. The current study with three implementations of thematic mapping should encourage others to start exploring the library. Furthermore, ASP.NET complemented by SharpMap should provides all the functionality for developing applications similar to the ones implemented in the current study.
4. Conclusions
The study has taken three implementations of government schemes such as MCTS, TSHCL and GWQM to demonstrate the web capabilities of SharpMap. The developed web application using this library has assisted the officials in visualizing the distribution of different parameters of the respective programs. It has helped the official as one of the aiding tools in decision making and the maps produced has further assisted them in concentrating more on areas where the distribution was weaker. Further the research has provided that the nature of many government programs are very much like the ones implemented in this study and hence, encourages organizations not only at government level but also at private level to use SharpMap as one of the tools that would aid in decision making process. The study also highlighted upon the free and open source nature of SharpMap and the cost benefits that it brings.
Acknowledgements
The research in this study has been carried out by Telangana State Remote Sensing Applications centre (TRAC) in cooperation with the concerned departments. In this regard, I sincerely thank Director General Sri B.P. Acharya, Director
Admin Sri Rufus Dattam and Director Technical Sri D.V.J Sastry for giving me the opportunity to work on these projects.
References
[1] Simhachalam Alajangi, Satyanarayana Prasad Nerella, Moons, 10/2014, Web Enabled Multi-Layer Geo-Database for Moinabad Mandal in Rangareddy District, Telangana, Scientific Research
[2] Shengmao Zhang, Weifeng Zhou, 06/2011, Application of SharpMap open source mapping library in fisheries, International Conference on Geoinformatics, Shanghai`, China, IEEE.
[3] Zhu, Z. , Bi J, Wang X and Zhu W, 2014, The research and implementation of coalfield spontaneous combustion of carbon emission WebGIS based on Silverlight and ArcGIS server, EES, IOP Science. [4] SharpMap, URL: http://sharpmap.codeplex.com/ [5] OpenLayers, Available on : http://openlayers.org/ [6] MapServer, Available on : http://mapserver.org/ [7] GeoServer, Available on : http://geoserver.org/
[8] SLD, OGC Specifications, Available on : http://www.opengeospatial.org/standards/sld
[9] UDIG, Available on : http://udig.refractions.net/ [10]Xingguo Zeng, Qingyun Du, Fu Ren, Fei Zhao,
06/2013, Design and implementation of a web interactive thematic cartography method based on a web service chain, Boletim De Ciências Geodésicas, Url : http://www.scielo.br/pdf/bcg/v19n2/a02v19n2.pdf [11]Edward Hickin, J., 1991,1997, & 2014, Third Edition,
Maps and Mapping - A cartographic manual, Url : http://www.sfu.ca/~hickin/Maps/Chapter%209.pdf [12]Burdziej, J., 2012, A Web-based spatial decision
support system for accessibility analysis — concepts and methods, Appl Geomat, Springer
[13]GeoExt, Available on : http://geoext.org/ [14]Ext JS, Available on :
https://www.sencha.com/products/extjs/ [15]Microsoft Support : Url :
https://support.microsoft.com/en-us/kb/815065
[16]Li , X., Wang S. G., Shang K. Z., Li S. C., Zhang L. H., Zhou H., Cheng Y. F., Jun. 2011, "Designment and Implementation of Short-Range and Nowcasting Weather Forecast Operational System Based on Sharpmap", Applied Mechanics and Materials, Vols. 58-60
[17]Arie Wisianto, Hidayatus Saniya and Oki Gumilar, October /2010, Integrating Pipeline Data Management Application and Google Maps Dataset on Web Based GIS Application Using Open Source Technology Sharp Map and Open Layers, 8th International Pipeline Conference, ASME
[18]Python, Available on : https://www.python.org/ [19]PHP, Available on :