POLLEN BEARING HONEY BEE DETECTION IN HIVE ENTRANCE VIDEO
RECORDED BY REMOTE EMBEDDED SYSTEM FOR POLLINATION MONITORING
Z. Babic a, *, R. Pilipovic a, V. Risojevic a, G. Mirjanic b
a Faculty of Electrical Engineering, University of Banja Luka, Banja Luka, Bosnia and Herzegovina - (zdenka, ratko.pilipovic, vlado)@etfbl.net
b Faculty of Agriculture, University of Banja Luka, Banja Luka, Bosnia and Herzegovina - [email protected]
Commission VII, WG VII/4
KEY WORDS: Honey Bee, Pollen, Video, Moving Object Segmentation, Classification, Detection, Remote Monitoring, Embedded System
ABSTRACT:
Honey bees have crucial role in pollination across the world. This paper presents a simple, non-invasive, system for pollen bearing honey bee detection in surveillance video obtained at the entrance of a hive. The proposed system can be used as a part of a more complex system for tracking and counting of honey bees with remote pollination monitoring as a final goal. The proposed method is executed in real time on embedded systems co-located with a hive. Background subtraction, color segmentation and morphology methods are used for segmentation of honey bees. Classification in two classes, pollen bearing honey bees and honey bees that do not have pollen load, is performed using nearest mean classifier, with a simple descriptor consisting of color variance and eccentricity features. On in-house data set we achieved correct classification rate of 88.7% with 50 training images per class. We show that the obtained classification results are not far behind from the results of state-of-the-art image classification methods. That favors the proposed method, particularly having in mind that real time video transmission to remote high performance computing workstation is still an issue, and transfer of obtained parameters of pollination process is much easier.
* Corresponding author
1. INTRODUCTION
As much as we are interested in beekeeping for honey production, we should also take care of bees as pollinators. Honey bees are probably the most important pollinators across the world and their crucial role in pollination ensures ecosystem stability (Potts, 2010). Much effort is invested in understanding honey bees behavior. Number of honey bees entering and leaving the , as well as their movement have been investigated for a long time, but mostly through manual data collection and randomly through time (Abou-Shaara, 2014) and (Delaplane, 2013). In (Delaplane, 2013), standard methods for estimation of strength of honey bee colonies are described. Computer assisted analysis can be used for monitoring weight and weather conditions through sensor networks, and surface area of comb in opened hive occupied by bees or brood, or pollen, can be estimated by image processing methods. But, in order to gain a measure of colony foraging effort without hive opening, bee flight activity is still monitored visually by human observers (Delaplane, 2013).
The automatic tracking and counting of honey bees could give more insight into the colony status, their behavior and their role as pollinators. The number of pollen bearing honey bees entering the hive and the way how they move at the hive entrance are very important indicators for beekeepers. These indicators are related to the health status of a bee hive, and the strength of the bee colony. Moreover, their pollen collecting activities correlate to the environment in which they live, both outdoors and in a greenhouse. Therefore, finding quantitative measures for pollen bearing honey bees activities can be
beneficial not only for beekeepers but also for agriculture, ecology and biology (Zacepins, 2015).
Our work specifically addresses the behavior of pollen bearing honey bees. We are focused on detection of pollen bearing honey bees in video recorded at the hive entrance. Pollen bearing honey bees detection is a step towards their counting and measuring the amount of pollen that they collect. Our intention is to find as simple as possible real time algorithm, which is to be implemented on an embedded system with limited hardware resources.
Several approaches to honey bee behavior analysis can be found in the literature, from mechanical solutions to visual, infrared, and RFID (Reynolds, 2002) and (Streit, 2003). The disadvantage of these solutions lies in the fact that they disturb the natural behavior of honey bees. More recently, a non-invasive video based honey bee counters have been introduced. In (Campbell, 2008), video monitoring system at a hive entrance that classifies bee motion in the four motion classes: loitering, crawling, flying out and flying in, is proposed. Although some systems that utilize infrared sensors for monitoring honeybee traffic already exist, there are some efforts, like in (Kale, 2015), to count and track honey bees based on visual information. Difficulties for detection and tracking of honey bees in 3D under uncontrolled conditions are highlighted in (Chiron, 2013). In the same paper, the authors proposed some solutions using a stereo vision-based system aiming to detect and analyze honey bee behaviors based on their trajectories. Although some progress is evident, the results
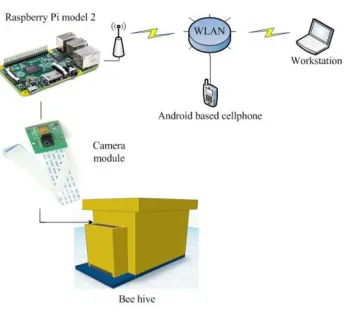
Figure 1. Monitoring system
obtained by visual methods still suffer from many disadvantages. There is no doubt that this research requires significant improvement, but because of its non-invasive nature it is broadly applicable to honey bee behavior analysis.
To the best of our knowledge, the non-invasive computer based system for estimation of the number of pollen bearing honey bees entering the hive does not exist. In this paper we propose a visual based system and give the results of detection of pollen bearing honey bees. Because hives are usually dislocated from the high performance computing devices, and high-definition (HD) video transmission is still an issue, our system is based on a microcomputer co-located with a hive. Honey bees are detected in a video recorded at a hive entrance and the pollen bearing honey bees are recognized. We concentrate our research on pollen detection, as a pre-processing step for pollen bearing honey bee tracking and counting, with pollination monitoring as a final goal. We designed the algorithm to be as simple as possible in order to be implemented on embedded systems. On in-house data set we achieved a correct classification rate of the 88.7% with 50 training images per class.
The rest of the paper is organized as follows. The hardware of the proposed video monitoring system is described in Section II. In Section III, the algorithm for pollen bearing honey bee detection is explained in details. The detection and classification results are presented and discussed in Section IV. Section V contains conclusions and future research directions.
2. MONITORING HARDWARE
Our intention is to create a low cost video monitoring system that can be easily mounted on a standard hive construction. The monitoring hardware consists of a sensing platform, computational hardware and a communication module, as it is shown in Figure 1. The sensing platform consists of a specially designed wooden box (sensing box) with a Raspberry Pi camera module inside, mounted on the front side of a standard hive, above the hive entrance. As computational hardware, we used a Raspberry Pi model 2 board, which is also mounted on the sensing box. The task of the communication module is to establish a WLAN connection between the Raspberry Pi board and a remote workstation. For this purpose we used an Android-based cell phone.
2.1 Video Acquisition
Our goal is development of a system for analysis of honey bee behavior in hive surveillance videos. Since bee hives are placed outdoors, it is not possible to control environmental conditions that can affect the quality of the video. Therefore, the sensing platform and analysis algorithm have to take into account several constraints.
The first requirement is that the sensing platform should not interfere with the normal colony activity. Furthermore, honey bees are small, fast moving targets. Adult bee measures in average 12x6 mm. Maximum flight speed of a honey bee without load is about 45 km per hour. Laden with pollen, a bee reduces flight speed to 18-36 km per hour. Assuming that honey bee speed on the board while walking does not exceed 5 km per hour, it cannot cross the distance greater than 4.6 cm between two frames captured at 30 frames per second (FPS).
Lighting conditions, which vary significantly during observation, as well as shadows make the analysis difficult and significantly corrupt the results. Artificial lighting is not acceptable because of power consumption constraints. Moreover, artificial lighting can affect normal honey bee behavior. In order to reduce the impact of lighting and shadows to video analysis, a special purpose sensing box is constructed.
We placed a camera capable of producing RGB signals on the top of the sensing box, 20 cm long and 11 cm wide, mounted 17.5 cm above the hive entrance. The sensing box is closed on all sides except for the 2 cm high opening at the bottom of the front side, which is intended for honey bees to enter and leave the hive. The light that penetrates through this opening is sufficient for the camera operations during the day when bees normally enter and leave the hive. In this way the shadows that arise due to the changing environment are reduced. On the bottom side of the box, 2 cm above the flight board, there is a glass plate, and the bees which are entering or leaving the hive are forced to walk a distance of approximately 11 cm. Therefore, the bees in the field of view of the camera cannot fly. In this way, the shadows of flying honey bees, which can significantly corrupt the results of honey bee detection, are almost completely avoided. In order to further facilitate moving object segmentation from the still background we painted the flight board blue. A downward-facing camera, focused on the flight board close to the hive entrance, is used in order to minimize the scale and perspective differences that would be caused by larger distances.
We mounted the HD Raspberry Pi camera with the horizontal field of view of 53.50 +/- 0.13 degrees and the maximum resolution of 1920x1080 pixels on top of the described sensing box. The camera field of view is approximately 17.1x9.6 cm.
We use 1280x720 camera resolution at which a single bee occupies approximately 2500 pixels. An example of a captured frame is shown in Figure 2. Because of non-uniform illumination near the opening where light penetrates the sensing box we use only the lower half of field of view close to the standard hive entrance with dimensions of 17.1x4.8 cm. Additional illumination noticeable in Figure 2 on the left side comes from the connector holes.
Figure 2. Honey bees in the camera field of view (best viewed in color)
Under this setup, taking into account assumed walking speed of honey bees, at 30 FPS each honey bee is captured at least in one frame. We observed mostly slower honey bees at the entrance, so we can visually track an incoming honey bee in 5-7 frames in average. High speed wings flapping, that occurs during the honey bees walking results in slightly blurred video, but it does not affect pollen detection. If necessary, with the chosen camera resolution we can double frame rate to 60 FPS for honey bee tracking and counting.
2.2 Computing and Communication
The monitoring system attached to a hive also performs real time analysis of the recorded video. The main task of this analysis is classification of the honey bees at the hive entrance into two classes: the pollen bearing honey bees and honey bees without pollen load. The Raspberry Pi model 2 board is used as the computational hardware for real time video analysis. An Android based cell phone establishes WLAN connection for file transfer between the Raspberry Pi microcomputer and a workstation with Intel i3 processor and 8 GB of RAM. The recorded video is also transferred to the remote workstation, in order to compare the results of the real time analysis to much more sophisticated algorithms that we implemented on the high performance workstation.
3. POLLEN BEARING HONEY BEE DETECTION Standard methods for estimation of the number of honey bees assume that two observers count and record the number of honey bees in a 15 minutes counting episode (Delaplane, 2013). Focusing on and counting the pollen bearing honey bees is a difficult task for a human observer, particularly because the returning honey bees use the shortest path to a place where they deposit their pollen load, and sometimes land directly into the entrance.
Based on standard beekeeping methods, real time application of video-based counting of pollen-bearing honey bees consists of a video acquisition episode, followed by extracting pollen-bearing honey bees in each recorded frame. Depending on the demands and complexity of the analysis, video acquisition can vary in duration and be repeated regularly or when appropriate.
The block diagram of our method for pollen bearing honey bees detection in a single frame is shown in Figure 3. Two main steps are moving object segmentation and honey bees classification.
Figure 3. Block diagram of pollen bearing honey bee detection
3.1 Moving Object Segmentation
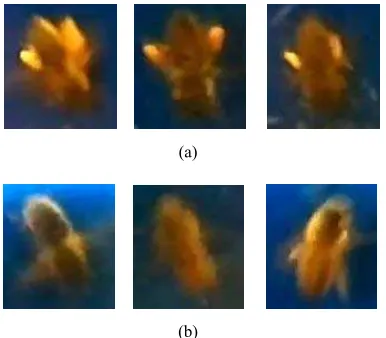
A few examples of pollen bearing honey bees and honey bees without pollen load, captured with the described acquisition system, are shown in Figure 4. Honey bees are small and fast targets. Their motion appears to be chaotic. The scene in front of a hive is often cluttered with honey bees grouping, occluding and/or overlapping each other. We concentrate on moving objects segmentation aware of the fact that the detected moving object can sometimes contain more than one honey bee. From the pollen assessment standpoint, it is desirable to at least obtain the information whether the group of honey bees has a pollen load or not, in the cases when it is not possible to segment individual honey bees.
After video acquisition, background subtraction based on MOG (Mixture of Gaussians) algorithm (Stauffer, 1999) is used to extract the moving honey bees from the video recorded at the hive entrance. The MOG algorithm has been chosen among plenty of background subtraction algorithms because of its simplicity, as well as ability to adapt to changes in lighting, to deal with scene clutter and multiple moving objects.
This approach models the values of a particular pixel using a mixture of Gaussian distributions which differ in mean values and standard deviations. The probability of the pixel value Xt is:
, , ,
1
( )t K i t ( ,t i t, i t) i
P X X
, (1)
Single frame acquisition
Segmentation
Background subtraction
NMC based color segmentation
Feature extraction
NMC Pollen
bearing honey bee
Honey bee without pollen load
Update
x x
P,
Nwhere ( ,Xt i t,, i t,) represents i-th Gaussian distribution corresponding to the i-th Gaussian distribution.
The algorithm proceeds as follows. A pixel Xt is checked against all Gaussian distributions. If there is a Gaussian such that the pixel value is within 2.5 standard deviations of the particular distribution it is considered a match. If none of the K distributions match the pixel value then no match is found. In this case the distribution with the smallest weight is replaced with a new Gaussian distribution that has low prior weight, high variance and mean value that equals the current pixel value.
On the other hand, if a match is found, then prior weights of Gaussian distributions are adjusted in accordance to:
, 1 , 1 ,
k t k t Mk t
, (3)
where Mk t, is equal to 1 if k-th distribution matches the pixel value, and 0 otherwise. The parameterrepresents the learning rate. After the parameters update, the weights are renormalized.
Mean values and variances of unmatched Gaussian distributions remain the same. For the matched Gaussian distribution they
After the parameters update, the Gaussian distributions are sorted in ascending order according to the value of i t, /i t, . The most probable background distributions remain on top, while foreground distributions are at the bottom of the list. The first B Gaussian distributions model the background, where:
. should be regarded as background. The higher the value of this parameter, the more pixels is incorporated in background.
Unfortunately, the described algorithm assigns some background pixels to moving objects (honey bees). However, having in mind dominant colors of honey bees and pollen, we decided to paint the flight board in blue, which allows us to improve the results of MOG-based moving object segmentation using color segmentation.
First, we created a training dataset which contains images of honey bees detected using MOG background subtraction applied to a set of training video frames. Each training image is manually annotated as whether it contains a pollen bearing honey bee or not. After that, k-means algorithm is used to cluster the pixels of each honey bee image without pollen load from the training image set into two clusters in L*a*b* color space: the blue background cluster and the honey bee cluster. The background cluster centroid μB and the honey bee cluster centroid μ are calculated based on all honey bee images without pollen load from the training image set. These mean centroids values are used in the Nearest Mean Classifier (NMC) for color segmentation of honey bees both in the training and test phases.
Finally, prior to classification, using mathematical morphology operations, we remove moving objects with the number of pixels less than 70% of the average number of pixels of segmented objects in the current frame.
3.2 Classification
Having observed a lot of honey bee images similar to the examples shown in Figure 4, we based our approach on color variance and eccentricity features. The color variance of the moving honey bees is greater in the pollen bearing honey bees then in the others. When color variance instead of dominant color is used as a descriptor, the influence of non-uniform illumination on classification results is reduced. The object eccentricity is used because the shape of the honey bees that do not have pollen load is less circular than in the case of pollen bearing honey bees. Color variance and eccentricity features form the four-dimensional honey bee descriptorx. We used the NMC to classify these descriptors into two classes: the class P of pollen bearing honey bees, and the class N of honey bees that do not have pollen load:
P N
The four-dimensional descriptor is created for each object in the analyzed video frame. The elements of the descriptor are the
honey bee, the color variance is used to describe the variation of the pixel color values, [ , , ]T
The calculation of eccentricity is as follows:
2 2 2
(a)
(b)
Figure 4. Parts of video frames with (a) pollen bearing honey bee, (b) honey bee without pollen load (best viewed in color)
where: 02
2Mnumber of pixels inside contour shape,
m nk, k
pixel coordinates, and
m nc, c
center of mass of the segmented honeybee.
Two mean eccentricities P and N of the pollen bearing honey bees and the honey bees without pollen load, respectively, are estimated from the manually annotated honey bees in the training image set.
Two mean color variances σP and σN of the pollen bearing honey bees and the honey bees without pollen load, respectively, are initially estimated based on the manually annotated honey bees from the training image set and updated after each classification of a single video frame in the following way: bees estimated from all previous video frames including training data set,
(a)
(b)
(c)
Figure 5. (a) An analyzed part of a recorded video frame, (b) segmented honey bees, (c) recognized pollen bearing honey
bees (best viewed in color)
N
σ mean color variance of honey bees that do not have pollen load estimated from all previous video frames including training data set, P
N number of pollen bearing honey bees in all previous video frames including training data set,
N
N number of honey bees that do not have pollen load in all previous video frames including pollen load in current video frame.
Notice that the same mean color μ is used for both mean color variances σP and σN calculation. In that way we favor difference between high variance value for pollen bearing honey bees and low variance value for honey bees without pollen.
4. EXPERIMENTAL RESULTS
We mounted the sensing box with the camera and the Raspberry Pi model 2 board, described in Section II, on a standard hive in the apiary intended for bee behavior research. RGB color video is recorded using the Raspberry Pi camera module, with resolution of 1280x720 pixels and at 30 FPS. An example of recorded frame is shown in Figure 5(a). As we already mentioned, in order to avoid non-uniform illumination in the camera field of view under the sensing box, we analyze only the lower part of each video frame (1280x360 pixels) close to the hive entrance. Using the described acquisition system, an in-house data set was created and manually annotated. The data
set consists of training honey bee images and test video frames. The training data set contains 50 images of pollen bearing honey bees and 50 images of honey bees that do not have pollen load. These 100 images are gathered from 40 training video frames. For the test phase we used 50 video frames with 354 images of honey bees in total. We have gathered the video data at the University of Banja Luka campus apiary, in September 2015. The proposed algorithm for pollen bearing honey bee detection is implemented in Python using OpenCV and executed on Raspberry Pi.
4.1 Efficiency of the Proposed Method
Although the recorded video suffers from non-uniform illumination, the background subtraction MOG algorithm has successfully coped with this issue. Followed by NMC color segmentation and removal of small objects with dimensions less than 70% of the average moving object size in the current frame, this method prepares images of honey bees for classification. An example of segmented honey bees is shown in Figure 5(b), and the detected pollen bearing honey bees for this example are shown in Figure 4(c). The pieces of pollen may remain on the flight board, as can be seen near the honey bee in the lower right corner of Figure 5(a). It is possible that such a pollen piece touches the bee as is exactly the case in the example shown. Nevertheless, MOG algorithm correctly segments only the bee without pollen load because the pollen is not moving.
The proposed pollen bearing honey bee detection algorithm needs initial values for the mean color μ, color variances σP and σN, and eccentricities P and N. The initial values are estimated from the training set.
From the recorded test video our algorithm correctly classified 88.7% honey bees. Without any optimization, classification takes on average 1.6 s per frame and MOG algorithm takes additional 420 ms per frame.
4.2 Comparisons with State-of-the-Art Image Classification Method
In order to compare the results obtained using the proposed algorithm running on the Raspberry Pi, with much more sophisticated classification methods, the recorded video is transferred to the host workstation through WLAN. For comparison purposes, we implemented a bee image classifier which uses state-of-the-art image representation and support vector machines (SVM). Bee images are obtained using background subtraction, as before, and then classified with respect to the presence of pollen in the image. Image representation is based on local multispectral Scale-Invariant Feature Transform (MSIFT) descriptors (Avramovic, 2016), extracted densely from 12 12 pixels patches, sampled with step size of 1 pixel. Multispectral SIFT descriptors are an extensions of standard SIFT descriptors to multispectral (including RGB) images, obtained by concatenating SIFT descriptors computed for each spectral band. Prior to computing SIFT descriptors, pixel values in spectral bands are decorrelated using principal component analysis (PCA).
Image representation is finally obtained using Vectors of Locally Aggregated Descriptors (VLAD) representation (Jegou, 2012) applied to local MSIFT descriptors. VLAD representation has shown very good results in both image
retrieval (Ozkanet, 2014) and classification (Negrel, 2014). In order to obtain VLAD image representation, a codebook of local descriptors is first learned, using, for example, k-means algorithm. Local descriptors are then assigned to the closest codewords. Finally, differences between local descriptors and corresponding codewords are aggregated into an image representation.
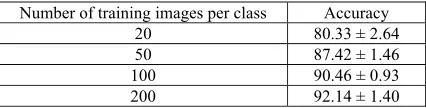
In the experiments in this paper we used a codebook with 20 codewords. MSIFT descriptors for RGB images are 384-dimensional, which results in VLAD image representation whose dimensionality is 20 384 7680 . We used linear SVM classifier, trained with 20, 50, 100, and 200 images, with equal contributions from positive and negative classes. Training and test phases are repeated 10 times with different, random, training/test splits of the data and means and standard deviations of the classification accuracies are reported. The obtained results are summarized in Table 1.
Number of training images per class Accuracy
20 80.33 ± 2.64
50 87.42 ± 1.46
100 90.46 ± 0.93
200 92.14 ± 1.40
Table 1. Classification accuracies (%) using VLAD image representation and SVM classifier obtained using training sets
of different sizes
We implemented the representation computation and image classification using MATLAB on a computer with Intel i3 processor and 8 GB of RAM. Computing VLAD image representation takes 350 ms, and classification using SVM takes another 5.8 ms per image. Having in mind that, there are, on average, approximately 7 bees in a video frame, we arrive at a time of 2.5 s per frame.
From the results in Table 1. we can see that the proposed algorithm attains the classification accuracy comparable to the accuracy of much more sophisticated VLAD image representation and SVM classifier, when 50 training images per class are used. From the execution time point of view, the proposed algorithm on Raspberry Pi executes twice faster than the described SVM classifier on a computer with Intel i3 processor. These characteristics favor the proposed method particularly because it avoids video transmission.
5. CONCLUSION
In this paper, we presented a visual based system for detection of pollen bearing honey bees in video recorded at the hive entrance. The proposed algorithm is simple enough and computationally efficient to be implemented on embedded systems with limited resources and executed in real time. The segmentation method consists of background subtraction, nearest mean classification based color segmentation and morphology methods. For the classification task we use color variance and eccentricity features, and nearest mean classifier. Due to the lack of similar results in the literature, we decided to compare our simple algorithm, executed on-line on the proposed embedded system, which has been mounted on a standard hive in an apiary, to complex algorithms that execute of-line on a remote workstation. The obtained results of 88.7% correct classification at 50 training images per class show that
the results of the proposed algorithm is not far behind compared to the complex classification methods. These classification results can be used for further analysis, for example honey bee tracking and counting, with a final goal of pollination monitoring. Together with low cost, the obtained classification results favour the proposed simple algorithm for pollen bearing honey bee detection, particularly taking in mind that HD video transmission is still an issue.
The obtained results on honey bees' detection at the hive entrance and their classification into two classes, bearing pollen or not, are promising, but there is a lot of space for improvement. First of all, we assume that the results will be better if videos with higher spatial resolution are used, still retaining the real time execution. Some improvements in background subtraction algorithm can be done in relation to regions with touching objects, where multiple honey bees are segmented as a unique object. Moreover, we suppose that most of the improper classifications are a consequence of background parts attached to the segmented honey bees. These regions that consist of honey bee and background parts have high color variation, and therefore are classified as pollen bearing honey bee regardless of whether they carry pollen or not. Therefore, some efforts should be invested in better honey bee segmentation that will certainly improve the classification.
We plan to improve the sensing box construction and record and annotate additional videos. We hope that future extensive tests will give us more insight into the algorithm drawbacks, which should result in improved classification.
ACKNOWLEDGEMENT
This research was supported in part by the Ministry of Science and Technology of the Republic of Srpska, Bosnia and Herzegovina, under the contract 19/6-020/961-37/15.
REFERENCES
Abou-Shaara, H. F., 2014. The foraging behaviour of honey bees, Apis mellifera: a review. Veterinarni Medicina, 59(1), pp. 1-10.
Avramović, A. & Risojević, V., 2016. Block-based semantic classification of high-resolution multispectral aerial images, Signal, Image and Video Processing, 10(1), pp. 75–84. Campbell, J., Mummert, L., & Sukthankar, R., 2008. Video monitoring of honey bee colonies at the hive entrance. ICPR Workshop on Visual observation & analysis of animal & insect behavior, pp. 1-4.
Chiron, G., Gomez-Krämer, P., & Ménard, M., 2013. Outdoor 3D Acquisition System for Small and Fast Targets. Application to honeybee monitoring at the beehive entrance. In: GEODIFF 2013, pp. 10-19.
Delaplane, K. S., van der Steen, J., & Guzman-Novoa, E., 2013. Standard methods for estimating strength parameters of Apis mellifera colonies. Journal of Apicultural Research, 52(1), pp. 1-12.
Jegou, H., Perronnin, P., Douze, M., Sanchez, J., Perez, P., & Schmid, C., 2012. Aggregating local image descriptors into compact codes, IEEE Trans. on Pattern Analysis and Machine Intelligence, vol. 34, no. 9, pp. 3304–3311.
Kale, D. J., Tashakkori, R., & Parry, R. M., 2015. Automated beehive surveillance using computer vision. In: SoutheastCon 2015. IEEE, pp. 1-3.
Negrel, R., Picard, D., & Gosselin, P. H., 2014. Evaluation of second-order visual features for land-use classification. In Proc. 12th International Workshop on Content-Based Multimedia Indexing (CBMI), pp. 1-5.
Ozkan, S., Ates, T., Tola, E., Soysal, M., & Esen, E., 2014. Performance Analysis of State-of-the-Art Representation Methods for Geographical Image Retrieval and Categorization. IEEE Geoscience and Remote Sensing Letters, vol. 11, no. 11, pp. 1996-2000.
Potts, S. G., Biesmeijer, J. C., Kremen, C., Neumann, P., Schweiger, O., & Kunin, W. E., 2010. Global pollinator declines: trends, impacts and drivers. Trends in ecology & evolution, 25(6), pp. 345-353.
Reynolds, D. R., & Riley, J. R., 2002. Remote-sensing, telemetric and computer-based technologies for investigating insect movement: a survey of existing and potential techniques. Computers and Electronics in Agriculture, 35(2), pp. 271-307. Stauffer, C., & Grimson, W. E. L., 1999. Adaptive background mixture models for real-time tracking. In: Proc. IEEE Computer Society Conference on Computer Vision and Pattern Recognition (Vol. 2).
Streit, S., Bock, F., Pirk, C. W., & Tautz, J., 2003. Automatic life-long monitoring of individual insect behaviour now possible. Zoology, 106(3), pp. 169-171.
Zacepins, A., Brusbardis, V., Meitalovs, J., & Stalidzans, E., 2015. Challenges in the development of Precision Beekeeping. Biosystems Engineering, 130, pp. 60-71.
Revised March 2016