AN INQUIRY-BASED TEACHING TOOL FOR
UNDERSTANDING ARTERIAL BLOOD PRESSURE
REGULATION AND CARDIOVASCULAR FUNCTION
Heidi L. Collins, David W. Rodenbaugh, Todd P. Murphy, Jennifer M. Kulics, Cynthia M. Bailey, and Stephen E. DiCarlo
Depa rtm ent of Physiology, Wa yne Sta te University, School of Medicine, Detroit, Michiga n 48201
E
ducators are placing a greater emphasis on the development of cooperative laboratory experiences that supplement the traditional lecture format. The new laboratory materials should encourage active learning, problem-solving, and inquiry-based approaches. To address these goals, we developed a laboratory exercise designed to introduce students to the hemodynamic variables (heart rate, stroke volume, total peripheral resistance, and compliance) that alter arterial pressure. For this experience, students are presented with ‘‘unknown’’ chart recordings illustrating pulsatile arterial pressure before and in response to several interventions. Students must analyze and interpret these unknown recordings and match each recording with the appropriate intervention. These active learning procedures help students understand and apply basic science concepts in a challenging and interactive format. Furthermore, laboratory experiences may enhance the students’ level of understanding and ability to synthesize and apply information. In conducting this exercise, students are introduced to the joys and excitement of inquiry-based learning through experimentation.AM. J. PHYSIOL. 277 (ADV. PHYSIOL. EDUC. 22): S15–S28, 1999.
Key words: inquiry-based learning; collaborative learning; teaching; cardiovascular physiology
Traditional learning is undergoing a transformation in the life science classroom. This transition is necessary because educators have traditionally placed an ‘‘over-emphasis on technical rationality or the technical knowledge base for professions’’ (18). Consequently, young professionals are not prepared to handle situa-tions that require more than just technical skills to solve the problem. Furthermore, students function passively in these situations, like vessels waiting to be filled with a predetermined body of knowledge. How-ever, to become problem solvers and critical thinkers, students must become actively involved in the learn-ing process (2, 10, 11). Active involvement enhances the students’ level of understanding and ability to
integrate and synthesize material. Active involvement also improves the students’ conceptualization of sys-tems and how they function and increases the stu-dents’ level of retention (8, 13).
because many schools do not have sufficient funding or facilities to care for live animals. In addition, some teachers may lack the experience of handling labora-tory animals (15).
To address these concerns, we developed an inquiry-based, cooperative laboratory exercise investigating cardiovascular physiology in a way that required students to become actively involved and responsible for their learning (19). We wanted to create an experience that could be used by teachers and stu-dents who do not have the resources required for actual experimentation. Students are presented with 10 ‘‘unknown’’ chart recordings presenting pulsatile arterial pressure before and in response to various perturbations. Students are challenged to analyze and interpret these unknown recordings and match them with the perturbations. In conducting the laboratory exercise, students are introduced to the joys and excitement of inquiry-based learning through experi-mentation.
LABORATORY PROCEDURES
Objectives
The objectives of the laboratory exercise are as follows.
1) Introduce principles governing changes in hemody-namic variables and cardiovascular regulation.
2) Introduce various drugs and physiological perturba-tions that alter hemodynamic variables, and explain their effects.
3) Encourage small group discussion and enhance analytic thinking.
4) Apply what students have learned to an experimen-tal situation by identifying an unknown drug or physiological alteration.
Materials needed.Pencils and rulers are required to complete the laboratory exercise.
DESIGN
This exercise is designed for students to determine the identity of an unknown drug or physiological
alter-ation by observing its effect on arterial pressure and heart rate. Students are challenged to combine their knowledge of cardiovascular physiology with back-ground information on drugs and/or mechanical alter-ations to elucidate which chart recording demonstrates the results from a pharmacological or mechanical alteration (1, 3, 9, 12, 14). To accomplish this goal, students will need to calculate systolic blood pressure, diastolic blood pressure, mean arterial pressure, and heart rate from Charts 1–10. Using these values, students must then determine which intervention caused the results illustrated in each chart recording.
Before beginning this exercise, students should have a solid background in cardiovascular physiology, includ-ing hemodynamics and reflex control. The followinclud-ing perturbations or drugs were administered.
1) Right vagal stimulation. The right vagus nerve innervates the sinoatrial (SA) node of the heart. Stimula-tion of the right vagus nerve inhibits the sinoatrial node.
2) Phenylephrine administration. Phenylephrine is an
a1-adrenergic receptor agonist.
3) Epinephrine administration. Epinephrine is a non-specificb-adrenergic receptor agonist.
4) Bilateral carotid occlusion. Bilateral carotid occlu-sion below the carotid sinus reduces arterial pressure in the carotid sinus.
5) Nitroglycerine administration. Nitroglycerine is a nitric oxide donor.
6) Ouabain administration. Ouabain is a Na1-K1
-ATPase inhibitor.
7) Atropine administration. Atropine is a nonspecific muscarinic receptor antagonist.
8) Right stellate stimulation. Sympathetic fibers from the right stellate ganglion innervate the SA node of the heart. Stimulating the right stellate ganglion will increase sympathetic stimulation to the heart.
vessel can be stretched. A vessel with an increased compliance has a greater volume for each unit change in pressure.
10) Decreased arterial compliance. A vessel with a decreased compliance has a smaller volume for each unit change in pressure.
EXPLANATIONS OF ANSWERS
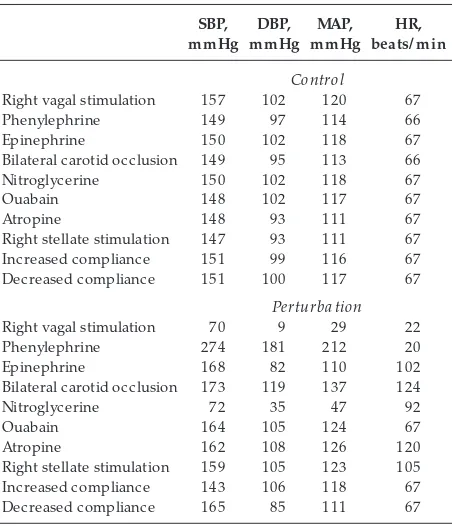
Table 1 presents systolic blood pressure, diastolic blood pressure, mean arterial pressure, and heart rate before and during each intervention. Students may calculate values slightly different from those provided. Our intention is to provide a guideline by which the instructor can assess the logic and reasoning of the students’ answers.
Right Vagal Stimulation (Chart 1)
The various regions of the heart function in an orderly sequence to produce a healthy heartbeat. For an
orderly contraction to take place, an action potential must follow through a specialized cardiac conduction system to all parts of the myocardium. The contractile response of the heart begins just after the action potential. The structures making up this specialized conduction system are the SA node, the atrioventricu-lar (AV) node, the bundle of His and its branches, and the Purkinje fibers. Each of these components of the cardiac conduction system is capable of spontaneous discharge, so it is crucial that they are sequenced so as to produce a fluid contraction. This is accomplished by the difference in discharge rates of the various conducting tissues. Under normal conditions the SA node discharges most rapidly. The electrical impulses then stimulate the right atria to contract. The impulses then travel to the AV node, the bundle of His, and finally, the Purkinje fibers, which traverse into the ventricles, resulting in ventricular contraction. The rapid rate of the SA node sends a depolarizing action potential to the other regions before they are able to discharge spontaneously. Thus the SA node is com-monly referred to as the pacemaker of the heart.
A factor that influences the discharge rate of the SA node (and consequently heart rate) is the autonomic nervous system (ANS). The ANS is subdivided into two components: the parasympathetic nervous system (PNS) and the sympathetic nervous system (SNS). The TABLE 1
Systolic, diastolic, and mean arterial blood pr essur es and heart rate befor e and during the simulated phar macological
or mechanical perturbations
Right vagal stimulation 157 102 120 67
Phenylephrine 149 97 114 66
Epinephrine 150 102 118 67
Bilateral carotid occlusion 149 95 113 66
Nitroglycerine 150 102 118 67
Ouabain 148 102 117 67
Atropine 148 93 111 67
Right stellate stimulation 147 93 111 67
Increased compliance 151 99 116 67
Decreased compliance 151 100 117 67
Perturba tion
Right vagal stimulation 70 9 29 22
Phenylephrine 274 181 212 20
Epinephrine 168 82 110 102
Bilateral carotid occlusion 173 119 137 124
Nitroglycerine 72 35 47 92
Ouabain 164 105 124 67
Atropine 162 108 126 120
Right stellate stimulation 159 105 123 105
Increased compliance 143 106 118 67
Decreased compliance 165 85 111 67
SBP, systolic blood pressure; DBP, diastolic blood pressure; MAP, mean arterial blood pressure; HR, heart rate.
CHART 1.
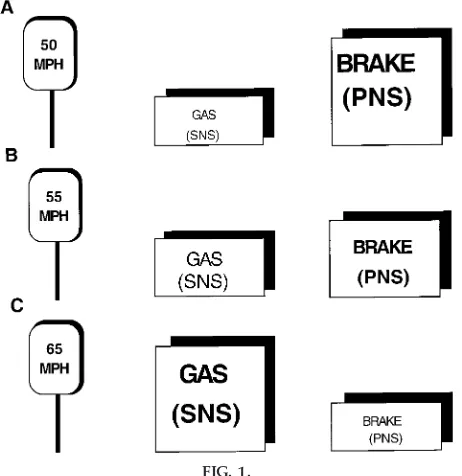
PNS functions to decrease heart rate. The SNS func-tions to increase heart rate. The interaction between the two systems can be compared with the gas and brake pedals on a car (Fig. 1). The SNS is analogous to the gas pedal and the PNS to the brake pedal. Suppose a person driving a car has his or her right foot on the gas pedal and his or her left foot on the brake pedal to maintain a speed of 55 miles per hour (mph) (Fig. 1A). To accelerate the car to 65 mph, the gas pedal is activated while the activity to the brake pedal is diminished (Fig. 1B). Alternately, to decelerate the car to 50 mph, the brake pedal is activated and the activity to the gas pedal is diminished (Fig. 1C). Both pedals work together to allow the car to speed up or slow down. Similarly, both components of the ANS func-tion together to regulate heart rate. At rest the SNS and PNS work together to maintain a resting heart rate of 80 beats/min. To increase heart rate, activity of the PNS is diminished while activity of the SNS is
in-creased. Conversely, a decrease in heart rate is achieved by an increase in the PNS and a decrease in the SNS.
Both the sympathetic and parasympathetic nervous system innervate the SA node. Stimulation of the right vagus (PNS) nerve releases acetylcholine on the m2 receptors of the SA node, which hyperpolarizes the membrane. The hyperpolarization makes it harder for the node to depolarize and create an action potential. The result is a decrease in the firing rate of the SA node, and thus heart rate will decrease. Strong vagal stimulation may completely abolish the discharge rate of the SA node. If vagal stimulation is continued, the heart may beat spontaneously via the spontaneous activation of the AV node. However, the AV node discharges at a lower rate than the SA node, and thus the heart rate paced by the AV node will be slower than that previously paced by the SA node.
A decrease in heart rate in response to right vagal stimulation will have an effect on arterial pressure. Recall that arterial pressure is a product of cardiac output and total peripheral resistance. Furthermore, cardiac output is a product of heart rate and stroke volume. Thus a decrease in heart rate will result in a decrease in cardiac output. Consequently, the reduc-tion in both heart rate and cardiac output decreases arterial pressure. Alternatively, a perturbation that increases heart rate will increase arterial pressure.
Phenylephrine Administration (Chart 2)
Phenylephrine acts on the a-adrenergic receptors of the vasculature to elicit vasoconstriction. The vasocon-strictor response will elicit an increase in total periph-eral resistance. Because mean arterial pressure is a product of cardiac output and total peripheral resis-tance, an increase in total peripheral resistance results in an increase in arterial pressure. The increase in arterial pressure activates arterial baroreceptors located in both the carotid sinus and the aortic arch, which results in a baroreflex-mediated decrease in heart rate caused by vagal activation and sympathetic withdrawal.
Total peripheral resistance is defined as the resistance to blood flow and reflects the state of constriction or dilation within the vascular system. Blood flow is affected by pressure and resistance within the vascula-ture and is calculated by the following equation: flow5pressure/resistance.
FIG. 1.
From this equation, it can be seen that an increase in resistance reduces blood flow. Therefore, an increase in resistance reduces blood flow, trapping blood on the arterial side of the circulation. An increase in blood on the arterial side of the circulation raises arterial pressure.
The radius of the vessel is the single most important parameter affecting total peripheral resistance, as can be seen from Poiseuille’s law. Poiseuille’s law is expressed asR58hl/pr4, where Ris resistance,his the viscosity of the fluid,lis the length of the vessel,p
is 3.14, and r is the radius of the vessel. The most important parameter in this equation is the radius of the vessel. Very small changes in arteriolar radius will cause dramatic alterations in blood flow because resistance varies inversely with the fourth power of the radius. If the radius of the vessel doubles in size, the flow of blood will increase 16-fold.
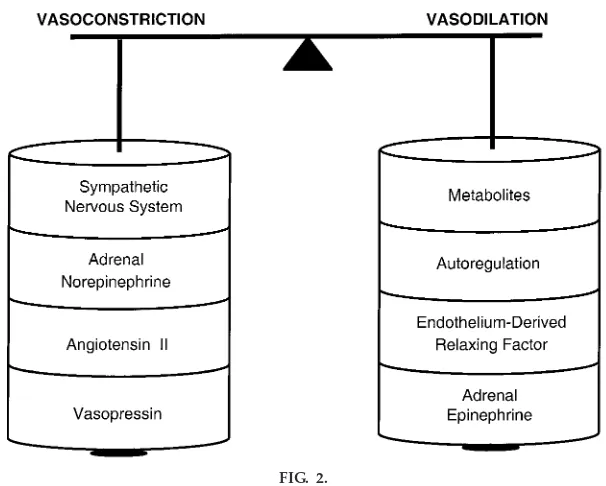
Figure 2 presents the factors that alter vessel radius and thus total peripheral resistance. Factors increasing arteriolar radius (vasodilation) are locally produced metabolites (CO2and ADP), autoregulation (the ability of the tissue to control its own blood supply), and
FIG. 2.
Illustration of balance between vasodilators and vasoconstrictors. Vasocon-strictors include the SNS, adr enal nor epinephrine, angiotensin II, and vasopr essin. Vasodilators include metabolites, autor egulation, endothe-lium-derived r elax ing factor, and adr enal epinephrine.
CHART 2.
flow-dependent release of endothelium-derived relax-ing factors (nitric oxide). Epinephrine released from the adrenal gland also functions to produce vaso-dilation by acting on b2-adrenergic receptors. The c ounterbalanc ing vasoc onstric tor mec hanisms in-clude sympathetic nerve activity, adrenally released norepinephrine, and various hormones (angiotensin II and vasopressin).
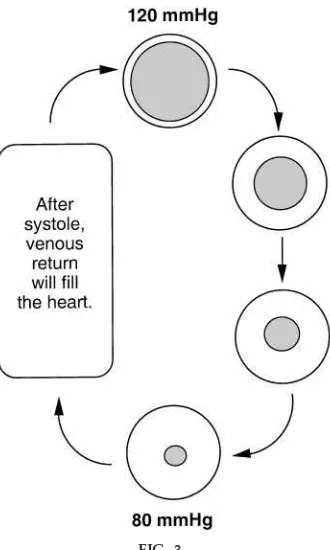
Finally, it is important to reiterate that resistance to blood flow within the vasculature occurs mainly in resistance vessels, at the terminal arterioles. Fluctua-tions in resistance alter blood flow and arterial pres-sure. If resistance increases, blood flow out of the arterial system decreases and the pressure within the
vessel increases (Fig. 3). In contrast, if the resistance decreases, blood flow out of the arterial system increases and the pressure within the vessel de-creases.
Note: Pulse pressure also increases after the administra-tion of phenylephrine. SeeDecrea sed Arteria l Com pli-a ncefor an explanation of the effect of compliance on pulse pressure.
Epinephrine Administration (Chart 3)
In the virtual experiment, epinephrine was adminis-tered at a physiological concentration. This is an important point because either a vasodilatory or vasoconstrictor response will prevail depending on the dose or concentration of epinephrine. This is because there are two major types of adrenergic receptors that epinephrine could bind to, a- and/or
b-adrenergic receptors.a-Adrenergic receptors can be further subdivided into a1- anda2-adrenergic recep-tors. Activation of vascular a-adrenergic receptors elicits vasoconstriction. The b-adrenergic receptors can also be further subdivided into b1- and b 2-adrenergic receptors located on the heart and vascula-ture, respectively. Activation of b-adrenergic recep-tors increases heart rate and contractility (b1) and vasodilation (b2). Epinephrine has a greater affinity for
b-adrenergic receptors; however, it can also bind to FIG. 3.
Illustration of r elationship between the volume of blood in the artery during systole and diastole and the arterial pr essur e. The pr essur e at 120 mmHg r epr e-sents systolic blood pr essur e [pr essur e ex erted by blood (shaded ar ea) against the arterial wall (open ar ea) when heart contracts]. After systole, the volume of blood within the artery begins to decr ease until diastole (pr essur e ex erted by blood against the arterial wall when the heart is r elax ed). After systole, the heart begins to fill with blood (venous r etur n) until contrac-tion (systole). The gr eater the volume of blood in the artery, the higher the arterial pr essur e.
CHART 3.
a-adrenergic receptors. Thus epinephrine can induce vasoconstriction or vasodilation. In addition, epineph-rine always causes an increase in heart rate and contractility.
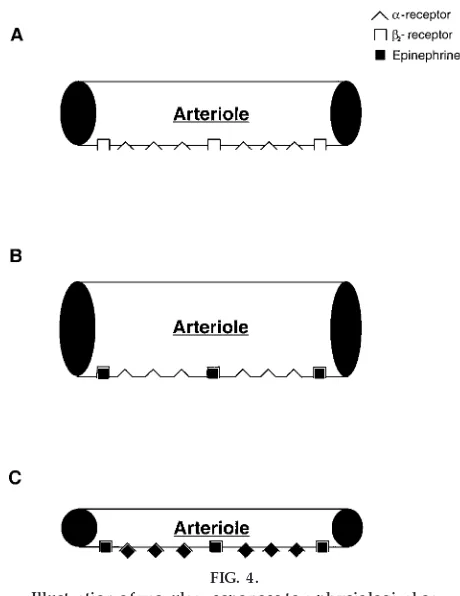
Figure 4 is a schematic representation depicting the vasoconstrictor and vasodilator effects of epineph-rine. An arteriole possess both a- and b2-adrenergic receptors (Fig. 4A). At physiological concentrations, epinephrine preferentially binds tob-adrenergic recep-tors because the affinity of epinephrine to b -adrener-gic receptors is greater than that to a-adrenergic receptors. Thus the vasodilator response will prevail (Fig. 4B). However, at pharmacological
concentra-tions, epinephrine will first bind to b2-adrenergic receptors and then, once the b-adrenergic receptors are saturated, toa-adrenergic receptors. Because there are a greater number ofa-adrenergic receptors than
b2-adrenergic receptors, the vasoconstrictor response will predominate (Fig. 4C).
The pattern of hemodynamic responses to adrenergic receptor stimulation will depend on the type of adrenergic receptor activated. To illustrate this con-cept, Fig. 5 presents arterial pressure, heart rate, cardiac output, and total peripheral resistance re-sponses tob-adrenergic receptor activation (physiologi-cal and pharmacologi(physiologi-cal doses) anda-adrenergic recep-tor ac tivation. At a physiologic al c onc entration, epinephrine preferentially binds tob-adrenergic recep-tors (Fig. 4B). Activation of b2-adrenergic receptors elicits vasodilation, and thus total peripheral resis-tance drops (Fig. 5). Consequently, diastolic blood pressure decreases. In addition, epinephrine increases the force and rate of myocardial contraction. This response is mediated by cardiac b1-adrenergic recep-tors. The resulting enhanced cardiac inotropy in-creases stroke volume and thus raises systolic blood pressure. Furthermore, the arterial baroreflex is insuf-ficient to overcome the direct effect of epinephrine on the heart. As a result, heart rate and cardiac output increase.
When administered at a pharmacological concentra-tion, epinephrine binds to both a- andb-adrenergic receptors (Fig. 4C). In this situation, thea-adrenergic rec eptor-mediated vasoc onstric tor response over-c omes the b-adrenergic -mediated vasodilator re-sponse and total peripheral resistance increases (Fig. 5). Epinephrine also activates cardiac b1-adrenergic receptors to increase the force and rate of myocardial contraction. Together, this effect increases systolic and diastolic blood pressure. The resulting hyperten-sion stimulates arterial baroreceptors, evoking a barore-flex-mediated decrease in heart rate caused by vagal activation and sympathetic withdrawal. However, the reflex decrease in heart rate overrides the direct cardioacceleratory effect of epinephrine, and both heart rate and cardiac output fall.
Finally, activating only vascular a-adrenergic recep-tors elicits yet another series of hemodynamic re-FIG. 4.
Illustration of vascular r esponses to a physiological or phar macological dose of epinephrine.A: an arteriole that contains both a- and b2-adr ener gic r eceptors.
Note that the number ofa-r eceptors ex ceeds that of b2-r eceptors.B: epinephrine administer ed at a
physi-ological concentration only binds tob2-r eceptors
be-cause the affinity tob2-r eceptors is gr eater than that of
a-r eceptors. Activation ofb2-r eceptors elicits
vasodila-tion.C: at a phar macological concentration, epineph-rine will first bind to b2-adr ener gic r eceptors and
sponses. Administration of thea-adrenergic receptor agonist phenylephrine elicits vasoconstriction. Like the pharmacological dose of epinephrine, the vasocon-strictor response increases total peripheral resistance and consequently arterial pressure (Fig. 5). The in-crease in arterial pressure activates arterial
barorecep-tors and evokes a baroreflex-mediated decrease in heart rate. However, unlike the pharmacological dose of epinephrine, phenylephrine does not have a signifi-cant direct effect on the SA node. Consequently, the decrease in heart rate and cardiac output is greater than that of epinephrine.
Bilateral Car otid Occlusion (Chart 4)
The carotid sinus is a small dilation of the internal carotid artery located just above the bifurcation of the common carotid artery. Arterial baroreceptors, which are stretch receptors that monitor the pressure in the arterial circulation, are located in the carotid sinus as well as in the aortic arch. The arterial baroreceptors are stimulated by distension of the vessels in which they are located, and they fire at an increased rate when the pressure in these vessels rises. Bilateral carotid occlusion below the carotid sinus will lower the pressure in the carotid sinus and cause the baroreceptors (located in the carotid sinus) to de-crease their firing rate. This will cause an arterial baroreflex-mediated vagal withdrawal as well as an increase in sympathetic nerve activity to the heart and vasculature. Consequently, heart rate and total periph-eral resistance will increase. The increase in heart rate and total peripheral resistance increases arterial pres-sure. Note, however, that the pressor response during this perturbation activates the aortic baroreceptors. The increased firing rate of the aortic baroreceptors in response to this perturbation sends signals to the vasomotor centers in the medulla of the brain to cause vagal activation as well as sympathoinhibition to the heart and vasculature. Therefore, the pressor and tachycardic response to bilateral carotid occlusion
will be buffered by the opposing responses of the aortic baroreceptors.
Nitr oglycerine Administration (Chart 5)
Nitroglycerine is a nitric oxide donor that acts directly on vascular smooth muscle to elicit vasodilation. The vasodilation will cause a decrease in total peripheral resistance, which lowers arterial pressure. This de-crease in arterial pressure will unload the arterial baroreceptors in the carotid sinus and in the aortic arch, resulting in an arterial baroreflex-mediated in-crease in heart rate caused by vagal withdrawal and sympathetic activation.
The students are challenged to compare and contrast the tachycardic responses between nitroglycerine and epinephrine. The decrease in pressure caused by nitroglycerine is larger than that mediated by epineph-rine because the depressor response is being buffered by only one mechanism, a baroreflex-mediated in-crease in heart rate. Although epinephrine also de-creases arterial pressure, the depressor response is smaller than that mediated by nitroglycerine because it is being buffered by two mechanisms: 1) the baroreflex-mediated increase in heart rate and2) the direct effect of epinephrine in activating cardiac
b1-adrenergic receptors to increase heart rate and CHART 4.
Recor ding of simulated arterial pr essur e befor e and in r esponse to a phar macological or mechanical pertur-bation. [Bilateral car otid occlusion]
=
FIG. 5.
Arterial pr essur e [systolic (top), mean (middle), and diastolic (bottom)], heart rate, car diac output, and peripheral r esis-tance r esponses to a physiological dose of epinephrine, a phar macological dose of epinephrine, and a dose of phenyl-ephrine. The physiological dose of epinephrine incr eased heart rate and contractility due to activation of car diacb1
-adr ener gic r eceptors. The incr ease in heart rate and contrac-tility incr eased car diac output and subsequently systolic blood pr essur e. The physiological dose of epinephrine also decr eased peripheral r esistance by activation ofb2-adr
ener-gic r eceptors. Reductions in peripheral r esistance caused a decr ease in diastolic blood pr essur e. The phar macological dose of epinephrine incr eased systolic, diastolic, and mean arterial blood pressure due to ab1-adrenergic
contractility. As a result, the tachycardic response seen with epinephrine is larger than the tachycardic response seen with nitroglycerine.
Note: Pulse pressure also decreases after the adminis-tration of nitroglycerin. SeeIncrea sed Arteria l Com pli-a ncefor an explanation of the effect of compliance on pulse pressure.
Ouabain Administration (Chart 6)
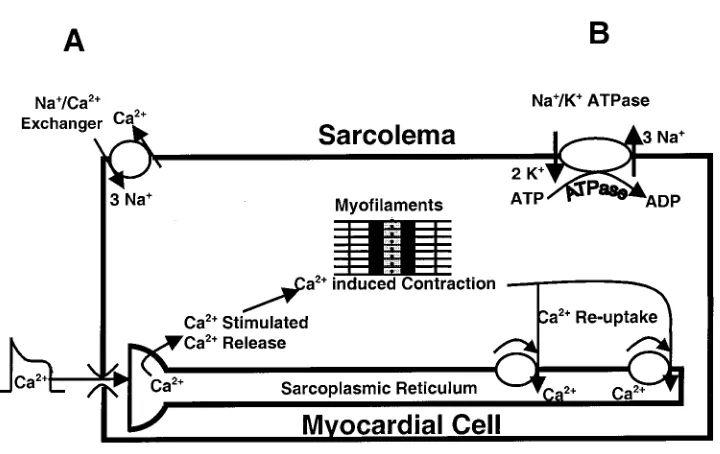
The increase in arterial blood pressure in response to ouabain can be explained by discussing the effect of ouabain on intracellular Ca21. An exchanger
mecha-nism, which removes intracellular Ca21by exchanging
3 Na1for 1 Ca21, exists on the sarcolemma (Fig. 6A). The
energy for this exchange is primarily supplied by the Na1gradient. Under normal conditions, Na1
concen-tration is high outside the cell relative to that inside of the cell. The Na1-K1-ATPase pump maintains this
gradient by pumping 3 Na1out of the cell in exchange
for 2 K1(Fig. 6B). Any intervention that increases the
Na1 gradient will augment the exchanger, thereby
increasing the extrusion of Ca21 from the cell.
Con-versely, any intervention that decreases the Na1
gradi-ent will attenuate the exchanger and increase intracel-lular Ca21. Ouabain inhibits the Na1-K1-ATPase. As
intracellular Na1increases in the presence of ouabain,
the gradient is decreased and the Na1/Ca21exchanger
mechanism slows. This slowing causes intracellular Ca21 to increase, which enhances cardiac inotropy.
The increased contractility will increase stroke vol-ume and lead to an increase in cardiac output. Because peripheral resistance is unchanged, an increase in cardiac output will lead to an increase in arterial pressure.
Atr opine Administration (Chart 7)
Cardiac muscarinic receptors are activated by acetyl-choline, which is the neurotransmitter of the PNS. Administration of the muscarinic-cholinergic receptor antagonist atropine will block the effect of the vagus nerve (parasympathetic innervation) on the heart. This is analogous to removing your foot from the brake (Fig. 1). Subsequently, heart rate will increase. In resting humans, the increase in heart rate is dramatic because heart rate is predominantly con-trolled by the PNS. The increase in heart rate will also cause an increase in cardiac output, which in turn will increase arterial pressure.
Right Stellate Stimulation (Chart 8)
Stimulation of the right stellate ganglion increases sympathetic stimulation to the SA node, which in turn increases heart rate. This is analogous to stepping on CHART 5.
Recor ding of simulated arterial pr essur e befor e and in r esponse to a phar macological or mechanical pertur-bation. [Nitr oglycerine administration]
CHART 6.
the gas (Fig. 1). However, compared with the increase in heart rate after the administration of atropine, the increase in heart rate is much less dramatic. The reason for this difference is the presence of the PNS.
Recall that heart rate is under simultaneous control of the PNS and SNS. Thus the heart rate response to activation of one component will be opposed by the antagonistic action of the other component. This FIG. 6.
Illustration pr esenting effect of ouabain on myocar dial contractility. Ouabain inhibits Na1/ K1pump (B), which causes intracellular Na1concentration to incr ease. The r esulting accumulation of Na1decr eases the ability of the Na1/ Ca21ex changer (A) that nor mally carries Ca21out of the cell. Consequently, intracellular Ca21incr eases, which, in tur n, enhances contractility.
CHART 7.
Recor ding of simulated arterial pr essur e befor e and in r esponse to a phar macological or mechanical pertur-bation. [Atr opine administration]
CHART 8.
would be analogous to speeding up your car by pushing down on the gas pedal while the brake is on. You may be able to speed the car up, but certainly not as much as if you were to take your foot off the brake. Similarly, right stellate stimulation increases heart rate, but not as much as if the PNS were removed. Thus the increase in heart rate in response to right stellate stimulation will not be as dramatic compared with that in response to muscarinic-cholinergic recep-tor blockade because the tachycardic response is being opposed by the PNS.
Although both blockade of the PNS and right stellate stimulation increase heart rate, the initial rise is different between the two. Careful examination of PNS blockade reveals an immediate increase in heart rate. With reference to the car analogy, blockade of the PNS is like removing your foot from the brake while having your foot on the gas. Release of the brake will cause the car to speed up immediately. Alterna-tively, the car can increase its speed if you push down on the gas pedal. However, the time required to reach the desired speed will be longer because the mechani-cal events necessary for the speed to increase are not activated immediately. Similarly, the heart rate in-crease caused by right stellate stimulation is slower because the cellular events necessary for contraction take time to be activated and implemented. Further-more, the increase in heart rate is being opposed by the antagonistic response of the PNS. Together, these differences account for the immediate versus slower reaction times of parasympathetic blockade and right stellate stimulation. Thus PNS responses can occur within one heart beat; however, SNS responses re-quire,12 beats before the response is observed.
Incr eased Arterial Compliance (Chart 9)
Arterial blood pressure is defined as the pressure exerted by the blood against the arterial walls. The volume of blood in the vessel determines the pressure exerted by the blood. Therefore, an increase in the volume of blood results in an increase in arterial pressure. It is important to note, however, that the volume of blood being ejected by the heart remains the same during this perturbation; only the compli-ance of the vessel has changed. The net result of an increase or decrease in compliance does not change mean arterial pressure even though changes in pulse pressure occur.
Pulse pressure is the difference between systolic and diastolic blood pressure. Increasing the compliance of an artery will decrease pulse pressure. To better understand the concept of compliance, compare an artery to a rubber band. A rubber band has an elastic property that allows it to stretch if a force is applied to it. If the rubber band has a high compliance, it can be easily stretched. If the rubber band is let go, it rebounds quickly and forcefully to its original state. Conversely, if the rubber band has a low compliance, it cannot be easily stretched and the rebound effect is reduced. During systole, a vessel with high compli-ance expands, and consequently, systolic blood pres-sure decreases. During diastole, the vessel rebounds and delivers energy into the vascular system, and consequently, diastolic blood pressure increases. The decrease in systolic pressure and increase in diastolic pressure lead to the decreased pulse pressure that is associated with an increase in arterial compliance.
As mentioned inNitroglycerin Adm inistra tion, pulse pressure decreases with the administration of the vasodilator nitroglycerin. Vasodilation increases the peripheral runoff of blood from the arteries through the resistance vessels. Thus the arterial blood volume and mean arterial pressure decrease. This drop in blood volume reduces the stretch on the vascular wall and moves the vessel to a more compliant point on the pressure-volume curve (Fig. 7,point C). Thus
nitroglyc-CHART 9.
erine decreases both mean arterial pressure and pulse pressure.
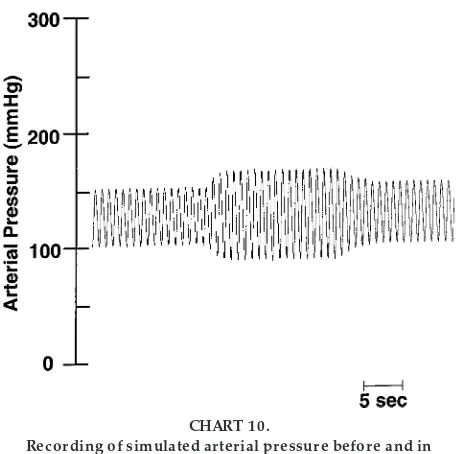
Decr eased Arterial Compliance (Chart 10)
Decreasing the compliance of an artery will increase pulse pressure. To understand these concepts, visual-ize a garden hose that has a minimal ability to stretch compared with that of a balloon. Opening the faucet introduces a bolus of water into the hose, and the wall of the hose will stretch minimally compared with that of a balloon with the same bolus of water. Therefore, the pressure that the water will impose on the wall of the hose will be much greater than that imposed on the wall of the balloon. If a vessel has a decreased compliance, then the vessel is unable to expand and absorb the energy imparted by the blood during systole. Consequently, systolic blood pressure in-creases. Likewise, the less compliant vessel has a reduced rebound effect, and diastolic blood pressure is reduced. Together, the increase in systolic pressure and decrease in diastolic pressure result in an in-creased pulse pressure.
As mentioned inPhenylephrine Adm inistra tion, the vasoconstrictor actions of phenylephrine increases total peripheral resistance as well as pulse pressure. Vasoconstriction decreases the peripheral runoff of blood from the arteries through the resistance vessels.
When peripheral runoff is decreased, both arterial blood volume and mean arterial pressure increase. This increase in blood volume increases the stretch on the vascular wall and moves the vessel to a less compliant point on the pressure-volume curve (Fig. 7, point B).
In summary, this exercise was designed as an inquiry-based, cooperative laboratory experiment to help students apply basic principles of cardiovascular physi-ology (4–7, 16). The students are challenged to assimilate information from chart recordings and match the experimental interventions with the correct chart recording. When this exercise is completed, it is our intent that students not only have a basic understand-ing of cardiovascular physiology but also are encour-aged to continue their exploration of science. This exercise provided a simple yet challenging encounter with cardiovascular physiology without the complica-tions that come with live animal research. Students not only learn the principles of cardiovascular physiol-ogy but also learn to appreciate laboratory work and analysis.
Address for reprint requests and other correspondence: S. E. DiCarlo, Dept. of Physiology, Wayne State Univ., School of Medi-cine, Scott Hall, Detroit, MI 48201 (E-mail: [email protected]).
Received 9 February 1998; accepted in final form 25 August 1999. FIG. 7.
Illustration of compliance, or pr essur e-volume, curve.
Point Ar epr esents the pr essur e-volume r elationship befor e any perturbation. A vasodilator r educes the pr essur e and volume of blood in the arterial cir cula-tion and thus moves to a mor e compliant point (point C) on the pr essur e-volume curve. A vasoconstrictor incr eases the pr essur e and volume of blood in the arterial cir culation and thus moves to a less compliant point (point B) on the pr essur e-volume curve.
CHART 10.
Suggested Reading
1. DiCarlo, S. E., E. Sipe, J. P. Layshock, and R. L. Rosian-Ravas.Experim ents a nd Dem onstra tions in Physiology. Upper Saddle River, NJ: Prentice-Hall, 1998.
Refer ences
1. Ber ne, R. M., and M. N. Levy.Ca rdiova scula r Physiology. St. Louis, MO: Mosby, 1992.
2. Bonwell, C., and J. Eison.Active Lea rning: Crea ting Excite-m ent in the Cla ssrooExcite-m. Washington, DC: George Washington Univ., 1991. (ERIC Clearing House on Higher Education Publica-tion ED340272)
3. Bowdle, T. A., P. R. Fr eund, and G. A. Rooke. Ca rdia c Output. Redmond, WA: Space Labs, 1991.
4. Chandler, M. P., and S. E. DiCarlo.An educational tool for understanding the cardiopulmonary changes associated with aging.Am . J. Physiol. 267 (Adv. Physiol. Educ. 12): S17–S36, 1994.
5. Chen, Y., and S. E. DiCarlo.An educational tool for understand-ing the cardiopulmonary changes associated with heart failure.
Am . J. Physiol. 267 (Adv. Physiol. Educ. 12): S37–S53, 1994. 6. Collins, H. L., and S. E. DiCarlo. An educational tool for
understanding the cardiovascular changes associated with dia-betes.Am . J. Physiol. 269 (Adv. Physiol. Educ. 14): S4–S31, 1995.
7. DiCarlo, S. E., and R. L. Rosian-Ravas. Experim ents a nd Dem onstra tions in Physica l Thera py: An Inquiry Approa ch to Lea rning. Upper Saddle River, NJ: Prentice-Hall, 1999.
8. Elliott, D. D. Promoting critical thinking in the classroom.
Nurs. Educ. 21: 49–52, 1996.
9. Goodman and GilmanThe Pha rm a cologica l Ba sis of Thera -peutics(5th ed.). New York: MacMillan, 1975.
10. Matyas, M. Teaching by inquiry. What is it? Why do it?
Physiologist41: 43, 1998.
11. McKeachie, W., N. Chism, R. Menges, M. Scinicki, and C. E. Weinstein.Learning and cognition in the college class-room. In:Tea ching Tips(9th ed.). Lexington, MA: DC Health, 1994, p. 279–295.
12. Milnor, W. R. Hem odyna m ics (2nd ed.). Baltimore, MD: Williams and Wilkins, 1989.
13. Modell, H. I. Preparing students to participate in an active learning environment.Am . J. Physiol. 270 (Adv. Physiol. Educ. 15): S69–S77, 1996.
14. Nara, A. R., M. P. Bur ns, and W. G. Downs.Biophysica l Mea surem ent Series: Blood Pressure. Redmond, WA: Space Labs, 1989.
15. Odenweller, C. M., C. T. Hsu, E. Sipe, J. P. Layshock, S. Varyani, R. L. Rosian, and S. E. DiCarlo.Laboratory exercise using ‘‘virtual rats’’ to teach endocrine physiology. Am . J. Physiol. 273 (Adv. Physiol. Educ. 18): S24–S40, 1997. 16. Patil, R. D., S. V. Karve, and S. E. DiCarlo. Integrated
cardiovascular physiology: a laboratory exercise.Am . J. Physiol. 265 (Adv. Physiol. Educ. 10): S20–S31, 1993.
17. Richar dson, D. Active learning: a personal view. Am . J. Physiol. 265 (Adv. Physiol. Educ. 10): S79–S80, 1993. 18. Schon, D. Educa ting the Reflective Pra ctitioner. San
Fran-cisco, CA: Jossey-Bass, 1987, p. 3–21.