HYDROPERIOD CLASSIFICATION OF CERVANTES COOLIMBA COASTAL
WETLANDS USING LANDSAT TIME SERIES IMAGERY
R. J. van Dongen a, G. A. Behn a, M. Coote a, A. Shanahan a and H. Setiawan
a Dept, of Environment and Conservation, Perth, Australia – (ricky.vandongen, graeme.behn, michael.coote, anne.shanahan,
hery.setiawan)@dec.wa.gov.au
Commission VIII, WG VIII/4
KEY WORDS: Environment, Hydrology, Monitoring, Landsat, Temporal
ABSTRACT:
Geomorphic classification of wetlands relies on information regarding landform and hydroperiod. Additional attributes of wetland size, vegetation cover and salinity can be collected for lower order classification. Hydroperiod is important in determining features that characterize the ecological function of the wetland. This study examines how Landsat time series imagery was used to describe the hydroperiod of wetlands along the coastal zone between Cervantes to Coolimba in Western Australia. Inundation extent maps were derived using 17, Landsat Band 5 images captured between 1988 and 2011. The number of times a wetland basin was more than 10 % inundated was then calculated. This inundation frequency dataset was then the basis for hydroperiod classification. Wetlands were classified as being permanently inundated if they had more than 10% inundation in 12 or more of the 17 images available (approximately 70%). A Landsat image captured 2 weeks prior to field work was used to determine Band 5 thresholds to identify areas of inundation and assess classification accuracy. Field measurements of surface water cover, depth, secchi depth, vegetation cover and salinity were taken across 16 plots located close to inundation boundaries. The accuracy of the inundation maps was highly dependent on the degree of vegetation cover. Mapping accuracy was heavily influenced by vegetation cover and achieved an overall accuracy of 87.5%. The resulting hydroperiod datasets provides an accurate record of inundation frequency which can be used to aid classification of wetlands and also allows changes to inundation frequency over time to be assessed.
1. INTRODUCTION
Landsat series of satellites has an extensive archive, with data available from 1972, and has been used for mapping and monitoring long term environmental processes (Kuhnell et al., 1998; Caccetta et al., 2007). Indices can be derived from a combination of Landsat spectral bands to provide quantitative information on land cover (Furby et al., 2008). For direct comparison of index values over time, to facilitate land cover monitoring, consistent image processing techniques are required. In the of the south west of WA, consistently processed Landsat data, captured at one and two year intervals, is available from the Land Monitor Project (Furby, 2009).
In this study the Landsat time series was used to assess the hydroperiod of wetlands along a coastal zone in Western Australia. The methodology was taken from Jones (2008). In that study the hydroperiod of wetlands in adjacent catchments was assessed as part of a wetland evaluation program.
1.1. Hydroperiod
Wetlands are defined by Boulton & Brock (1999) as “any area of temporarily or permanently waterlogged or inundated land, natural or artificial, with water that is standing or running, ranging from fresh to saline, and where inundation by water influences the biota and ecological processes occurring at any time”. Hydroperiod (the period of water availability) is an important attribute of wetlands and is used to differentiate between a lake (permanently inundated basin) and a sumpland (seasonally inundated basin) (Semeniuk, 1995). It is also is important in determining features that characterize the ecological function of the wetland.
1.2. Classification Band Selection
In remote sensing studies of wetlands the most common indices used to map and monitor inundation are the tassel cap wetness and Normalised Difference Water Index (NDWI) (Lacaux et al., 2007; Weiss and Crabtree, 2011), a Band 4 (near infrared) and 5 (mid infrared) ratio. Near infrared and mid infrared bands are well suited to locating and delineating water bodies due to strong absorption of water in this region of the spectrum (Lillesand, 1994). Water absorbs less in the visible parts of the spectrum and can be used to map bethic material and estimate turbidity or chlorophyll concentration (Jensen, 2007). Landsat Band 5 was used in this study due to its documented strong absorption by water and for consistency with Jones (2008).
The physical attributes to which moisture indices respond is often poorly defined. The quantitative influences to indices that map “wetness”, which is a relatively common term in the remote sensing field, are rarely described in detail. Brom et al. (2011) state that the NDWI “expresses surface moisture conditions”. While this definition may be useful when analyzing relative change over a time sequence the lack of a quantitative reference makes the assessments difficult to use in ecological studies. A focus on percent of surface water appears to be a more robust and well defined approach than mapping “wetness”. It has been used successfully by Rover (2010) and Weiss and Crabtree (2011). Surface water maps or inundation are also more easily understood and applicable in the ecological domain. Lacaux et al. (2007) used maps of surface water in Senegal to study the potential transmission of Rift Valley Fever.
2. METHODOLOGY
International Archives of the Photogrammetry, Remote Sensing and Spatial Information Sciences, Volume XXXIX-B8, 2012 XXII ISPRS Congress, 25 August – 01 September 2012, Melbourne, Australia
2.1. Study Area
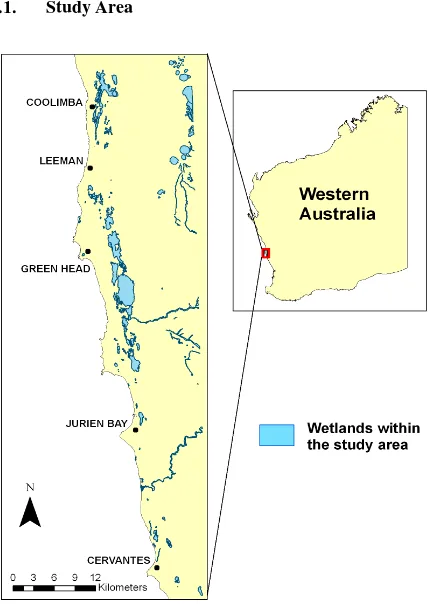
Figure 1: Cervantes to Coolimba coastal wetlands.
Cervantes and Coolimba in Western Australia. Wetlands included in the study area are shown in Figure 1. The study area covers wetlands within approximately 12 km of the coast between
2.2. Wetland Boundaries
The hydroperiod analysis was restricted to areas within mapped wetland boundaries. Boundaries were manually digitized from aerial photography. Areas of water accumulation (derived from a 10 m Digital Elevation Model), soil maps and four winter Landsat images were used as reference data sets. A total of 263 individual wetlands were mapped. The accuracy of the wetland boundaries was then checked in the field and is the subject of an ongoing study.
2.3. Landsat imagery
Calibrated and co-registered Landsat imagery captured in summer and supplied by the Land Monitor Project (Furby, 2010) were used in the analysis. The study area was covered by the Landsat path/row, 113/81. Image dates used in the analysis were 11/2/88, 13/1/90, 22/2/92, 26/1/94, 1/2/96, 26/3/98, 19/1/00, 9/2/02, 17/1/03, 23/2/04, 9/2/05, 27/1/06, 14/1/07, 2/2/08, 18/12/08, 22/1/10, 10/2/11.
2.4. Threshold development
A single Band 5 threshold value to separate inundated from not inundated needed to be defined. Field work to determine this threshold was carried out between 15 and 19 August 2011. Comparing field results from the summer Land Monitor imagery was not possible as conditions had changed considerably since the date of image capture. For this reason a Landsat image captured 5/8/11 was used to compare field
measurements to index values. The scene was downloaded from the United States Geological Survey (USGS) and calibrated to Land Monitor values.
A total of 16, 90 m by 90 m plots which covered relatively homogenous index values were chosen as validation points. Plots were chosen in easily accessible locations running perpendicular to estimated water body boundaries. Across each site the average water depth, percent vegetation cover and percent inundation were estimated. Vegetation cover was estimated by visual interpretation with the assistance of a template (Hnatiuk et al., 2009). The depth to which a secchi disk was visible and salinity were recorded at 3 points across the site and averaged. These field measures were then compared to index values.
2.5. Hydroperiod classification
Perennial vegetation maps produced by the Land Monitor Project for each year were used to remove perennial vegetation within wetland boundaries from the analysis. The inundation threshold was applied to the Land Monitor sequence to create an inundation map for each year. These raster datasets were then converted to polygons. The area of each of the 263 wetland polygons inundated in each year was then calculated. When wetlands had greater than 10% coverage of surface water in a given year they were considered inundated. Wetlands which were inundated 12 or more times were classified as “permanently inundated”. Those inundated less than 12 times were classified as “seasonally inundated” (Jones, 2008). The total area inundated each year was also calculated.
3. RESULTS
3.1. Threshold development
To determine an appropriate Band 5 threshold for separating inundated from not inundated areas Band 5 values were regressed against field measures of percentage surface water coverage. In general Band 5 values decrease with increasing surface water coverage, however 2 outliers appear in the regression (points 1 and 2 in Figure 2). These sites recorded high vegetation cover along with high percentage surface water coverage.
0 40 80 120 160 200
0 20 40 60 80 100
surface water cover %
B
a
n
d
5
1 2
Figure 2: Regression of Band 5 values and percent surface water cover.
Figure 3 is a photo taken at a site which corresponds to point 2 in Figure 2. While 100 percent of the site was covered with International Archives of the Photogrammetry, Remote Sensing and Spatial Information Sciences, Volume XXXIX-B8, 2012
XXII ISPRS Congress, 25 August – 01 September 2012, Melbourne, Australia
surface water, much of this water was covered by a stand of emergent halophytic vegetation. The halophytic vegetation covered 40% of the site and much of the foliage was desiccated. This caused an increase in reflectance of Band 5.
Figure 3: Inundated site with dense coverage of emergent halophytic vegetation. the 3 field sites, located in Lake Logue, are shown in Figure 5.
0
Figure 4: Band 5 values extracted along a transect line which includes 3 sample points with the derived threshold value in red.
Figure 5: Photographs from sites 1, 2 and 3 (left to right) at Lake Logue.
The Lake Logue sites 1, 2 and 3 recorded average water depths of 5, 10 and 25 mm, percent water coverage of 70, 60 and 100 and percentage vegetation cover of 50, 20 and 10 respectively.
A dramatic drop in Band 5 values was observed between sites 1 and 2. While depth and percent water cover are marginally different between the 2 sites vegetation cover drops from 50 to 20 %. inundated” is that it must be more than 10 % inundated for 70 % of the time (or 12 out of the 17 years assessed). Of the 263 wetlands assessed in this study only 2 met this criterion. The remaining wetlands were classified as “Seasonally inundated”.
The total area inundated across all wetlands was also assessed (Figure 6). Area inundated appears fairly consistent across the time period. The year 2000 is anomalous. This can be explained by the heavy winter rainfall in 1999 which helped push the total rainfall, at the nearby Jurien Bay weather station, for this year to 970.8 mm. The mean annual rainfall is 536.3 mm (Bureau of
Figure 6: Area of inundation per year.
4. DISCUSSION
Landsat band 5 was successfully used to separate not inundated from inundated plots. Vegetation cover was found to be the major confounding factor. At 2 plots, high vegetation cover and high surface water cover were recorded. In both cases band 5 digital counts were significantly higher than sights with low vegetation cover. Furthermore, these sites could not be separated from vegetated sites that were not inundated.
The reflectance of vegetation in band 5 is influenced by moisture content and thickness of the leaf (Lillesand & Kiefer, 1994). Vegetation will absorb more light in Band 5 than bare soil and will reflect more than water. The percentage of vegetation cover at which band 5 reflectance increases is difficult to discern from this study, but it is likely to be heavily dependent on the type of vegetation. Both 40 % coverage of woody halophytic vegetation and 70 % coverage of lush grassy vegetation were sufficient to dramatically increase band 5 International Archives of the Photogrammetry, Remote Sensing and Spatial Information Sciences, Volume XXXIX-B8, 2012
XXII ISPRS Congress, 25 August – 01 September 2012, Melbourne, Australia
reflectance. This suggests that vegetation cover has a strong influence on the ability of band 5 to identify inundated areas.
The inability to identify vegetated areas that are also inundated means that the derived inundation maps and hydroperiod classification will only work reliably in areas of low vegetation cover. This supports the step in the methodology to remove areas of perennial vegetation from the analysis.
Results from the field plot provide a clear picture of the physical attributes being mapped. This aspect is missing in many other remote sensing studies that analyze wetland dynamics (Kleinod et al., 2005; Lacaux et al., 2007; Rover 2010; Zhao et al., 2011). The reported mapping accuracy is high, at 87%. However, as many sample plots were located in the transition zone, where errors are most likely to occur, this may understate the true accuracy. A large number of randomly located sample points would provide a more robust assessment of overall mapping accuracy. Due to the limited time in this study and difficulties in accessing many of the sites this was not possible.
5. CONCLUSION
The application of the inundation mapping to a calibrated series of Landsat imagery allows the dynamics of individual wetlands and wetlands spread across broad region to be assessed. In this study the hydroperiod of 263 wetlands across an 80 by 15 km area was assessed.
The field data collected in this study demonstrated that inundation can be mapped to a high degree of accuracy in open wetlands with low vegetation cover. However, when vegetation cover increases the ability to detect inundation is lost.
Inundated areas were mapped to an overall accuracy of 87.5%. The resulting hydroperiod datasets provides an accurate record of inundation frequency which can be used to aid classification of wetlands and also allows changes to inundation frequency over time to be assessed.
6. REFERENCES
Boulton, A. J. & Brock, M. A. (1999). Australian Freshwater Ecology: Processes and Management. Gleneagles Publishing, Glen Osmond.
Brom, J., Nedbal, V., Procházka, J. & Pecharová, E. (2011). "Changes in vegetation cover, moisture properties and surface temperature of a brown coal dump from 1984 to 2009 using satellite data analysis." Ecological Engineering.
Caccetta, P., Furby, S., O’Connell, J., Wallace, J. & Wu, X. (2007). Continental Monitoring: 34 Years of Land Cover Change Using Landsat Imagery. 32nd International Symposium on Remote Sensing of Environment. San Jose, Costa Rica.
Furby, S. (2009). Land Monitor Vegetation Image Date Summary: Land Monitor II 2009 Update. Perth, Western Australia, CSIRO Mathematical and Information Sciences.
Furby, S. (2010). Land Monitor Vegetation Image Date Summary, CSIRO Mathematical and Information Sciences.
Furby, S., Zhu, M., Wu, X. & Wallace, J. F. (2008). Vegetation Trends 1990-2008: South West Agricultural Region of Western Australia: 2008. Perth, Australia, CSIRO Mathematical and Information Sciences.
Hnatiuk, R. J., Thackway, R. & Walker (2009). Australian soil and land survey field handbook. Melbourne, CSIRO Publishing.
Jensen, J. (2007). Remote Sensing of the Environment: An Earth Resourse Perspective. Upper Saddle River, Pearson Prentice Hall.
Jones, S., Pindar, A., Sim, L., Halse, S (2008). Evaluating the conservation significance of basin and granite outcrop wetlands within the Avon Natural Resource Management region: Stage One Assessment Method. Department of Environment and Conservation.
Kleinod, K., Wissen, M. & Bock, M. (2005). "Detecting vegetation changes in a wetland area in Northern Germany using earth observation and geodata." Journal for Nature Conservation, 13(2-3): 115-125.
Kuhnell, C. A., Goulevitch, B. M., Danaher, T. J. & Harris, D. P. (1998). Mapping Woody Vegetation Cover over the State of Queensland using Landsat TM Imagery. Proceedings 9th Australasian Remote Sensing and Photogrammetry Conference. Sydney, Australia.
Lacaux, J. P., Tourre, Y. M., Vignolles, C., Ndione, J. A. & Lafaye, M. (2007). "Classification of ponds from high-spatial resolution remote sensing: Application to Rift Valley Fever epidemics in Senegal." Remote Sensing of Environment, 106(1): 66-74.
Lillesand, T. & Kiefer, R. (1994). Remote Sensing and Image Interpretation. New York, John Wiley & Sons, Inc.
Bureau of Meteorology (2011). "Climate Data Online." www.bom.gov.au/climate/data/ (5/1/2012)
Rover, J. (2010). "A self-trained classification technique for producing 30 m percent-water maps from Landsat data." International journal of remote sensing, 31(8): 2197-2203.
Semeniuk, C. & Semeniuk, V. (1995). "A geomorphic approach to global classification of inland wetlands." Vegetatio, (118): 103-124.
Weiss, D. J. and R. L. Crabtree (2011). "Percent surface water estimation from MODIS BRDF 16-day image composites." Remote Sensing of Environment, 115(8): 2035-2046.
Zhao, X., Stein, A. & Chen, X. (2011). "Monitoring the dynamics of wetland inundation by random sets on multi-temporal images." Remote Sensing of Environment, 115(9): 2390-2401
International Archives of the Photogrammetry, Remote Sensing and Spatial Information Sciences, Volume XXXIX-B8, 2012 XXII ISPRS Congress, 25 August – 01 September 2012, Melbourne, Australia