REMOTE SENSING TECHNIQUES TO ASSESS POST-FIRE EFFECTS AT THE
HILLSLOPE AND SUB-BASIN SCALES VIA MULTI-SCALE MODEL
A. Brook a,*, M. Polinova a, D. Kopel a, D. Malkinson b, L. Wittenberg b, D. Roberts c,N. Shtober-Zisud
a Spectroscopy & Remote Sensing Laboratory, Center for Spatial Analysis Research (UHCSISR), Department of Geography and
Environmental Studies, +972-4-8249612, +972-4-8249605 (fax), University of Haifa, Mount Carmel, 3498838, Israel - [email protected], [email protected], [email protected]
b Geomorphology Laboratory, Department of Geography and Environmental Studies, University of Haifa, Israel -
[email protected], [email protected]
c Geography Department, University of California Santa Barbara, Santa Barbara, CA, USA - [email protected] d Department of Israel Studies, University of Haifa, Israel - [email protected]
Commission VI, ICWG II/III
KEY WORDS: Multiscale model, log-Gaussian Cox processes, hillslope micro-topography, post-fire environment
ABSTRACT:
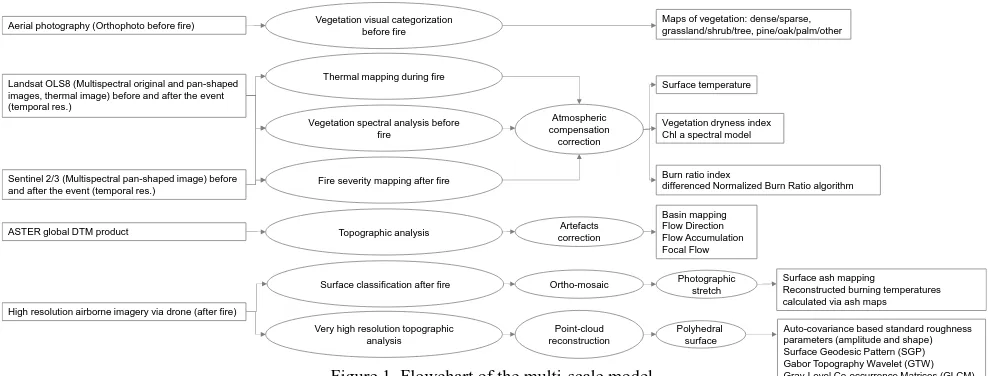
Post-fire environmental footprint is expected at varying scales in space and in time and demands development of multi-scale monitoring approaches. In this paper, a spatially and temporally explicit multi-scale model that reveals the physical and morphological indicators affecting hillslope susceptibility at varying scales, is explained and demonstrated. The qualitative and quantitative suitability classification procedures are adapted to translate the large-scale space-borne data supplied by satellite systems (Landsat OLS8 and Sentinel 2 and 3) to local scale produced by a regional airborne survey performed by unmanned aerial vehicle (UAV). At the smallest spatial and temporal resolution, a daily airborne imagery collection by UAV is linked to micro-topography model, using statistical and mathematical approaches.
1. INTRODUCTION
Among many potential threats, wildfires are widely viewed as events impacting outlying spaces that, by definition, stand out from the urbanized world. There is a widespread sentiment that vegetated areas and cities follow exclusive relationships based on some geographical incompatibility. Against this background, planning partners usually agree to the idea of a necessary cordon sanitaire. Through a process of making every effort to resolve any danger, linearity must prevail over an aerial uncertainty believed to be the source of all problems. To put it in another way, compact cities are more resilient to fire than open areas (Alavalapati, 2005). The notorious concept of Wildland Urban Interface (WUI) validates the idea of spatial dichotomy, both ex-ante and ex-post. A critical analysis of the literature shows that most scientists acknowledge this dichotomy while focusing their attention on helping to identify sensitive perimeters and improve prevention systems (Lampin-Maillet et al., 2010). These perspectives evoke matter at its most concrete. Urban areas are viewed as forms, and morphology is supposed to be the best possible mean to describe what cities have become. Strenuous efforts are pledged for building powerful GIS and remote sensing databases to help stem the “problem” of increased mitigation in urban outskirts.
Urban nature ecosystems are subject to a variety of disturbances with increasing intensities and frequencies, which may permanently change the trajectories of forest recovery and disrupt the ecosystem services provided by trees. Fire and invasive species, especially exotic disease-causing pathogens and insects, are examples of disturbances that together could pose major threats to forest health.
Post-fire soil erosion is one of the crucial factors to be monitored after the fire event. This effect potentially might decline the site productivity and might affect downstream resources. Thus, the hillslopes are expected to enhance surface runoff and erosion immediately after fire. This effect is also because of removal of protective vegetation and litter cover, ash cover and reduced soil wettability.
The relation between erosion and surface runoff generation and the susceptibility of hillslopes is well established in the literature (Pannkuk and Robichaud, 2003; Shakesby and Doerr, 2006, Cerda and Doerr, 2008). However, these effects has been studies on topographic level without considering possible micro-topographic effects. It is known that micro-topographic assembly creates specific landform features within the broader topography in order to provide and enhance topographic diversity and relief. These fine-scale landform features (e.g. mounds, ridges, knobs, knolls, bowls, scarps, banks, rock piles, and rock outcrops) do not significantly alter the global topography, but add relief to what otherwise could be a rather sterile landscape having uniform slopes and surfaces.
Since hillslope soils are affected by the impacts of wildfires (Dlapa et al., 2013; Pereira et al., 2014; Dlapa et al., 2015, Tessler et al., 2015), mainly by erosion, rates, and general heat impact on the soil (Novara et al., 2013; Keesstra et al., 2014; Hedo et al., 2015; Pereira et al., 2015). Moreover, the ash and top-soil in a post-fire environment are exposed to changes introduced by the rainfall and wind (two main erosion factors). Recent study (Cerdà et al., 2016) showed that immediately after the wildfires the soil erosion is negligible due to the ash cover, which acted as mulch, meanwhile after few months (1 year after the fire) the highest soil losses were measured. After 5 years the The International Archives of the Photogrammetry, Remote Sensing and Spatial Information Sciences, Volume XLII-1/W1, 2017
soil losses had reduced significantly and after 16 years were negligible. These results were obtained by portable rainfall simulation (operated at 55 mm h-1 during one hour) over 12 selected research sites at the study area of the Massís del Caroig, Eastern Spain (Cerdà et al., 2016). However, alternative studies showed the importance of monitoring the short-term effects immediately after the fire event. Vega (et al., 2014) proved that concentrated precipitation accumulated in one or two consecutive days and antecedent soil moisture were the variables most strongly associated with soil losses and related sediment yield in the untreated burned and seeded soils. The spatial analysis of fire patterns allows us to identify the factors driving trends and interactions in the spatial/temporal distribution and determine the observation scales of possible spatial relationships. The methods for modeling local processes, specifically on slopes, have been used in the context of wildfires (Genton et al., 2006; Serra et al., 2014), but the spatial and temporal data have been studied separately or aggregated. This approach does not support an understanding of spatio-temporal interaction and mechanisms (Lloyd et al., 2007; Gabriel and Diggle, 2009; Gabriel et al., 2016). The spatio-temporal structure of the distribution of wildfires is very complex as it dependence cannot be separated in space and time (Møller and Diaz-Avalos, 2010; Juan et al., 2012; Pereira et al., 2013; Serra et al., 2014). However, the post fire surface conditions can be easily monitored in space and time and contribute a variable information on spatial relationships, environmental mechanisms and spatio-temporal interactions.
However, for logistical reasons, only few studies have been able to examine the responses of burnt terrain immediately after burning. Therefore, little is known about the effect of the top-ash layer covers the soil before it is redistributed by wind or water erosions. In this study the morphological and textural variations of burned area (mainly at wildland urban interface) associated with soil erosion at micro-topographical scale right after is investigated. For this purpose we developed a multi-scale/multi-source approach integrating satellite-, airborne- (UAV platform) and field- remote sensing data with terrestrial survey and micro-topography data in the fire-affected area.
The multi-scale nature of existing approaches is limited to the upscaling of a single modelling tool, operational at a high spatial and temporal resolution, to small-scale maps. A new approach is designed when environmental descriptive methods designed for operating at a specific spatial and temporal resolution are integrated into the suggested scheme. The objective of this study is to identify surface features related to urban forests were lost and 175 residential buildings and public structures destroyed.
The city of Haifa located on the northern part of Mount Carmel in the north-western part of Israel. Haifa’s residential neighbourhoods are spread from the north Carmel mountain plateau and then expanded to the steeper slopes.
The Carmel Ridge rises to 480 m above the Mediterranean Sea. Geographic coordinates: 32° 48' 56" N, 34° 59' 21" E. Mt.
Carmel geo-position near the Mediterranean Sea, landscapes diversity, complex geomorphology and heterogenic lithology support a rich and diverse flora. The valleys between the residential areas were preserving as open green patch, with dense vegetation combined of pine planted forest and indigence Mediterranean sclerophyll, evergreen shrubs.
2.2 Data collection and pre-processing
The proposed method is using the following inputs collected before the fire event: aerial photography corrected orthophoto, Landsat OLS8 multispectral reflective and thermal bands, Sentinel 2 and 3 multispectral reflective bands, and finally the Advanced Space-borne Thermal Emission and Reflection Radiometer (ASTER) Global Digital Elevation Model Version 2 (GDEM V2).
The multispectral reflective and thermal data are subjected to the following preprocessing stages: radiometric and geometric corrections, atmospheric compensation/correction, and pan-sharpening methods. The Landsat OLS8 multispectral reflective and thermal data were corrected radiometrically and geometrically applying the metadata file (MTL) calculating top of atmosphere (TOA) radiance flux and further atmospherically corrected by the Atmospheric/Topographic Correction (ATCOR3) model providing surface reflectance, emissivity and surface temperature. The multispectral surface reflectance data were further processing using the Gram-Schmidt pan-sharpen, known as a maximizing sharpness and colour distortion approach, obtained by forward and backward transformation. Another complication is the lack of a clear recipe of how to compute the sensor dependent MS to Pan weights that are needed to compute the simulated low resolution pan band (Maurer, 2013).
The Sentinel 2/3 multispectral reflective data were processed using Sentinel 2 and 3 ESA toolbox including pan-sharpening performed by the joint Generalized Laplacian Pyramid (GLP) with MTF-matched filter and regression based injection model (MTF-GLP-CBD) method suggested by Vaiopoulos and Karantzalos (2016).
Once the decision was made to use an unmanned aerial vehicle (UAV) to collect data, the conditions and constraints of UAV operations were reviewed to determine that it was possible to use a UAV for the reconnaissance project. The relevant limitations included: weather conditions, traffic & regulations, and mobilization. The first step at each site was to paint Ground Control Points (GCP); they were distributed across the site. The GCPs were surveyed at a later date by high accuracy positioning survey methods. The GCP markings were painted throughout the site with at least five points per site and each point in at least three images.
A spreadsheet was developed to determine the required grid spacing to achieve a 80% overlap based on the altitude of the UAV and the camera sensors. Once a grid was created the flight was completed to capture vertical (or nadir) images at each grid intersection. After the initial assessment, the images that were collected for the purpose to create a 3D model were processed using aerial photogrammetry software Pix4D (www.pix4d.com). This software processes aerial images and creates a 3D model including a point cloud, mesh, and orthomosaic. By using computer vision techniques the software can identify and match thousands of common pixels in overlapping images.
Then by utilizing image processing algorithms it extracts the geometry of the camera positions and consequently can generate 3D models and orthorectified maps. The spatial accuracy of the model increased with the use of GCPs. The resulting models provided some added value in the design phase. The high resolution images provided an aerial perspective of the site that is not possible through traditional methods and provides a new perspective versus traditional topographic ground surveys. The orthomosaics that were created from the images were used as to enhance the topographic survey of the slope after fire event. A fully detailed topographic survey was not conducted at this site due to its limitations in detail. Additionally, this site is unstable in some locations and debris limited the ground access for the topographic survey.
2.3 Data processing
The final products of the processed orthophoto are: 1. map
of
dense and sparse vegetation calculated by the ChNRGB index (Ali et al., 2013), and 2. map of land use/land cover managed in eCognition Definiens® software using geographic object-based image analysis (GEOBIA) and decision trees on RGB orthophotos to map water, gravel bars and vegetation classes with an object-oriented classification approach.Vegetation dryness index (VDI) was calculated using surface reflectance data of Landsat OLS8 and Sentinel 2 multispectral bands and improved temperature VDI (iTVDI) proposed by Rahimzadeh-Bajgiran (Rahimzadeh-Bajgiran et al., 2012). After the fire event these sensors supply the data for calculating the normalized burn ratio index (NBR) generated as normalized difference of NBR value before and after the event (dNBR) suggested by Eidenshink (Eidenshink et al., 2002) and further developed into relativized burn ratio (RBR) by Parks (Parks et al., 2014) to evaluate the ability of these indices to characterize burn severity in terms of its correspondence to a continuous field-based measure of burn severity and its overall accuracy when classifying into discrete burn severity classes.
ASTER based GDEM is providing the hydrological products of flow direction, accumulation, drop raster and focal flow within the basin spatial units. These products are calculated in ArcGIS Spatial Analyst toolbox. The products are very general and performed on a global scale of maximum sub-basin unit.
The Munsell color space can be used to precisely describe ash
and top-soil (O and A horizons) colours by defining perceptual color represented by hue, value and chrome (HVC). These parameters are not quantitative measure of light across the visible range and thus, are not standardized and uneven (Viscarra Rossel et al. 2006). Many studies suggested new more objective and more accurate methods based on optical techniques (Post et al. 1993; Viscarra Rossel et al. 2003; Konen et al. 2003; Viscarra Rossel et al. 2009). Among numerous color space transformation, the red green blue (RGB) to hue, saturation and value (HSV) conversion proposed by United States Geological Survey (USGS) for Munsell color space is a non-linear transformation, that separates the luminance factor from the chrominance information. The saturation parameter, which is equivalent to value or brightness of the color according to the Munsell color space, is calculated for each pixel independently expressing normalized difference between the minimum and maximum reflectance acquired by the RGB bands. These scores were further transformed to the Munsell value parameters applying linear transformation prior calculated at the laboratory conditions, which categorized it into 8 possible groups.
The detected clusters were supported by the laboratory analysis which established the correlation between estimated Munsell value of top-ash samples and the burning/heating temperature. The same method was applied on the image after estimating Munsell value at each pixel. Consequently, the burning temperatures could be reconstructed from the UAV image of a post-burn site based on the top-ash coverage.
The influence of the micro-topography covariate information is under investigation. By applying statistical and mathematical methods: 1. Surface Geodesic Pattern (SGP) matching textured 3-D deformable surfaces by converting the local variations of the surface into distinctive local textural contained in a geodesic neighbourhood, 2. Gabor Topography Wavelet (GTW) detecting textural features directly from the range data, 3. Gray-Level Co-occurrence Matrices (GLCM), 4. standard roughness parameters (amplitude and shape), e.g. average, maximum area peak height, minimum area valley depth and root mean square roughness calculated by auto-covariance function.
2.4 Multi-scale integrated model
Concerning the estimation of coefficients to describe the influence of micro-topography mapping, we refer to the
Landsat OLS8 (Multispectral original and pan-shaped images, thermal image) before and after the event (temporal res.)
Sentinel 2/3 (Multispectral pan-shaped image) before and after the event (temporal res.)
Aerial photography (Orthophoto before fire)
High resolution airborne imagery via drone (after fire) ASTER global DTM product
Figure 1. Flowchart of the multi-scale model
modelling where all surface features are jointly estimated in a log-Gaussian Cox processes LGCP (Møller et al., 1998) process model.
The proposed model approximates Bayesian inference scheme for the LGCP. First, it estimates the approximate marginal posterior of the parameters by Markov chain Monte Carlo (MCMC). Second, the marginal posterior of latent Gaussian variables is calculated. An approximate marginal posterior (AMP) distribution for the model parameters is suggested. This approach also obtains sample based joint posterior distribution, which enable to estimate nonlinear or joint posterior probability.
3. PRELIMINARY RESULTS
This section presents the preliminary results if this study. First the thematic results if Landsat OLS8 are reported.
32°49'N 35°03'E
32°46'N 34°57'E
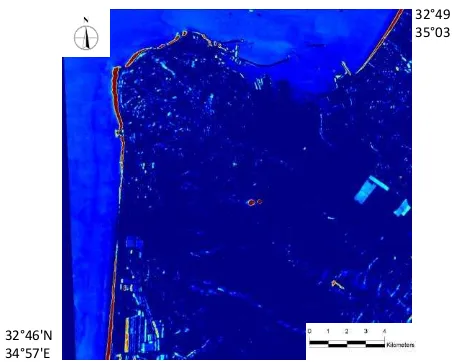
Figure 2. Change detection thematic map calculated by Landsat OLS8 multispectral pan-sharpen bands between day number
289 and day number 329 (during the fire event in Haifa)
32°46'N 34°57'E
32°49'N 35°03'E
Figure 3. Physical signal based change detection map calculated by Landsat OLS8 in blue no change in red the maximum change
32°49'N 35°03'E
32°46'N 34°57'E
Figure 4. VDI change detection map calculated by Landsat OLS8 multispectral pan-sharpen bands between day number 289 and day number 329 (during the fire event in Haifa) in blue
no change in red the maximum change
32°46'N 34°57'E
32°49'N 35°03'E
Figure 5. dNBR map calculated by Landsat OLS8 in blue no value in red the maximum index value of ongoing fire
15˚C 170˚C
32°46'N 34°57'E
32°49'N 35°03'E
Figure 6. Surface temperature calculated Landsat OLS8 thermal band
Figures 2 to 6 presented the results retrieved from Landsat OLS8 surface reflectance and thermal images. These products are limited in spatial and temporal resolutions, yet they provide spectral information an, thus, contribute great value to the suggested multi-scale model.
Next the preliminary result of the UAV imagery will be presented. These product are at fine spatial and temporal resolutions, but they are retrieved from RGB images, thus, they supports only limited spectral information.
Figure 7. Temporal orthomosaics data collected by UAV, left top corner 1 day after the fire event, right top corner 3 days after
the event, left bottom corner 1.5 weeks after the event, right bottom corner 2 weeks after the event
Figure 8. A 3-D point cloud retrieved from the imagery data collected by UAV and processed in Pix4D
200
˚C
640
˚C
Figure 9. Burning temperatures map reconstructed from the RGB images collected by UAV
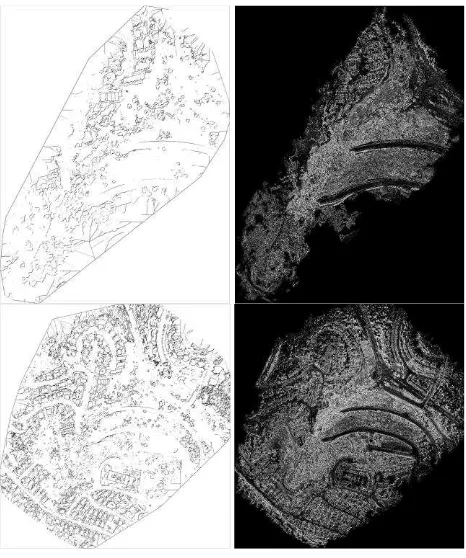
Figure 10. Micro-topography maps of the burned area calculated from the 3-D point cloud by the GLCM algorithms –
homogeneity products are presented in left top corner 1 day after the event, left bottom corner 3 days after the event; entropy
pruducts are presented in right corner respectivly The International Archives of the Photogrammetry, Remote Sensing and Spatial Information Sciences, Volume XLII-1/W1, 2017
In figure 10 one can learn that the top surface of the site after fire is homogenise, thus, present moderated entropy, probably due to presence of a top-ash layer in the scene. With time this effect becomes less influential, probably due to the erosion and surface runoff, and the scene tern to be less homogenise.
4. CONCLUSION
The suggested multi-scale model incorporating different post-fire environmental assessment tools and approaches illustrates the changing importance of the local and field scales. The increased spatial and the temporal resolution of the model succeed in revealing the post-fire properties affecting the hillslope susceptibility and its physical and morphological conditions.
Integration of the multi-resources information with a multi-scale model, characterised by scale-specific assessment tools and methods, proves successful to identify micro-topographical processes affecting the post-fire area at various scale in space and in time.
ACKNOWLEDGEMENTS (OPTIONAL)
This research was supported by Grant No 2014299 from the United States-Israel Binational Science Foundation (BSF).
REFERENCES
Alavalapati, J.R., Carter, D.R. and Newman, D.H., 2005. Wildland–urban interface: challenges and opportunities. Forest policy and Economics, 7(5), pp.705-708.
Ali, M.M., Al-Ani, A., Eamus, D. and Tan, D.K., 2013. An algorithm based on the RGB colour model to estimate plant chlorophyll and nitrogen contents. In 2013 International Conference on Sustainable Environment and Agriculture. International Association of Computer Science & Information Technology Press. frequency–high magnitude simulated rainfall events. Soil Research, 54(2), pp.154-165.
Dlapa, P., Bodí, M.B., Mataix-Solera, J., Cerdà, A. and Doerr, S.H., 2013. FT-IR spectroscopy reveals that ash water repellency is highly dependent on ash chemical composition. Catena, 108, pp.35-43.
Dlapa, P., Bodí, M.B., Mataix-Solera, J., Cerdà, A. and Doerr, S.H., 2015. Organic matter and wettability characteristics of wildfire ash from Mediterranean conifer forests. Catena, 135, pp.369-376.
Eidenshink, J., Schwind, B., Brewer, K., Zhu, Z.L., Quayle, B., Howard, S., 2002. A project for monitoring trends in burn severity. Fire Ecology, 3, pp. 3–21.
Gabriel, E. and Diggle, P.J., 2009. Second‐order analysis of inhomogeneous spatio‐temporal point process data. Statistica Neerlandica, 63(1), pp.43-51.
Gabriel, E., Opitz, T. and Bonneu, F., 2016. Detecting and modeling multi-scale space-time structures: the case of wildfire occurrences.
Genton, M.G., Butry, D.T., Gumpertz, M.L. and Prestemon, J.P., 2006. Spatio-temporal analysis of wildfire ignitions in the St Johns River water management district, Florida. International Journal of Wildland Fire, 15(1), pp.87-97.
Hedo, J., Lucas-Borja, M.E., Wic, C., Andrés-Abellán, M. and de Las Heras, J., 2015. Soil microbiological properties and enzymatic activities of long-term post-fire recovery in dry and semiarid Aleppo pine (Pinus halepensis M.) forest stands. Solid Earth, 6(1), p.243.
Juan, P., Mateu, J. and Saez, M., 2012. Pinpointing spatio-temporal interactions in wildfire patterns. Stochastic Environmental Research and Risk Assessment, 26(8), pp.1131-1150.
Keesstra, S.D., Maroulis, J., Argaman, E., Voogt, A. and Wittenberg, L., 2014. Effects of controlled fire on hydrology and erosion under simulated rainfall. Cuadernos de Investigación Geográfica, (40), pp.269-293.
Konen, M.E., Burras, C.L. and Sandor, J.A., 2003. Organic carbon, texture, and quantitative color measurement relationships for cultivated soils in north central Iowa. Soil Science Society of America Journal, 67(6), pp.1823-1830.
Lampin-Maillet, C., Jappiot, M., Long, M., Bouillon, C., Morge, D. and Ferrier, J.P., 2010. Mapping wildland-urban interfaces at large scales integrating housing density and vegetation aggregation for fire prevention in the South of France. Journal of Environmental Management, 91(3), pp.732-741.
Lloyd, J.D., Slater, G.L., Snow, S. and Snyder, J.R., 2007. Effects of fuel treatments and wildfire on the avifauna of the pine rockland ecosystem in southern Florida.
Maurer, T., 2013. How to pan-sharpen images using the Gram-Schmidt pan-sharpen method-a recipe. International Archives of the Photogrammetry, Remote Sensing and Spatial Information Sciences, 1, p.W1.
Moller, J.T., Cluitmans, P., Rasmussen, L.S., Houx, P., Rasmussen, H., Canet, J., Rabbitt, P., Jolles, J., Larsen, K., Hanning, C.D. and Langeron, O., 1998. Long-term postoperative cognitive dysfunction in the elderly: ISPOCD1 study. The Lancet, 351(9106), pp.857-861.
Moller, J., Diaz-Avalos C.A.R.L.O.S., 2010. Structured Spatio‐Temporal Shot‐Noise Cox Point Process Models, with a View to Modelling Forest Fires. Scandinavian Journal of Statistics, 37(1), pp.2-25.
Novara, A., Gristina, L., Rühl, J., Pasta, S., D'Angelo, G., La Mantia, T. and Pereira, P., 2013. Grassland fire effect on soil organic carbon reservoirs in a semiarid environment. Solid Earth, 4(2), p.381.
Pannkuk, C.D. and Robichaud, P.R., 2003. Effectiveness of needle cast at reducing erosion after forest fires. Water Resources Research, 39(12).
Parks, S.A., Miller, C., Nelson, C.R., Holden, Z.A., 2014. Previous fires moderate burn severity of subsequent wildland fires in two large western US wilderness areas. Ecosystems, 17, pp. 29–42.
Pereira, P., Pranskevicius, M., Cepanko, V., Vaitkute, D., Pundyte, N., Úbeda, X., Mataix-Solera, J., Cerdá, A. and Martin, D., 2013. Short-term vegetation recovery after a spring grassland fire in Lithuania. Effect of time and slope position. Flamma, 4, pp.13-17.
Pereira, P., Úbeda, X., Martin, D., Mataix‐Solera, J., Cerdà, A. and Burguet, M., 2014. Wildfire effects on extractable elements in ash from a Pinus pinaster forest in Portugal. Hydrological Processes, 28(11), pp.3681-3690.
Pereira, P., Cerdà, A., Úbeda, X., Mataix‐Solera, J., Arcenegui, V. and Zavala, L.M., 2015. Modelling the impacts of wildfire on ash thickness in a short‐term period. Land Degradation & Development, 26(2), pp.180-192.
Post, D.F., Bryant, R.B., Batchily, A.K., Huete, A.R., Levine, S.J., Mays, M.D. and Escadafal, R., 1993. Correlations between field and laboratory measurements of soil color. Soil color, (soilcolor), pp.35-49.
Rossel, R.V., Walvoort, D.J.J., McBratney, A.B., Janik, L.J. and Skjemstad, J.O., 2006. Visible, near infrared, mid infrared or combined diffuse reflectance spectroscopy for simultaneous assessment of various soil properties. Geoderma, 131(1), pp.59-75.
Rossel, R.V., Walter, C., Fouad, Y., Stafford, J. and Werner, A., 2003. Assessment of two reflectance techniques for the quantification of the within-field spatial variability of soil organic carbon. Precision agriculture, pp.697-703.
Rossel, R.V., Cattle, S.R., Ortega, A. and Fouad, Y., 2009. In situ measurements of soil colour, mineral composition and clay content by vis–NIR spectroscopy. Geoderma, 150(3), pp.253-266.
Serra, L., Saez, M., Mateu, J., Varga, D., Juan, P., Díaz-Ávalos, C. and Rue, H., 2014. Spatio-temporal log-Gaussian Cox processes for modelling wildfire occurrence: the case of Catalonia, 1994–2008. Environmental and ecological statistics, 21(3), pp.531-563.
Shakesby, R.A. and Doerr, S.H., 2006. Wildfire as a hydrological and geomorphological agent. Earth-Science Reviews, 74(3), pp.269-307.
Tessler, N., Sapir, Y., Wittenberg, L. and Greenbaum, N., 2015. Recovery of Mediterranean vegetation after recurrent forest fires: insight from the 2010 forest fire on Mount Carmel, Israel. Land Degradation & Development.
Vaiopoulos, A.D. and Karantzalos, K., 2016. Pansharpening on the Narrow Vnir and SWIR Spectral Bands of SENTINEL-2. ISPRS-International Archives of the Photogrammetry, Remote Sensing and Spatial Information Sciences, pp.723-730.
Vega, J.A., Fernández, C., Fonturbel, T., González-Prieto, S. and Jiménez, E., 2014. Testing the effects of straw mulching and herb seeding on soil erosion after fire in a gorse shrubland. Geoderma, 223, pp.79-87.