REMOTE SENSING APPLICATION OF THE GEOPHYSICAL CHANGES IN THE
COASTLINES AND RIVERS OF ZAMBALES, PHILIPPINES
Annie Melinda Paz-Alberto, Melissa Joy M. Sison, Edmark Pablo Bulaong and Marietta A. Pakaigue
Institute for Climate Change and Environmental Management, Central Luzon State University, Science City of Muñoz, Nueva Ecija, 3120 Philippines, Email: [email protected]; [email protected]; [email protected]; [email protected]
KEY WORDS: Remote Sensing, Accretion, Erosion, Geophysical changes, Lahar
ABSTRACT:
Geophysical changes in river outlet, river upstream and coastlines near the rivers of Bucao and Santo Tomas in Zambales, Philippines were analyzed using the Google Earth’s historical satellite imageries from 2004 to 2013. Data in 2015 were gathered from in situ field measurements ground validation. The study aimed to measure and determine changes in the width of river outlet, width of river bank upstream and shifting of coastline.
Results revealed that there was a decrease and increase in the width size of the Bucao and Santo Tomas river outlets, respectively during the study period. Geophysical changes occurred in the two rivers due to the continuous supply of lahar as an after effect of the Mount Pinatubo eruption in 1991. Coastline positions near the two rivers also changed. The highest rate of erosion along the coastal area was prevalently observed near the river outlet of both rivers. Moreover, accretion was observed in the coastline of Santo Tomas and erosion phenomenon was observed in the North and South coastlines of Bucao River. The shifting was caused by natural processes such as erosion, sedimentation and natural calamities as well as anthropogenic processes such as reclamation/quarrying. Occurrence of erosion and sedimentation played active roles in the changes of coastlines during the study period.
Furthermore, the upstream of the Bucao river changed physically due to deposits of lahar present in the upstream which are being discharged directly and continuously going down to the river. Generally, the width of the Bucao River upstream decreased its size because of the accumulated sediment in the riverbank. On the other hand, the observed erosion is caused by high velocity of river during heavy rains and typhoons. The width of the Santo Tomas river bank upstream did not change due to the construction of concrete dikes which prevent the lahar-filled river from breaching the embankment and flooding the agricultural, residential and commercial areas near the river.
*Corresponding Author – Email Add: [email protected]
INTRODUCTION
Remote sensing (RS) based approach is one of the most popular and promising methods for land use/land cover changes detection and can be adapted for mapping dynamic coastal activities and fluvial processes taking place in coastal areas such as coastal flooding, erosion/accretion, sedimentation, land subsidence, salt water intrusion, water pollution and cyclone hazards etc. (Mahmoud, 2011). Image analysis or extraction of meaningful information from Google Earth which displays satellite images of the exact same location is one way of detecting or analyzing numerous changes occurring in rivers and coastline environments. These changes are results of either natural or anthropogenic processes.
Coastal change is driven by processes that vary significantly in both space and time. Understanding how the coast has changed in the past and what factors have influenced those changes can guide our understanding of what may happen in the future.
Beach, shoreline and river evolution occur due to seasonal changes in summer/winter wave environments, earthquake, extreme storm events, changes in natural sand supply and transport, alongshore variations in coastal geomorphology and elevated water levels caused by long-term sea-level rise (Long and Plant, 2012).
Flooding is a major problem which causes distraction to the natural resources. River detection in satellite images is useful in
flood monitoring, tracing sedimentation along the river bank and tracking dry outs of the major rivers. Coastline detection is important for coastline zone monitoring, extraction and analysis of coastline changes which are caused by gradual washing out of sand or by abrupt natural calamity (Dandawate and Kinlekar, 2013). The occurrence of extreme water levels along low-lying, highly populated and/or developed coastlines can lead to considerable loss of life and billions of dollars of damage to coastal infrastructure. Therefore, it is vitally important that the exceedance probabilities of extreme water levels are accurately evaluated to inform risk-based flood management, engineering and future land-use planning (Haigh et al., 2013).
In this study, the detection of changes in river outlet, river bank and coastlines of rivers of Bucao and Santo Tomas rivers in Zambales through image analysis using remote sensing from the Google Earth was used.
OBJECTIVES OF THE STUDY
This study aimed to determine the geophysical changes of the river outlet, upstream and coastline in Bucao and Santo Tomas rivers in Zambales.
The study specifically aimed to:
a.Detect and analyze the geophysical changes in the river outlet, upstream and coastline through satellite imagery and;
b.Determine the causes of geophysical changes in the river outlet, upstream and coastline.
MATERIALS AND METHODS
Satellite images of the Google Earth from years 2004 to 2013 in Bucao and Santo Tomas rivers in Zambales were used in the analysis to identify changes because the Google Earth images have the clearest and the nearest satellite images to measure geophysical changes for the study areas in Zambales, Philippines. Clear images of the river outlet, coastlines and upstream of the different rivers of the selected watersheds were analyzed quantitatively. Moreover, the actual measurements of the river outlets, coastlines and river bank upstream of the said rivers were gathered in 2015. The methodology used in gathering data in different study sites such as river outlet, coastline and river bank upstream of the watersheds are as follows:
River Outlet
The distances of the river outlet for years 2004 to 2013 were measured. Only clear images on the historical views of the Google Earth were analyzed. Gathered data were compared from 2004 to 2013, where in 2004 is the basis of comparison. On the other hand, the actual distance of the river outlet was measured on July 2015 by the LiDAR1 researchers using South Total Station (NTS-362R6L).
Coastline
Data were gathered from both left and right coastlines of the rivers. The coastline in the year 2004 was the basis of the measurement. Coastlines images for the years 2004 to 2013 were gathered from the Google Earth images and were measured every 500 meters from the coastline near the outlet of the river up to the coastline of the nearby river. Coordinates of every sampling points in the year 2013 (latest Google Earth images) were recorded for field validation.
On the other hand, the actual data for the year 2015 were also gathered using South Total Station (NTS-362R6L). Images were analyzed if the changes were moving seaward or landward. Only clear images from the Google Earth were used in gathering coastline data.
River Bank
The width of the river bank was measured every 500m from the outlet of the river to upstream. Data were gathered using only the clear historical views of the Google Earth for the years 2004 to 2013, respectively. Sampling points in the year 2013 were also recorded for field validation. River bank data for the year 2015 were also gathered on July 2015 using Total Station. Only safe areas were considered in gathering data. The differences among the measurements in every reference point were noted.
Root Mean Square Error (RMSE) Computation
RMSE measures how much error there is between two datasets, usually compares a predicted value and an observed value. In this study, coordinates gathered during the field validation were plotted in Google Earth and measured to compare with the validated measurement. RMSE takes the difference for each Google Earth Measurements (predicted value) and Field Validated Measurements (observed value) and the results squared to have a positive value. Then divide the sum of all values by the number of observations, which is then be square-rooted to have the Root Mean Square Error. Below is the formula used for RMSE:
where xp = predicted value xo = observed value N = number of sample
Community Survey on Coastline and River Changes of the Bucao and Santo Tomas River
A questionnaire regarding river and coastal changes was constructed specifically to determine the natural features present in the area. Random sampling was used to select respondents near the river and in the coastal area. Target population was set according to the limited time available and to the required information needed to describe the historical changes as known to the residents in the area.
The survey was set on June 9-11, 2015 in Botolan and San Narciso, Zambales, Philippines. Eighty-eight (88) residents residing near the river and in the coastal area of the river were interviewed. A total of 40 persons per day were interviewed by 2 researchers having successfully conducted the survey. With the time allowed for conducting the survey, the target population was at least 30% in each town of Zambales (Botolan and San Narciso). Problems encountered were the long interval of houses in the coastal area and the rainfall occurrence every afternoon which slowed down the work of the researchers. Further Details and Process Flow of the study are presented in Figure 1.
Figure 1. Process flow of the study
RESULTS AND DISCUSSION
Bucao Watershed
Bucao Watershed is considered as the largest watershed in Zambales and one of the most important watersheds in the municipality of Botolan, Zambales as it is the source of water for Bucao River supporting the major irrigation system of the municipality. It is located in the provinces of Zambales and Tarlac and covers a total land area of more or less 68,145.77 ha. The watershed originates in the Eastern portion of Zambales mountain range which included Mt. Pinatubo, Mt. Gatas, Mt. Cahapatan, Mt. Iba and Mt. Mangkirat going down to the West and finally exits down to the outlet of South China Sea (DENR, 2008).
Bucao River Outlet
Geophysical changes were measured, detected and analyzed for the width of outlet and upstream of the Bucao river. Generally, the Bucao River outlet and upstream changed geophysically due to its setting where discharged from Mount Pinatubo directly flows down to the river. Results indicated that extreme velocity of water with sediment flows from Mount Pinatubo really affected the geophysical surrounding of the river.
Figure 2 presents the measurement of the width of Bucao river oulet from 2004 to 2015. The data from 2004 to 2013 were gathered from the Google Earth Satellite imagery while data in 2015 were the actual validated data gathered by the LIDAR-1 Figure 2. Bucao River Outlet
Accretion of Bucao river outlet in year 2006 and 2015 could be due to the Pinatubo discharged accumulated in the rivebank. Moreover, the accumulated sediments in year 2006 were rapidly washed-out in year 2012. Inconsistent changes of Bucao river outlet is possibly due to the Pinatubo lahars triggered by intense rainfall (Rodolfo et. al., 1999) and extreme velocity of water and current brought by typhoons. Siringan and Ringor (1995) stated that the Bucao river outlet experienced progradation after eruption but rapid retreats also occurred. Physical changes of the Bucao river outlet is due to the continous supply of sediment caused by the after effect of 1991 Mount Pinatubo eruption.
The sediment transported to the sea from the river, which is controlled by the land-ocean interaction, causes the evolution of the river outlet. The factors result in the outlet changes includes
the river sand transport rate, wave condition, tidal current and the deflection force caused by the earth’s rotation. The fundamental cause of the silting topography is attributed to the suspended sediment diffusion and the sand transport at the different site of the river outlet. Thus, the silting process always centers on the sand spits of the river outlet and gradually expanding to each side (Li and Chen, 2003).
The Bucao River, which was also dubbed by the residents as the “Bucao lahar”, was totally covered by sand. The presence of water was observed in the river especially during rainfall accumulating with the same level with lahar which resulted to quicksand effect.
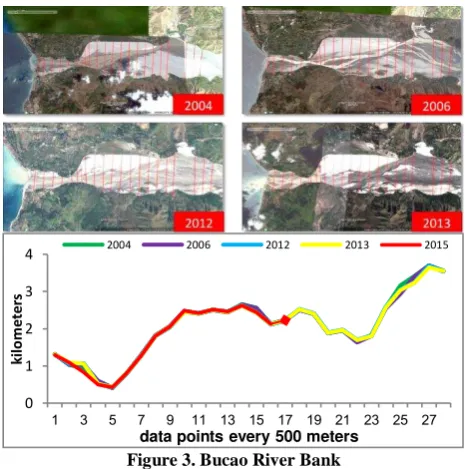
Bucao River Bank
Figure 3 presents the width of the Bucao river bank from 2004 to 2015. The data from 2004 to 2013 were also gathered from the Google Earth satellite images while data in 2015 was the validated data. In general, the measurement of each point decreases. This can be due to the transported sediments from Mount Pinatubo stored in the riverbank (Siringan and Ringor, 1996). According to PHIVOLCS about 5% to 15% of 229 million cubic meters (actual volume of 1992 lahar deposits) of lahar were still remained upstream and moved downstream during heavy rains.
Figure 3. Bucao River Bank
The 1991 Mount Pinatubo eruption deposited 5 to 6 km3 of pyroclastic materials on the slopes of the volcano (Scott et. al., 1993). In Zambales, the principal channels affected by lahars were those that tap the new pyroclastic-flow deposits. The Bucao river system drains the west and northwest sector of Mount Pinatubo (Rodolfo et. al., 1999). After eruption, heavy damaged was caused by ash fall which destroys everything: people and animals, farm and forestlands, public infrastructure, natural waterways houses and other facilities (Mercado et. al., 1999).
It is noticeable that the width of the river measured for up to 3500m. Concerned residents of Botolan claimed that the width of the river before was almost half of the width of the respective years analyzed. Moreover, the width of Bucao river increases and also decreases although the other side of the river bank was provided with dike. At present, there are parts of Bucao river provided with dike while some parts were eventually destroyed. These parts of the of the river without dike accumulated sediments from the discharged of Mount Pinatubo during heavy
1334
rains. However, extreme velocity of water flows downstream from Mount Pinatubo washed away the deposited sand in the riverbank which resulted to erosion and caused the width to increase.
Field validation was also conducted in the 17 samplings points. The result showed minor errors in terms of the measurement of its width from the Google Earth Images. The errors were due to the shade or canopy of the trees near the riverbank. The upper part of the river were not validated due to high river depth and dense grass and tree vegetation. However, results showed no major changes in some points while some other points decreased its width because of the lahar deposits observed in the particular area.
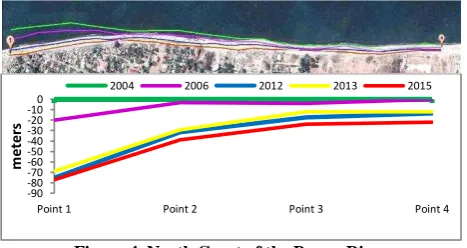
North Coast of Bucao River
Figure 4 presents the measurement of the North coastline from 2004 to 2015. Four points were analyzed in the north coast of Bucao river. Only negative values were observed in every point which indicates erosion.
Figure 4. North Coast of the Bucao River
The highest rates of erosion are typically located near the Bucao river outlet. Erosion near the Bucao river outlet can be due to the natural variation in the supply of sand from the river to a coastline (IPCC, 2004) and high waves brought by typhoons that cause the beaches to move landward. Siringan and Ringor (1996) also noted the continuous coastal changes around the Bucao River after Mt. Pinatubo eruption. Additionally, the nearby communities also observed that the beaches were eroding due to acute erosion which is caused by a sudden event, such as storm. The coordinates of the points analyzed in the coastline of years 2004 and 2013 (Google earth images) and their distances were recorded and validated. The distance of the current coastline (2015) and the coastline in year 2004 were also measured. Results showed continuous coastal erosion in the North coast of the river. Some residents near the coast evacuated the area because of the disturbing waves and winds that severely damaged their houses and properties.
Coastline changes induced by erosion and accretion are natural processes that take place over a range of time scales. Coastlines are naturally dynamic. Cycles of erosion are often an important feature of their ecological character. Wind, waves and currents are natural forces that easily move the unconsolidated sand and soils in the coastal area which results in rapid changes in the position of the coastlines (Prasetya, 2007).
South Coast of Bucao River
The result of the coastline analysis revealed that from 2004 up to 2015 the coastline of the study area has considerably changed. Negative and positive values were observed in coastlines analyzed showing that both erosion and accretion occur. The coastal erosion was prevalently observed on the point near Bucao
river outlet while accretion and erosion were both identified on the middle up to the last part of the corresponding points analyzed. The result of validation showed rapid coastal erosion in the study area. High waves and strong winds resulted to rapid erosion, steep coasts and damaged the houses and properties which occur in the study area. Coastal residents also observed that waves during storms reached up to 3 meters high but the winds did much more damages than waves.
Figure 5. South Coast of Bucao River
Beaches are temporary features. There is sand being removed and sand being added. The beach changed significantly depending upon the frequency of storms. Ultimately, beach erodes because the supply of sand to the beach cannot keep up with the loss of sand (Rubin, 2000).The Philippines hit by several typhoons every year. Unstable changes on the coastlines can be likely resulting from these typhoons that contain high winds and create large waves that raise water levels as much as 7 meters above normal (Watson, 2008).
Root Mean Square Error
RMSE computed in Bucao River Watershed outlet, river bank and coastlines show minimal differences between the measured data during the field validation and the measured data plotted in the Google Earth. The RMS Error computed for the river outlet is 1.0 meter, while for the river bank is 2.076 meters. However, 1.29 meter is the computed RMSE for the south coast and 1.322 meter for the north coast. These findings revealed that Google Earth historical high resolution imageries provide positional accuracies which can be used for small scale data sets. According to Mohammed et al., (2013), Google Earth represents a powerful and attractive source of positional data that can be used for investigation and preliminary studies with suitable accuracy and low cost.
Natural Disasters in the Coastal Area of Bucao River
Calamities were experienced in Bucao River. The respondents said that Typhoon Yunya in 1991 which happened at the same time with the Mt. Pinatubo eruption augmented the disaster in the area. Earthquakes which were felt in some parts in the up-hills, landslide which occurred alongside the river, drying of river in rare areas and floods in the urban areas usually in the market were the calamities often experience in the area that cause the river to change. Only quarrying was observed to be the human activity that may affect/ damage the river. The river which was sandy and rocky was converted to lahar sediments. The river outlet changes which were observed by residents include broadened river outlet, enlarged river outlet and Dry River because of the embankment of lahar. Shore and coast were almost with the same level as the terrain.
-90
Point 1 Point 2 Point 3 Point 4
m
Point 1 Point 2 Point 3 Point 4 Point 5 Point 6 Point 7 Point 8 Point 9
m
e
te
rs
The characteristic of the sand in the coastal area is coarse. Mostly, the coast was observed as narrow and steep. The residents described the ocean waves as calm and mild and presence of strong winds most of the time. During storms, the waves reached 3 meters high but the residents observed that the winds did much more damage than ocean waves. Coastal residents considered that ocean waves and lahar cause erosion in the coastal areas.
Santo Tomas Watershed
Santo Tomas Watershed is located in the southern part of the province of Zambales. Bounded on the North by municipalities of Botolan and San Felipe; on the South by municipalities of Subic, Castillejos and San Marcelino: on the West by South China Sea/Philippine Sea: and on the East by Mount Dutdut bordering the province of Pampanga (DENR, 2008).
Slope of Santo Tomas watershed is flat to moderately rolling to relatively steep. Elevation ranges from 20 meters to 1,700 meters above sea level. The steep slope or 18-30% is found within some parts Botolan, San Marcelino eastern portions, Castillejos and Subic. The terrain of San Felipe and San Narciso is generally flat with a slope of 0-10%.
The Santo Tomas Watershed was heavily devastated by the eruption of Mount Pinatubo on June 1991 and with the operation of the Benguet Consolidated Incorporation-Dizon-Copper Operation (BCI-DCO). According to DENR (2008) the recent eruption of Mount Pinatubo covered most area with sand and the erosion condition is moderate to severe. This was also as observed by the residents near the area.
Santo Tomas River Outlet
From 2004 to 2014 there was an increase in the size of Santo Tomas river outlet (Figure 6). Siringan and Ringor (1996) stated that the outlet of the river in various years differ due to the 1991 Mt. Pinatubo eruption which resulted in immediate, extensive, and rapid rates of coastal progradation in the river outlet and nearby coastal area.
Figure 6. Santo Tomas River Outlet captured using Google Earth
The lobe of the outlet of the river affect the changes of the riverbank specifically in the latter part of the river, it was reported that an increase in precipitation in the 60’s increased the
river’s discharge, which could have elevated the sediment yield leading to the outlet buildup (Siringan and Ringor 1996).
The river is reportedly heavily silted. Sources of pollution include wastewater, storm water runoff, and erosion. From the results of water quality monitoring, the elevated levels in oil and grease concentrations found in water samples are attributed to direct discharges from domestic wastewater from nearby residences (DENR-EMB, 2005).
No water was visible in the river wherein the lahar deposit was with the same level as the water. When rains occur, the river is quickly flooded with water. Lahar deposits can also be observed in the river outlet and form to what as the residents called as natural formation of a coast or a sandspit as can be observed in Figure 7.
Figure 7. Santo Tomas River Outlet
Validated points and measurement of the river outlet showed a vast land formation called sandspit. Validated points recorded and obtained as of August 5, 2015 indicated an increase of diameter of the river outlet. Lahar deposits were observed inside and outside the river covering the entire area. Interviewed locals also identified the outlet to be gradually steep near the ocean and flat along the vast river area. The area may seem to be dry in hot season but when it rains the water surfaced quickly from the ground forming muddy water.
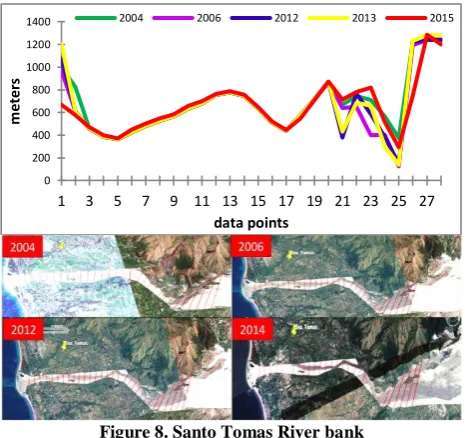
Santo Tomas River Bank
Figure 8 shows the measurement of diameter of the river bank starting from point 1 which is near the river up to point 28 in the upstream. The points near the river outlet have a constant increase in diameter, which may be due to continuous flow of lahar during heavy rainfall, although the validated point 1 in the year 2015 decreases in diameter. Sand from volcano’s eruptions in 1991 had caused siltation of Zambales river systems and flooding during storms (Philippine Daily Inquirer, 2011).
Points 3 to 20 are in constant measurement. It was observed that the riverbank was supported with dike, which already existed in the years 2004, 2006, 2012, 2013 and 2015. In the latter part of the graph, it was observed that the graph in each year was not aligned. It might due to unsupported dike that causes the riverbank to easily erode. The erosion perhaps caused by natural calamities especially by flowing of lahar and human impacts. The Philippine Daily Inquirer (2011) reported that Typhoon Pedring had caused to erode the portion of Santo Tomas River Mega dike, which helps to prevent the lahar-filled river from breaching the embankment and flooding agricultural, residential and commercial areas.
1168
1276 1387
1321 1335
1150 1200 1250 1300 1350 1400
2004 2006 2012 2014 2015
m
e
te
rs
Figure 8. Santo Tomas River bank
Validated data as of August 5, 2015 showed varying changes in the different data points of the river bank such as the dike starting from point 3 to point 20 wherein mitigation and development processes by the Government of Santo Tomas was being done. As much as the government officials want to facilitate the area, lahar flows and extensive heavy rains quickly erodes the area.
Sand is still flowing down the mountains 20 years after Mt. Pinatubo erupted in 1991. At least 6.5 billion cubic meters of sand fell into the Santo Tomas, Maloma and Bucao rivers (Philippine Daily Inquirer, 2011). Once the rains stop, sand spewed out by Mount Pinatubo that had silted waterways in Zambales. According to DENR (2008) mining was permitted in Santo Tomas River mostly for cleaning and washing away unnecessary sediments. Since sand from volcano’s eruption in 1991 had caused severe siltation of rivers and has often resulted in severe flooding in several towns and barangay (Philippine Daily Inquirer, 2011), Zambales officials export the sand to Singapore to supply sand for use in their reclamation and expansion projects.
North Coast of Santo Tomas River
Figure 9 shows the constant increase of measurement in each year across all points. The green line represents the baseline measurement of the coast. Almost all succeeding years (2006, 2012 and 2013) indicate seaward movement of the coastline. A great increase of change was observed in point 1 near the outlet of the river while a decreasing change was observed along the end.
Figure 9. North Coast of Santo Tomas
The coastline is undergoing constant changes from the effects of waves and currents, either resulting in the loss of land (erosion) or the accumulation of beach sediment (accretion). The amount of physical change that results generally depends on the degree of exposure and the predominant geology (Long and Plant, 2012). Also, houses were built in the coastal area, which might serve as the barrier wherein houses protect the coastal to maintain its coastline.
South Coast of Santo Tomas River
The coastline in the south side of Santo Tomas River shows a seaward movement. From the point near the outlet of the river, year 2004 obtained the lowest measurement compared to 2006, 2012, 2013and 2015. Sedimentation was considered to be the reason of the coastline changes, augmented by lahar flows added with heavy rainfall caused the beach system to deposit more sand moving seaward as can be observed in Figure 10.
Validated points in 2015 also showed an increase of measurement. Flat and vast formation of coast was observed especially near the river outlet and extends up to point 9. Residents also confirmed gentle waves but varying strength of winds which in turn cause a minor physical change to the coast which cannot outweigh the continuous flow of lahar deposits during rainfall.
Figure 10. South side of Santo Tomas Coastal Area
Urban runoff or surface runoff caused by heavy rainfall may deposit sediments of land or property in a built up environment especially when observed near bodies of water such as Santo Tomas River affecting both upstream and the river outlet. Urbanization and human activity within an urban system produces many destructive and irreversible effects on natural environment such as climate change, air pollution, sediment and soil erosion, increase flooding magnitude and loss of habitat (Fernandez, 2007). Once sensitive soil is disturbed, they may lower strengths when they are altered. This loss of strength increases the variability of structural change (Diagne, 2007).
As observed in the north coast, the south coast of Santo Tomas also portrays vast and flat coastal area. Gentle waves was also observed in the area and confirmed by the residents. Structures and residential houses were located afar from the coast wherein dry vast lands and hot conditions are present which may not be suitable for a comfortable living.
Root Mean Square Error
RMSE computed in Santo Tomas River Watershed river bank, south coast and north coasts were 1.069 meters, 1.264 meters and 0.745 meters, respectively. However, there is no difference (0
point 1 point 2 point 3 point 4 point 5
meter) on the computed RMSE in the river outlet. Hence, results showed that the Google Earth images used in the study have positional accuracy which can be used for small scale data sets. These findings corroborate with the studies of Mohammed et al. (2013) and Potere (2008), regarding the positional accuracy of Google Earth’s high resolution imageries.
Natural Disasters in the Coastal Area of Santo Tomas River
Calamities often experienced by the residents in the area were typhoons which caused strong winds that resulted to uprooting of trees and landslides in some parts mostly in the upper areas. Ocean waves during typhoon could reach 3 meters high as described by the residents, but most of the time the average height of the wave per year was less than 1 meter. The coastline near the river was steep and narrow while in the far side is wide and firmed. Due to construction of house/building, rising of sea level and Mt. Pinatubo eruption which resulted in immediate, extensive, and rapid rates of coastal progradation at and adjacent to river outlets (Siringan and Ringor, 1996).
Flooding was observed in urban areas mostly in the market place but quickly subsides after the rain. Quarrying affects the natural features of the river and adds to the effect of erosion. Landslides and soil erosion were observed by the residents in the upper areas alongside of the river which was reported by the respondents interviewed living in the area. Earthquakes were often experienced by the residents in the area but with minimal effect in the surrounding environment. The residents observed that the river and the river mouth were constantly changing and widened which in their opinion was due to lahar flow during heavy rains.
CONCLUSIONS
Bucao River outlet and Santo Tomas river outlet decreased and increased in width size respectively during the study period. River outlets of the two rivers contained lahar deposits that can easily be washed away by natural occurrences resulting to variation of change in the river outlet.
Coastline positions near the two rivers also changed. The highest rate of erosion along the coastal area of Bucao River was prevalently observed near the outlet. Erosion and accretion phenomenon were observed in the North coast and South coast of the Bucao River respectively. Moreover, accretion was observed in the North coast and South coast of the Santo Tomas River. Changes in the position of the coastlines is due to the wind, waves and currents that move the sand and soils in the coastal area and the natural variation in the supply of sand and lahar deposits exiting from the river to the coast. Generally, the coastline in Bucao is steep and narrow while the coastline of Santo Tomas is gradually flat and vastly wide.
Geophysical changes occurred in the two rivers due to the Moreover, most of the width of the Santo Tomas River bank did not change due to the presence of concrete dikes on both sides which prevent the lahar-filled river from breaching the embankment and minimize the flooding and erosion of agricultural, residential and commercial areas near the river.
ACKNOWLEDGMENT
Sincere gratitude to the Department of Science and Technology (DOST) for the financial support and to the Philippine Council for Industry, Energy Emerging Technology Research and Development (PCIEERD) for monitoring and procedure assistance in the implementation of the project.
References
Dandawate Y.H. and Kinlekar S., 2013. Rivers and Coastlines Detection in Multispectral Satellite Images Using Level Set Method and Modified Chan Vese Algorithm. Retrieved on April 30, 2015. Retrieved at
http://ieeexplore.ieee.org/xpl/articleDetails.jsp?re load=true&arnumber=6714135
Diagne, Khady., 2007. "Governance and natural disasters: addressing flooding in Saint Louis, Senegal", Environment and Urbanization, Vol. 19, No. 2 Dominic A., MD., Padua DM. and Manzan A., 2010. “Worst
Typhoons of the Philippines”, Joint Typhoon Warning Center (JTWC), Philippine Atmospheric Geophysical and Astronomical Services Administration (PAGASA), Japan Meteorological Agency (JMA), Unisys.com, Typhoon2000.com archives and records, National Disaster Coordinating Council (NDCC), Reliefweb.com. Fernandes, Edesio, 2007. "Implementing the urban reform
agenda in Brazil", Environment and Urbanization, Vol. 19, No. 1, pp. 177-189
Haigh I.D., Wijeratne E.M.S., MacPherson L.R., Pattiaratchi, C.B., Mathew M.S., Crompton, R.P and S. George., 2013. Estimating present day extreme water level exceedance probabilities around coastline of Australia: tides extra-tropical storm surges and man sea level. Springer-Verlag Berlin Heidelberg 2013. Clim Dyn (2014) 42:121-138. Long E., Joseph W., and Plant N., 2012. Extended Kalman
Filter framework for forecasting shoreline evolution: Geophysical Research Letters 39.13 Li F. and Chen X., 2003. Shoreline Changes of the Yellow
River Delta and its Sub-Delta Area Forecast. International Conference on Estuaries and Coasts. Mahmoud I., 2011. RS-based change detection of coastal
processes and elements at risk mappingin Sagar Island, West Bengal, India. Applied Earth Science Department. Disaster Geo-Information Management, Faculty of Geo-Information Sciences and Earth Observation, University of Twente. Retrieved on May 4, 2015. Retrieved at
http://www.academia.edu/2070297/RS-based_change_detection_of_coastal_processes_a nd_elements_at_risk_mapping_in_Sagar_Island_ West_Bengal_Indian
Mercado R., Lacsamana R., and Pineda G., 1993. Socioeconomic Impacts of the Mount Pinatubo Eruption National Economic and Development Authority, Region III, San Fernando, Pampanga, Philippines.
Mohammed N., Ghazia A., and Mustafa H., 2013. Positional Accuracy Testing of Google Earth. International Journal of Multidisciplinary Sciences and Engineering, Vol.4, No.6
Potere D., 2008. Horizontal Positional Accuracy of Google Earth’s High Resolution Imagery Archive. Retrieved from www.mdpi.com/journal/sensors on March 21, 2016.
Prasetya G., 2007. Thematic paper: The role of coastal forests and trees in protecting against coastal erosion. Regional Office for Asia and the Pacific.
Rodolfo K., Umbal, J., Alonso R., Remotigue, C., Melosantos M., Salvador J., 1999. Evangelista, D. and Miller, Y. Two Years of Lahars on the Western Flank of Mount Pinatubo: Initiation, Flow Processes, Deposits, and Attendant Geomorphic
and Hydraulic Changes.
Rubin K., 2000. Causes and effects of beach erosion. Department of Geology and Geophysics
University of Hawaii, Honolulu, HI 96822. Scott W.E., Hoblitt R.P., Torres R.C., Self S, Martinez M.L.,
and Nillos T., Jr., 1993. Pyroclastic flows of the June 15, 1991, climactic eruption of Mount Pinatubo.
Siringan F. and Ringor C., 1995. Changes in the position of the Zambales shoreline before and after the 1991 Mt. Pinatubo eruption.
Watson J.M., 2008. Coastal Focus: Montauk Lighthouse, New York. Retrieved at:
http://pubs.usgs.gov/circ/c1075/change.html Department of Environment and Natural Resources (DENR).,
2008. DAO No. 05 Series of 2008, Implementing Guidelines in the Preparation of Integrated Watershed Management Plan. DENR-EMB., 2005. DENR Administrative Order No.
2005-10: Implementing Rules and Regulations of the Philippine Clean Water Act of 2004 (RA 9275). National Statistics Office: Bataan Quickstat 2006, 2009, 2013
and 2015. Compiled by the DATABANK AND INFORMATION SERVICES DIVISION. E-mail: [email protected]