Plasma Adrenocorticotropin Responses to Opioid
Blockade with Naloxone: Generating A Dose–Response
Curve in a Single Session
Deborah Mangold, Mary Elizabeth McCaul, Mahmood Ali, and Gary Steven Wand
We examined two methods of generating a dose–response curve to the opioid receptor antagonist naloxone. In 15 healthy male subjects (18 –25 years) plasma adrenocorti-cotropin (ACTH) responses to five doses of naloxone studied over 5 separate days were compared to plasma ACTH responses to five incremental doses of naloxone studied within a single session. There was a statistically significant positive correlation in ACTH responses (area under the curve and peak) between dosing methods. Furthermore, the doses of naloxone that produced half-maximal and half-maximal ACTH response were similar. The comparability of ACTH responses between the two nalox-one dosing techniques, combined with the safety and ease associated with the single-session methodology, under-scores the usefulness of the single-session technique for future investigations. Biol Psychiatry 2000;48:310 –314
© 2000 Society of Biological Psychiatry
Key Words: Naloxone, opioid receptor blockade, adreno-corticotropin, neuroendocrine, dose–response curve, hormones
Introduction
S
tudies employing opioid antagonists have been useful in helping to elucidate the role of the opioid system in central nervous system (CNS) function. In theory, if an opioid antagonist increases a response, it implies that endogenous opioid activity is a negative modulator of the response. In contrast, if a given response is decreased following administration of an opioid antagonist, the implication is that endogenous opioid activity is a stimu-latory modulator of the response. Investigations with opioid antagonists have shown that CNS opioids impose tonic inhibition on the hypothalamic–pituitary– gonadal as well as the hypothalamic–pituitary–adrenal axes (Genaz-zani et al 1995; Inder et al 1995). Such studies have also suggested a role for the CNS opioid system in a number of neuropsychiatric disorders, including alcoholism (Wand etal 1998, 1999); autism (Campbell and Harris 1996); Gilles de la Tourette syndrome (Gillman and Sandyk 1985); obsessive-compulsive disorder (Keuler et al 1996); self-mutilation (Kars et al 1990; Lienemann and Walker 1989); trichotillomania (Carrion 1995); anorexia nervosa (Kaye et al 1987); and mood (Cohen et al 1983a, 1983b; Martin del Campo et al 1992, 1994). Moreover, antagonist studies have suggested that CNS opioids may help modulate learning and memory (Cohen et al 1983; Introini-Collison et al 1995; Izquierdo 1982; McGaugh et al 1986; Olson et al 1995).
Both single-dose and multiple-dose opioid antagonist studies have been conducted. Although information is gained by administering single doses of opioid antago-nists, generating a response curve to multiple doses of an antagonist provides additional insight into endogenous opioid activity. For example, a leftward shift in a dose– response curve to naloxone implies enhanced sensitivity to the opioid receptor antagonist reflecting either low endog-enous opioid activity or enhanced opioid receptor binding affinity (Wand et al 1998). This traditional dose–response method is conducted over several sessions, however, introducing unwanted variance as well as subject recruit-ment issues.
Our study explored the feasibility of generating an opioid antagonist dose–response curve within a single session. To date no study has compared in the same subject a dose–response curve conducted over separate sessions with a dose–response curve generated within a single session. In this study, adrenocorticotropin (ACTH) responses to five doses of naloxone generated within a single session are compared to responses generated over five separate sessions.
Methods and Materials
Men between the ages of 18 and 25 years were recruited by newspaper from the Baltimore area. Respondents gave informed consent to the Johns Hopkins University School of Medicine Internal Review Board approved protocol. Subjects completed medical history, physical examination, laboratory tests (complete blood cell counts, electrolytes, liver and renal function tests, and glucose) and underwent a semistructured diagnostic interview,
From The Johns Hopkins University School of Medicine, Baltimore, Maryland. Address reprint requests to Gary S. Wand, M.D., Professor of Medicine and
Psychiatry, The Johns Hopkins University School of Medicine, Ross Research Building, Room 863, 720 Rutland Avenue, Baltimore MD 21205. Received January 5, 2000; revised March 7, 2000; accepted March 16, 2000.
© 2000 Society of Biological Psychiatry 0006-3223/00/$20.00
administered by a Masters level psychologist to insure the absence of DSM-IV Axis I disorders (including alcohol/drug dependence and abuse). Subjects with medical conditions, DSM-IV Axis I diagnosis, abnormal liver functions, maternal alcohol dependence, or undergoing pharmacotherapy with pre-scription medications were excluded from enrollment.
Five-Session Protocol
Subjects reported for sessions at 12:30PMfasting since 9:00AM
breakfast. An intravenous catheter was inserted into a forearm vein at 1:00 PM. Subjects were supine for each of five separate naloxone dosing sessions (e.g., 0, 50, 125, 375, and 500mg/kg) separated by greater than 48-hour wash-out period. naloxone (dissolved in 0.9% saline) was randomized across the five sessions and administered double blind as a bolus. Blood for plasma ACTH was collected at215, 0,115,130,145,160, 190, and1120 min. Naloxone dose range included a submaxi-mal dose (Wand et al 1998).
Single-Session Protocol
At least 1 week following completion of the above protocol, subjects reported fasting for an additional session where an intravenous catheter was inserted into a forearm vein at 1:00PM. One hour later, placebo (0.9% saline) was administered as a bolus. Subsequently, every 30 minutes, incremental doses of naloxone (50, 100, 200, and 400mg/kg) dissolved in 0.9% saline were administered following the scheduled blood draw. Baseline blood samples were obtained 15 min before and immediately prior to placebo administration. Postplacebo blood samples were drawn every 15 min for 150 min.
Neuroendocrine Assays
Plasma concentrations of ACTH were assayed by a two-site IRMA (Nichols immunoradiometric assay). Intra-assay and in-terassay coefficients of variance are less than 9% (Waltman et al 1993; Wand et al 1999).
Statistical Analysis
Analyses were chosen to test the hypothesis that two different dosing methods used to generate a dose–response curve would result in a positive association in area under the plasma ACTH time curve and peak plasma ACTH response. Significance was evaluated at p , .05. All analyses were conducted with the Statistical Package for the Social Sciences. Mean ACTH re-sponse to opioid blockade during each of five individual dosing sessions was calculated and expressed as 1) area under the ACTH time curve (AUC) and 2) peak ACTH response. Repeated measures analyses of variance, with dose as the repeated measure and AUC or Peak as the dependent measure, was used to test the effects of dose on ACTH response across dosing sessions. Significant multivariate results were followed by contrast tests to examine 1) differences in ACTH response between placebo and each subsequent dose of naloxone; and 2) differences in ACTH response between ordinal doses (e.g., placebo vs. 50mg/kg, 50
vs. 125, etc.). Maximum ACTH response to naloxone was defined as the highest ACTH value following baseline per session. For the single session protocol, mean ACTH responses to naloxone were calculated across 12 time points. A repeated measures analysis of variance with time as the repeated measure and plasma ACTH as the dependent measure was used to determine the effect of time (corresponding to dose) on ACTH response. Significant multivariate results were followed by contrast tests to examine 1) differences in ACTH response between response at baseline (time point 0) and each subsequent dose of naloxone; and 2) differences in ACTH response between ordinal time points (e.g., 0 vs.115, 0 vs.130, etc.). A Pearson Product Moment correlation was used to examine the degree of association in ACTH response (expressed as AUC and Peak) between the two different methodologies.
Results
Figure 1A presents plasma ACTH across time, generated to five randomized doses of naloxone administered over 5 separate days. Figure 1B presents the data calculated as area under the ACTH time curve across dose. There was a significant within-subjects effect of dose [F(4) 5 9.77,
p 5 .001]. Adrenocorticotropin responses significantly differed from response at placebo at every naloxone dose: 50 [F(1)56.70, p5.021]; 125 [F(1)513.65, p5.002]; 375 [F(1)5 31.60, p5 .001]; 500 [F(1) 5 13.05, p5
.003]. Also, there was a significant increase in ACTH levels between the 125 and 375mg/kg dose [F(1)56.18,
p5 .026]. Maximal and half-maximal ACTH responses were observed at the 125 mg/kg and 375 mg/kg dose, respectively.
As shown in Figure 1C, there was a significant within-subjects effect of naloxone dose on peak ACTH response [F(4)5 8.05, p5 .001]. Peak ACTH response at doses 125 [F(1) 5 8.04, p 5 .013], 375 [F(1) 5 17.60, p 5
.001], and 500mg/kg [F(1)59.62, p5.008] significantly differed from response at placebo. Peak ACTH response significantly increased between the 125 mg/kg and 375mg/kg dose [F(1) 5 6.11, p 5 .027]. Maximal and half-maximal peak ACTH responses were observed at the 125mg/kg and 375mg/kg dose, respectively.
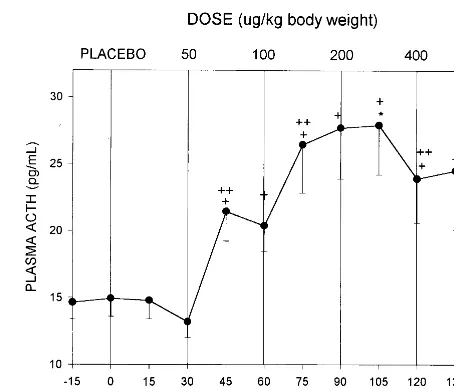
Figure 2 presents plasma ACTH response to five doses of naloxone generated within a single session. There was a significant within-subject effect for time [F(11)57.992,
p5 .001]. Plasma ACTH response at baseline (time 0) was significantly different than responses at the following time points:145 [F(1)512.17, p5.004];160 [F(1)5
11.04, p 5 .005]; 175 [F(1) 5 11.16, p 5 .005]; 190 [F(1)514.90, p5.002];1105 [F(1)515.71, p5.001],
1120 [F(1)5 9.32, p5.009], and1135 [F(1)55.47,
.001]. Similarly, there was a significant rise in ACTH response at time point 75 min relative to time point 60 min induced by the100mg/kg dose [F(1)5 6.40, p 5.024]. Half-maximal ACTH response was observed at time point 70 min following cumulative naloxone doses of 150
mg/kg. Maximal ACTH response was observed at time point 105 min following cumulative naloxone doses of 350mg/kg.
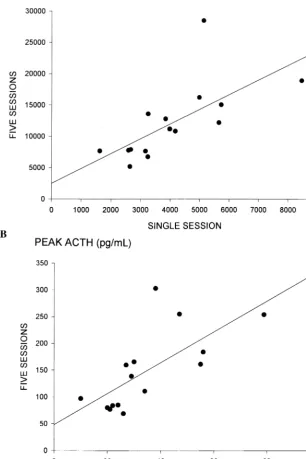
Figure 3 shows the relationship for each subject be-tween ACTH response using the two dosing methods. Plasma ACTH responses were highly correlated both calculated as area under the curve (r5 1.676, p5.006; Fig 3A) and peak ACTH (r5 1.698, p5.004; Fig 3B).
Discussion
In this study, we compared plasma ACTH response to five doses of naloxone generated within a single session to responses generated over five individual sessions. Our results show that the two techniques produce comparable findings. There was a strongly significant association in plasma ACTH response between the two methodologies. High ACTH responders to the five-session challenge were also high ACTH responders in the single-session chal-lenge; conversely, low ACTH responders to the five-session challenge were low ACTH responders in the single-session challenge. Moreover, nearly identical doses of naloxone were required to generate maximal as well as half-maximal ACTH responses using both techniques. Finally the shape of the dose–response curve was
compa-Figure 1. Plasma adrenocorticotropin (ACTH) responses to five doses of naloxone given over five sessions. (A) Mean6SEM plasma ACTH vs. time in response to five separate naloxone dosing sessions: placebo (hexagons), 50mg/kg (diamonds), 125
mg/kg (triangles), 375mg/kg (squares), and 500mg/kg (circles). (B) Area under the plasma ACTH time curve across five doses. (C) Peak plasma ACTH response across five doses. *Maximum plasma ACTH response. 1Significant contrast in ACTH re-sponse compared with placebo rere-sponse.11Significant contrast in ACTH response compared with response at preceding dose.
rable under both procedures, with diminishing ACTH response at the highest naloxone dose.
Much of the earlier research in this field has been limited by the use of difficult-to-interpret single-dose studies, in which small, inconsistent, or no effects are found (Keuler 1996; Michelson et al 1996) or by dose– response curves generated over multiple sessions. A single session procedure has many advantages over traditional single dose or multisession approaches. The procedure combines the informative nature of multiple dosing
tech-niques with absence of intersession variability provided by single-dose procedures. No longer is a lengthy time commitment required from subjects to complete repeated experimental sessions, which potentially jeopardizes en-rollment. It is easier to study female subjects in a single phase of the menstrual cycle and avoid phase-related fluctuations in hormonal response. Other sources of be-tween-session hormonal variance (e.g., alcohol/drug use, mood, stress, health, sleep) are eliminated. Finally, it introduces efficiency both for the investigator (e.g., cost,
recruitment, staff time, resources) and subject (e.g., ab-sence from school, work, family).
One caveat associated with this study is that we em-ployed somewhat different doses of naloxone for each method. Slightly lower doses for the single-session tech-nique were chosen to guard against the induction of side effects following cumulative doses. Although naloxone blood levels were not obtained, the correlation in ACTH responses between methods was quite good suggesting that comparable doses were selected. No subject reported side effects during either procedure. Heart rate, blood pressure, and respiratory rates were not altered by naloxone.
In summary, it is possible to safely and accurately generate a comprehensive dose–response curve to nalox-one within a single session. The abbreviated method will provide a useful adjunct in neuropsychoendocrine inves-tigations of the opioid system.
This work was supported by NIH grant RO1-AA10158 (GSW), The Alcohol Medical Research Foundation (GSW), and a generous gift from The Kenneth Lattman Foundation (GSW). The authors thank Endo Pharm for contributing naloxone hydrochloride for these studies.
References
Campbell M, Harris JC (1996): Resolved: Autistic children should have a trial of naltrexone. J Am Acad Child Adolesc
Psychiatry 35:246 –249.
Carrion VG (1995): Naltrexone for the treatment of trichotillo-mania: A case report. J Clin Psychopharmacol 15:444 – 445. Cohen MR, Cohen RM, Pickar D, Weingartner H, Murphy DL (1983): High-dose naloxone infusions in normals: Dose-dependent behavioral, hormonal and physiological responses.
Arch Gen Psychiatry 40:613– 619.
Genazzani AD, Gastaldi M, Petraglia F, Battaglia C, Surico N, Volpe A, et al (1995): Naltrexone administration modulates the neuroendocrine control of LH secretion in hypothalamic amenorrhea. Hum Reprod 10:2868 –2871.
Gillman MA, Sandyk R (1985): Tourette syndrome and the opioid system. Psychiatr Res 15:161–162.
Inder W, Joyce P, Ellis M, Evans M, Livesey J, Donald R (1995): The effects of alcoholism on the hypothalamic-pituitary-adrenal axis: Interaction with endogenous opioid peptides.
J Clin Endocrinol Metab 43:283–290.
Introini-Collison IB, Ford L, McGaugh JL (1995): Memory impairment induced by intraamygdal b-endorphin is medi-ated by noradrenergic influences. Neurobiol Learn Mem 63:200 –205.
Izquierdo I (1982): Beta-endorphin and forgetting. Trends
Phar-macol Sci 3:455– 457.
Kars H, Broekema W, Glaudemans-van-Gelderen I, Verhoeven WMA, Van Ree JM (1990): Naltrexone attenuates self-injurious behavior in mentally retarded subjects. Biol
Psychi-atry 27:741–746.
Kaye WH, Berrettini WH, Gwirtsman HE, Chretien M, Gold PW, George DT, et al (1987): Reduced cerebrospinal fluid levels of immunoreactive pro-opiomelanocortin related pep-tides (includingb-endorphin) in anorexia nervosa. Life Sci 41:2147–2155.
Keuler DJ, Altemus M, Michelson D, Greenberg B, Murphy DL (1996): Behavioral effects of naloxone infusion in obsessive-compulsive disorder. Biol Psychiatry 40:154 –156.
Lienemann J, Walker F (1989) Naltrexone for treatment of self-injury. Am J Psychiatry 146:639 – 640.
Martin del Campo AF, Dowson JH, Herbert J, Paykel ES (1994): Effects of naloxone on diurnal rhythms in mood and endo-crine function: A dose-response study in man.
Psychophar-macology 114:583–590.
Martin del Campo AF, McMurray F, Besser GM, Grossman A (1992): Effect of 12-hour infusion of naloxone on mood and cognition in normal male volunteers. Biol Psychiatry 32:344 – 353.
McGaugh JL, Introini-Collison IB, Juler RG, Izquierdeo I (1986): Striatal terminalis lesions attenuate the effects of postraining nalxone and b-endorphin on retention. Behav
Neurosci 100:839 – 844.
Michelson D, Altemus M, Galliven E, Hill L, Greenberg B, Gold P (1996): Naloxone-induced pituitary-adrenal activation does not differ in patients with depression, obsessive compulsive disorder and healthy controls. Neuropsychopharmacology 15:207–212.
Olson GA, Olson RD, Kastin AJ (1996): Endogenous opiates.
Peptides 17:1421–1466.
Waltman C, Blevins LS, Boyd G, Wand G (1993): Effects of mild ethanol intoxication on the HPA axis in nonalcohlic men. J Clin Endocrinol Metab 77:518 –522.
Wand GS, Mangold D, Ali M (1999): Adrenocorticotropin responses to naloxone in sons of alcohol dependent men.
J Clin Endocrinol Metab 84:64 – 68.