ANALYSIS
Pesticide taxation and multi-objective policy-making: farm
modelling to evaluate profit
/
environment trade-offs
Katherine Falconer
a,*, Ian Hodge
baCentre for Rural Economy,Department of Agricultural Economics and Food Marketing,Uni
6ersity of Newcastle upon Tyne, Newcastle upon Tyne,NE1 7RU,UK
bDepartment of Land Economy,Uni6ersity of Cambridge,Cambridge CB3 9EP,UK Received 24 August 1999; received in revised form 7 July 2000; accepted 7 July 2000
Abstract
Many countries in Western Europe have introduced voluntary programmes to encourage farmers to adopt environmentally more benign practices such as integrated pest management, but more policy action appears to be needed to meet the environmental quality levels now demanded. Input taxes could assist in meeting policy objectives. The issue considered here is the identification of the most appropriate specification of a tax instrument to reduce the environmental problems of agricultural pesticide usage. This paper takes a farm systems approach to evaluation. A case-study illustration is given for a specialist arable farm in the UK, combining an economic model of land use and production with a set of environmental indicators for pesticides. Linking these two components allows the identification of the potential trade-offs between achieving reductions in the environmental burden to a number of ecological dimensions and farm income. Different pesticide tax specifications vary in both the magnitude and the direction of their impacts. The results of the model indicate that either compromises will have to be made in environmental policy, or additional instruments will be required to counter-act the negative side-effects of some instruments. © 2001 Elsevier Science B.V. All rights reserved.
Keywords:Pesticides; Policy evaluation; Environmental indicators; Economic instruments
www.elsevier.com/locate/ecolecon
1. Introduction
The Common Agricultural Policy was estab-lished with the aim of increasing production effi-ciency and self-suffieffi-ciency in food production in the EU. A broad range of environmental prob-lems have been attributed to the achievement of its policy goals over recent decades, relating, for * Corresponding author. Present address: Scottish Natural
Heritage, 2 Anderson Place, Edinburgh, Scotland EH6 5NP, UK. Tel.:+44-131-4462427; fax: +44-0-131-4462405.
E-mail address: [email protected] (K. Fal-coner).
example, to environmental contamination by agro-chemicals, habitat destruction, biodiversity reduction and undesirable landscape change (Skinner et al., 1997). In particular, there are widespread and growing concerns related to the levels of use of chemical pesticides (Reus et al., 1994; World Wide Fund for Nature, 1995, Free-mark and Bontin, 1995; McLaughlin and Mineau, 1996). Agricultural pesticides are integral compo-nents of modern crop production systems. Unfor-tunately, however, it seems almost impossible to prevent chemicals that are deliberately introduced into the environment for crop protection from entering and diffusing through the environment. An obvious solution would be to reduce the quan-tities applied and to use chemicals of lower eco-toxicity, but a balance needs to be struck between greater environmental protection and the contin-ued contribution of agriculture to production.
The fifth European Environmental Action Plan established a reduction in chemical use as a major objective, although no actual goals or limits have been defined and currently member-states are largely free to address their own priorities. The complexity of crop protection and the generally superior information available to the farmer com-pared to the regulator, on the relative costs of alternative abatement strategies implies that envi-ronmental controls should aim to retain as much farm-level flexibility as possible. Policies involving the use of the market mechanism are potentially able to do this. However, although the environ-mental economics literature suggests that eco-nomic incentives may have efficiency advantages compared to command-and-control approaches, their applications have, as yet, covered only a limited range of issues. Only a few Northern European countries have experimented with ad 6alorem pesticide taxes or volume levies so far, although there is growing interest in the refine-ment and extension of incentive instrurefine-ments. For example, in recent years, the UK government has been assessing the options for input pesticide tax-ation (Department of the Environment, 1997).
Environmental economics can only really make a practical contribution to agri-environmental re-source management if linked with more explicit acknowledgement of the real-world characteristics
of environmental problems. The heterogeneity of pesticide inputs and the complexity of agro-eco-logical systems adds an important dimension to environmental policy-making; in this respect, pes-ticide contamination differs significantly from other agricultural pollution issues such as nitrate contamination.
This paper examines how an analytical mod-elling approach linking economic and ecological components could assist in achieving acceptable and workable environmental policies. A case-study assessment of the applicability of economic-incentive-based policy options to reduce pesticide contamination is presented. Section 2 discusses the need for multi-dimensionality in policy evalu-ation and outlines the production ecology ap-proach. Section 3 introduces the case study and Section 4 presents some policy evaluation results. Section 5 discusses the findings, and Section 6 concludes the paper.
2. Environmental complexity and policy multi-dimensionality
Many of today’s most intractable environmen-tal problems are those for which the effects of natural physical and chemical processes are highly uncertain in terms of their extent, degree and duration. The potentially widespread environmen-tal contamination by agricultural pesticides is an obvious example of this. Furthermore, the multi-dimensionality of ecological problems is a critical consideration in the practical policy-making con-text. Given a complex system of cause and effect, the separate treatment of individual aspects of environmental quality problems by fragmented institutions and policies is unlikely to be appropri-ate. In particular, given linkages between system components, any intervention is likely to have some unintended effects. Changes need to be eval-uated in a wide-ranging way. For example, the interactions between different inputs to agricul-tural production, such as pesticides and fertiliser, mean that their usage should be considered jointly rather than separately.
in-evitable. Hence it is important to establish the indirect effects of instruments on other policy objectives and the linkages between instruments, and as part of the policy-making process to ex-ploit complementarities and to avoid conflict or overlap in the achievement of objectives to what-ever degree possible. At issue, therefore, is the nature and degree of overlap of the impacts of different agri-environmental policies: identifica-tion and measurement of these would provide useful information for real-world policy-making, given multiple objectives and the need to address these simultaneously. Policy development based on promoting the complementarities between schemes and their objectives could permit simpler, more efficient and more practicable frameworks composed of fewer policies.1
In contrast, imple-menting piecemeal policies in an inter-dependent economy may lead to an overall loss of efficiency (see Runge and Myers, 1985; Milon, 1987; Braden and Segerson, 1993; Vatn, 1995).
Many of the immediate environmental impacts of agriculture occur at a local level initially, so the analysis here focuses on the details of farming systems. The micro-economic theory of produc-tion and consumpproduc-tion provides a useful frame-work for analysis to shed light on fundamental, firm-level problems of resource allocation. Policy problems are envisaged in terms of alternative allocations of resources, the objective being to find the pattern of production that will contribute most to goal achievement. A high proportion of farm-level agri-environmental policy studies apply optimalisation analysis and programming tech-niques, such as linear programming (LP) (see, for example, Hazell and Norton, 1986). Mathematical programming approaches have important advan-tages over econometric models using past data where the policy requiring analysis has no histori-cal precedent or if, for any other reason, projec-tions from past data are not possible.
Central to the analysis is a study of the quantity and mix of commodities which farmers could
produce, and how (Barnard and Nix, 1979). Any production planning problem can be divided in general terms into several elements (Hazell and Norton, 1986): a set of (quantifiable) objectives; a range of possible enterprises/activities; and a set of limited resource supplies and other constraints. Production functions are assumed to consist of discrete combinations of inputs and outputs, each characterised by a discrete coefficient. With the application of price data, the incorporation of resource availability constraints, and an objective function (or functions), optimal production plans can then be derived.
The optimal plan is that combination of activi-ties that best fulfils the objectives of the farmer and is feasible in terms of the constraints. Opti-mality can be assessed by reference to the law of equi-marginal returns: if limited resources are not allocated in such a way that the marginal return to those resources is the same in all the alternative uses to which they might be put, profits could be increased by transferring resources, based on the notion of opportunity cost.
The traditional economic optimisation ap-proach can be developed and refined for more useful economic-ecological analysis. De Koeijer et al. (1995) argued that economic analysis should draw on production-ecological knowledge (such as agronomy field trials or environmental moni-toring data). Simple ‘production economics’ mod-els provide information about the private costs of policy implementation only, but it is likely that there will be trade-offs between farm and environ-mental objectives (or policy would not be needed in the first place). Ideally, a framework for policy evaluation would integrate an economic model of farm production with an environmental model. The ‘joint production’ of agricultural outputs and environmental externalities, and the possibility of varying the proportion of different outputs (crops and risks) for different combinations of inputs, provides a useful conceptual framework for analy-sis when trade-offs are of interest. Both purchased input levels and other resource use should be regarded as the technology sets required to achieve specified output levels. Hence, a systems approach is advocated, i.e. more wide-ranging consideration of the relevant inputs and outputs. 1However, O8nal et al. (1998), for example, found that it
The next section provides an application of the production ecology methodology to examine eco-nomic instruments to reduce the environmental consequences of pesticide usage.
3. Evaluating the environmental choices in taxation options
3.1. The empirical economic model
The research aim was to connect economic farm modelling with ecological models designed to assess the environmental consequences of pro-duction activities involving pesticide usage. There have been relatively few pesticide-specific policy evaluations in the literature (see though Oskam et al., 1992; Wossink et al., 1992; Bauer et al., 1995). Furthermore, there have been relatively few stud-ies evaluating the trade-offs between the achieve-ment of different environachieve-mental policy goals, rather than just the usual trade-offs between farm income and a single specified objective such as nitrate emissions reductions.
The micro-level is appropriate for primary pol-icy analysis because it is at the level of the individ-ual farm that the actindivid-ual decisions are made about cropping patterns, production intensity and so on. An East Anglian mainly-cereals farm with com-binable break crops was chosen as a case study, using data from Murphy (1995). Cereals account for a significant percentage of arable land in the UK and other European member states and form a key part of most rotations. East Anglia ac-counts for 40% of the arable crop area in England and Wales, and is also characterised by the great-est intensity of pgreat-esticide usage in the UK (Garth-waite et al., 1995), particularly of those chemicals most frequently detected in water resources and in breach of the drinking Water Directive (Drinking Water Inspectorate, 1994). The total rotational area of the farm was set at 250 ha.2
Full details are given in Falconer (1997).
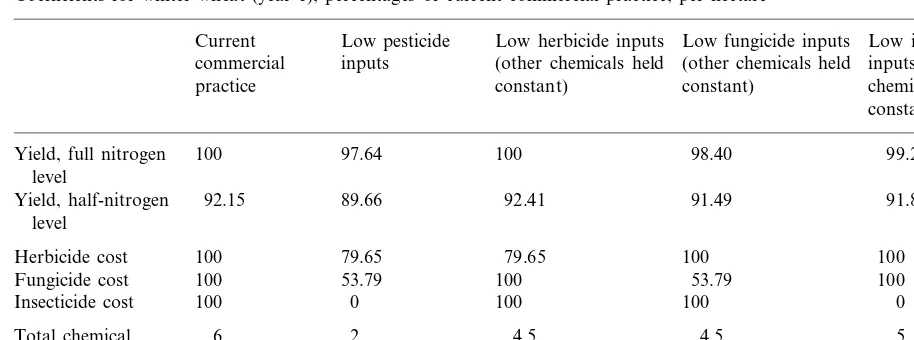
Two versions of the farm model were devel-oped. One model was calibrated to represent cur-rent commercial crop production (CONV) and the other was calibrated to represent a more ‘progressive’ farm (PROG), with a wider variety of cropping activities ranging between current commercial practice (CCP) and reduced input rates (50% of the CCP levels or lower) for all pesticide and nitrogen regimes. It is very impor-tant to include production functions representing different production options for each crop, for example, ranging from ‘intensive’ (CCP) to ‘eco-logical’ practices, to reflect the different options available to farmers with as detailed a specifica-tion of resource use as possible. However, crop protection is very complex and only limited data were available, so the number of activities consid-ered was restricted to five crop protection input regimes (covering herbicides, fungicides and insec-ticides) and two nitrogen regimes per crop. The low-input activities for the PROG model were calibrated on the basis of farm trials data col-lected in East Anglia between 1991 and 1996, which were used to calculate coefficients for yield and variable costs relative to CCP crops. Esti-mated yields and variable costs could then be obtained for low-input crops without having to use season- or situation- specific data. Numbers of herbicide, fungicide and insecticide spray units (where one unit is one per-hectare application at the labelled dose rate) were assigned to each crop activity on the basis of this information and sur-vey data from Garthwaite et al. (1995). However, the coefficients for the low-input practices were of course, only provisional estimates of the potential differences in yields and variable costs compared to CCP, given the very limited trial data that was available. Yields would be expected to vary over seasons, soil types, rotations, and field operations. Table 1 shows the coefficients estimated for winter wheat as an example.
The model allowed output data to be generated with regard to the crop land allocation; the total farm management and investment income; the total farm spray usage in terms of units, and a measure of the potential environmental impacts of pesticide uses. GAMS (General Algebraic Mod-elling System) (Brooke et al., 1992) programming 2This size group is fairly typical for the case-study region
Table 1
Coefficients for winter wheat (year 1), percentages of current commercial practice, per hectarea
Current Low pesticide Low herbicide inputs Low fungicide inputs Low insecticide inputs (other chemicals held (other chemicals held
commercial inputs (other
practice constant) constant) chemicals held
constant)
100 97.64 100 98.40 99.21
Yield, full nitrogen level
92.15 89.66
Yield, half-nitrogen 92.41 91.49 91.88
level
79.65 79.65
Herbicide cost 100 100 100
Fungicide cost 100 53.79 100 53.79 100
100
Insecticide cost 0 100 100 0
5 6
Total chemical 2 4.5 4.5
inputs, expressed as ‘units’ per ha
aOne unit=one per-hectare dose at the recommended rate.
was used to solve the model. The baseline optimal farm plan (i.e. the ‘policy-off’ scenario) for the conventional model was validated using the aver-age crop hectaraver-ages for farms of this type and was found to be satisfactory. The total cereal area for the CONV optimal plan matched published esti-mates from Murphy (1995) for cereal farms, ex-cluding potatoes and sugar beet, reasonably well. The oilseed rape area was relatively high, but probably because no other break crops were grown. The optimal plan for the PROG model included a smaller area of cereals and a larger area of break crops, but gave an equally plausible rotation. The baseline higher management and investment income (MII) achieved by the PROG model compared to CONV suggested that farm incomes could be improved by adopting less-in-tensive farming practices. This finding is sup-ported by other work, for example, in the Netherlands by Oskam et al. (1992).
3.2. The en6ironmental model: Hazard indicators for pesticides
Ideally, the optimal level of pesticide contami-nation control would be determined by equating the marginal social benefits of usage with its marginal costs. However, the ecological impacts from pesticide usage cannot be monetarised
eas-ily, so alternative approaches are needed. Analysis is further hindered by the fact that clearly quantified relationships between pesticide use and environmental quality are not yet available. The nature of pesticide impacts on the environment following field application depends on a number of factors, such as the amount of pesticide active ingredient applied, the toxicity of the pesticide, its persistence, local environmental characteristics and species presence and vulnerability. Still, some way must be found of assessing at least the direc-tion of likely changes in environmental quality resulting from changes in the optimal farm plan following policy implementation.
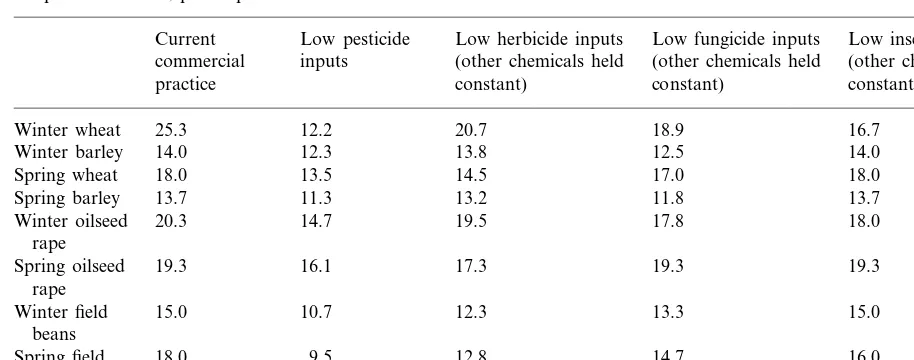
Table 2
Crop hazard scores, points per hectare
Low herbicide inputs
Current Low pesticide Low fungicide inputs Low insecticide inputs
inputs (other chemicals held
commercial (other chemicals held (other chemicals held
constant) constant)
constant) practice
Winter wheat 25.3 12.2 20.7 18.9 16.7
12.3 13.8 12.5
Winter barley 14.0 14.0
13.5 14.5
18.0 17.0
Spring wheat 18.0
13.7
Spring barley 11.3 13.2 11.8 13.7
20.3 14.7 19.5 17.8
Winter oilseed 18.0
rape
19.3 16.1
Spring oilseed 17.3 19.3 19.3
rape
Winter field 15.0 10.7 12.3 13.3 15.0
beans
Spring field 18.0 9.5 12.8 14.7 16.0
beans
13.6 9.0 9.0
Peas 18.7 9.0
be condensed into a single index using scoring and weighting, could be useful in suggesting where cropping practice changes could be made for greatest environmental benefit.
It is important to draw the distinction between hazard and impact: impact depends on both haz-ard and exposure to it. The latter, however, is very difficult to measure or even estimate for most species. Very few data are available on non-target species exposure, or the actual impacts of pesti-cides on them. As a result, the focus so far has tended to be on hazard, as implied by parameters such as the toxicity or lethal dose rates for non-target organisms, or physico-chemical properties such as water solubility or the soil adsorption coefficient. Similarly, the environmental indicators and summary scores developed here will focus on pesticide hazards.
The chosen methodology used a simple scoring and aggregating approach, similar to that devel-oped and applied by Kovach et al. (1992), for example. The information on statutory product labels summarised in Ivens (1994) was used as a basis for hazard assessment. The environmental and special precautions are supposed to take into account all the available information on pesticide risks and impacts that is used in the approvals process. Nine different ecological and human-health dimensions were identified on an ad hoc
basis from scanning all product labels listed in Ivens (1994), i.e. bees, fish, water quality, game and wildlife, skin, eyes, ingestion, inhalation and hazards from organo-phosphorous/ anti-cholinesterase compounds. In addition, a tenth ‘general’ dimension was defined on the basis that all pesticides are thought to present some ecologi-cal risk by virtue of their nature as biocides.
Scores were given for each hazard dimension according to labelled warnings (such as ‘harmful to fish’ or ‘irritating to eyes’). These scores were then aggregated so all pesticides received a score from 1 to 10, higher scores indicating that the pesticide poses a greater hazard. Simple arith-metic aggregation was used in the absence of any information indicating that an alternative weight-ing should be used. Table 2 gives hazard scores for the crops in the model.
This type of indicator, as developed above, has important advantages in terms of its coverage, transparency, adjustability in the light of new information, and the use of available data. It also includes all aspects covered in the approval/ regis-tration assessment process, and provides readily-accessible information for products rather than simply the active ingredients (which is useful since mixtures sold as products can otherwise be prob-lematic to evaluate). However, there may well be omissions in the environmental dimensions consid-ered here (for example, groundwater or air quality, of which no mention was made on product labels), and the labelled precautions reflect the nature of the approvals process at the time of the last review of the product. Precautions might be out of date and in need of revision. Furthermore, the yardstick is linear, and takes no account of indirect effects caused by interactions between different dimen-sions; neither is there any incorporation of environ-mental or other management efforts (such as the use of pesticide-exclusion strips along water-courses), which may reduce pesticide risks and impacts. Ideally the yardstick should be tailored for specific soil and climatic circumstances too. While the imperfections are acknowledged, at present there are no alternatives, so the yardstick provides at least a starting point for discussion.
3.3. Production ecological modelling for instrument appraisal
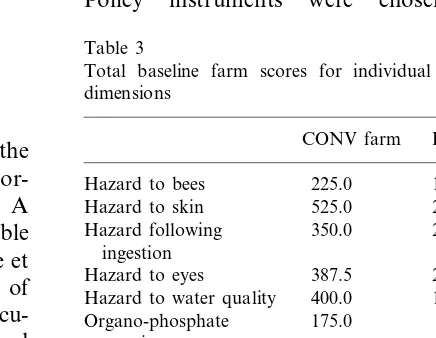
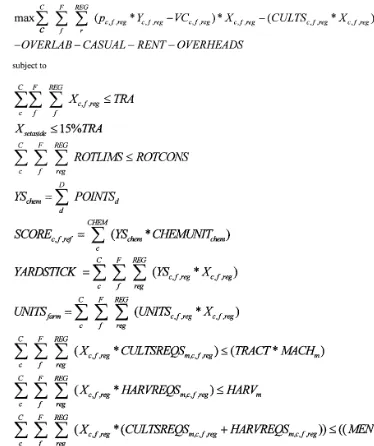
The next stage of the analysis involves linking the environmental indices described above to the nor-mative economic model for policy evaluation. A pesticide usage strategy was defined for each arable activity, based on survey data from Garthwaite et al. (1995) relating to the number of units used of each chemical. Activity hazard scores were calcu-lated using this information and the product hazard scores. A total score per farm could then be calculated once the cropland allocation was known. Table 3 summarises the baseline scores for the two farm systems.3The overall farm resource allocation
model, including both the economic component
and the environmental hazard indicators, is sum-marised in Fig. 1.
A key policy design issue is how closely an economic-incentive instrument aimed at a particu-lar action can be linked to the environmental impacts resulting from the action. The policy targeted on the indicator closest to the policy goal should be most efficient. However, the costs of intervention must be considered;4 limits on the
administrative capacities of government may form a significant constraint on policy-making and im-plementation. Input volume is a relatively low transactions-cost proxy for environmental burden, and hence a starting point at least for policy design. However, reducing the total volume of pesticide usage may not be the most efficient means of securing reductions in risks to health and the environment given an imperfect correlation be-tween kilograms of active ingredient and environ-mental burden.
Four economic incentive policy instruments were selected for evaluation: an ad6aloremtax (TAX); a fixed levy per spray unit (UNIT), where one unit is one standard (recommended) per-hectare spray application; a per kilogram active ingredient levy (KG); and a levy based on the pesticide hazard score of each individual product (HAZ). Policy instruments were chosen to reflect
Table 3
Total baseline farm scores for individual pesticide hazard dimensions
CONV farm PROG farm
100.0 Hazard to bees 225.0
Hazard to skin 525.0 218.8 256.3 Hazard following 350.0
ingestion
Hazard to eyes 387.5 247.5 400.0
Hazard to water quality 162.5 50 175.0
Organo-phosphate warning
190.5 Hazard to fish and 976.6
aquatic organisms
62.5 6.2
Hazard from inhalation
125.0 0
Hazard to game and wildlife
1187.5
General hazard 543.8
3Note, though, that these systems are only two points along
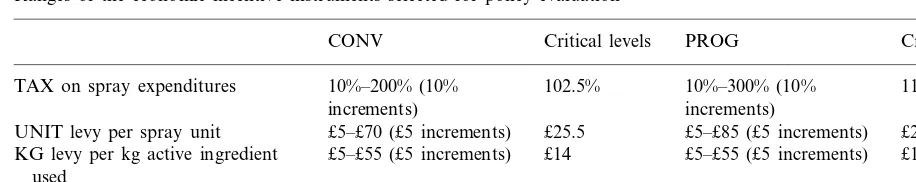
Table 4
Ranges of the economic incentive instruments selected for policy evaluation
PROG Critical levels
CONV Critical levels
102.5% 10%–300% (10% 117%
TAX on spray expenditures 10%–200% (10%
increments) increments)
£5–£85 (£5 increments)
£25.5 £24
UNIT levy per spray unit £5–£70 (£5 increments)
£5–£55 (£5 increments) £14 £17.5
KG levy per kg active ingredient £5–£55 (£5 increments) used
£1.8 £1–£15 (£1 increments) £5.4 HAZ levy per hazard point £1–£15 (£1 increments)
the objectives of current or proposed policy and with immediate relevance to the debate concerning pesticide minimisation as well as wider relevance to the environmental policy discourse. There are im-portant differences between the different economic instruments. TAX places a greater penalty on usage of the more expensive chemicals; HAZ is akin to an ad 6alorem tax, but involves price increases differentiated across chemicals according to the hazard score; KG penalises pesticides with higher volume applications. UNIT takes account of nei-ther of these aspects, but addresses intensity of pesticide use on a per-hectare basis. The instru-ments were incorporated into the model through appropriate pesticide cost adjustments. Table 4 gives the ranges evaluated for each instrument. Upper levels were set at those at which farm income fell to zero and land began to be retired voluntarily. All instruments had critical levels below which no change in the optimal farm plan was observed (i.e. the same outcome was observed as in the policy-off scenario); the analysis below relates to levels of tax or levy above these thresholds. Judging the critical value of any instrument is very important: imple-mentation of a tax or levy at a rate below this will simply raise revenue and reduce cash farm income, without achieving any real effects on farm resource allocation (in the short term, at least).
Interest lay in the changes in tax-neutral farm MII (i.e. MII without the deduction of the tax liability)5relative to changes in the farm’s pesticide
hazard scores, both total and for individual hazard dimensions. Changes in tax-neutral MII were also evaluated against changes in fertiliser expenditures (as a proxy for physical usage and nitrate leaching). The fertiliser criterion was of interest in terms of policy evaluation from a multi-dimensional per-spective: if a pesticide reduction policy achieves its goals to the detriment of other environmental aspects (such as nitrate leaching), it is important to have information on these trade-offs. Economic theory predicts that if the usage of either nitrogen or crop protection chemicals is proscribed, usage of the other should also fall, giving rise to a positive environmental side-effect (see Weinschenk and Dabbert, 1987; Berg, 1984; Schulte, 1983).
There are a number of well-known limitations to LP, and therefore the model developed here. LP is a partial equilibrium approach only, with a single objective function. Ideally, risk attitudes and the relative riskiness of different cropping activities would have been modelled too, but data were inadequate for this. Furthermore, the models used here relate to single periods only: ideally, a recur-sive, or dynamic optimisation, approach would have been used. Another limitation stems from the small range of technologies assumed to be available for any given cropping activity. Understanding the input substitution possibilities is central to the analysis here of the environmental problems of pesticides: policy impacts should differ depending on the compliance options available to producers. There is a complex surface of input combinations that a farmer may take account of when developing or adjusting his farming system, but LP takes this into account discretely rather than con-tinuously. Thus, unless a large number of 5The tax payments made by the farmer are, of course,
activities are included in the analysis, input substi-tutions may be masked by product substisubsti-tutions. The model relates to the short term only; no allowance could be made for the gradual develop-ment of the farm plan in the absence of knowl-edge of future technological change. Furthermore, indicators such as those developed here cannot address specific environmental problems or partic-ular situations, and in most cases they should be supplemented with other, case-specific informa-tion to yield maximum benefit in policy appraisal. Caution is advocated when using indicators in new situations very different to those under which parameter values were estimated as values may not be stable across different contexts. However, despite its limitations, the modelling approach linked to environmental indicators here was still considered useful for examining the potential con-sequences of policy implementation.
4. Results
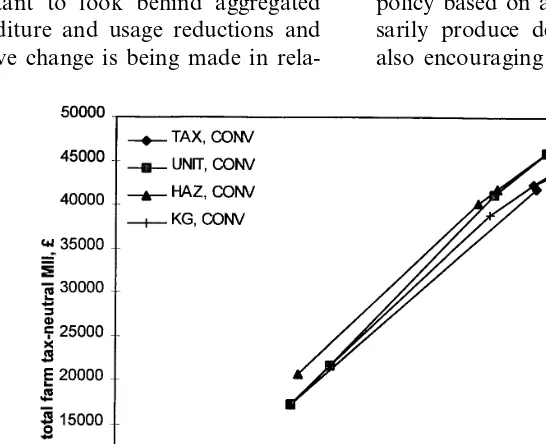
The empirical work presented used the farm-level models described above to investigate how pesticides might be reduced most cost effectively, at the farm level. The underlying hypothesis was that the cost effectiveness of any one instrument at reducing hazard along different ecological di-mensions will vary. Trade-offs might be expected between improvements made to different dimen-sions, and also between reductions in pesticide and chemical-fertiliser usage. Two-dimensional frontier analysis, involving a simple economic dominance criterion, was applied to distinguish between the outcomes of the various policy instru-ments. This approach allowed the trade-offs in farm plans between farm income and indicators of environmental burden under different policy sce-narios (instrument type and level) to be presented visually. Frontier analysis can assist in the assess-ment of whether simply reducing the volume of pesticides applied is sufficient to reduce environ-mental burdens, or whether other policy goals, such as changing the specific type of chemicals used, might perhaps be more effective.
Higher income/pesticide usage (or pesticide hazard) frontiers are preferable, as these indicate
that a given policy variable level can be achieved with as high a level of (tax-neutral) farm manage-ment and investmanage-ment income (MII) as possible. A farm plan arising under a given policy scenario is dominant when no other plan can obtain the same or lower spray usage (or level of another policy indicator) with the same or greater returns. Backward-bending frontiers (i.e. with negative gradients) indicate that not only is farm income falling, but the policy indicator value (for exam-ple, total farm hazard score) is simultaneously increasing.6 An important question was whether
the rankings of the four charges and levies dif-fered depending on the policy instrument used, or whether one instrument consistently out-per-formed the others. That is, assuming equal social preference weightings for different types of envi-ronmental change, does any one policy achieve better results for one indicator or more with no-worse results for all other indicators of interest?
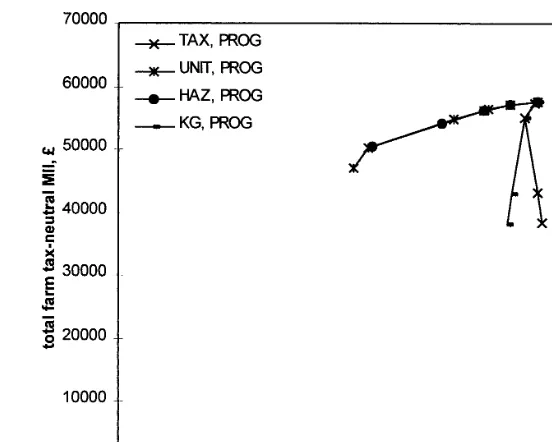
A concern was that some instruments might be ineffective or even counter-productive to some degree. Policy rankings were found to vary to some degree according to the goal to be achieved, such as reductions in spray expenditure, physical usage and environmental hazard, which compli-cates practical policy-making. As expected, HAZ was found to be consistently best at reducing the overall farm hazard score with least impact on farm income (see Figs. 2 and 3). UNIT was found to be best at reducing spray unit usage when evaluated using the CONV model, although in the PROG model both HAZ and UNIT appeared to be equally good (with respect to farm MII) at reducing the volume of pesticide applied on the farm. UNIT performed relatively well on balance, which is encouraging as this may also have other attractive features such as transparency and ad-ministrative feasibility.
A different policy ranking emerged when evalu-ating policies on the basis of fertiliser expenditure
reductions rather than pesticide usage reductions, so there are important questions to be answered about social preferences for the relative achieve-ment of different environachieve-mental goals, and the permissible trade-offs. Generally, the correlation between fertiliser expenditure and measures of pesticide usage was positive, although a negative relationship was observed following the imple-mentation of some instruments, with policy-mak-ing implications in terms of resolvpolicy-mak-ing conflicts between the achievement of policy goals for pesti-cide and fertiliser usage. At low levels of TAX, a slight increase in spray units was observed, and a decrease in fertiliser expenditure for the CONV farm model. Other policy instruments were found to result in decreased levels of both variables as the levy rates increased. TAX was observed to result in decreased levels of both variables as the rate increased for the PROG farm model. How-ever, UNIT and HAZ were observed to lead to increased fertiliser expenditure as the levy rates rose, while the total farm spray units fell.
The heterogeneity of pesticide products in terms of their adverse environmental potential means that it is important to look behind aggregated farm-level expenditure and usage reductions and check that positive change is being made in
rela-tion to policy sub-goals. Interest lies in the achievement of hazard reductions across a range of ecological dimensions, rather than just making improvements to some dimensions at the expense of others. Figs. 2 and 3 have summarised the trade-offs between total farm-level pesticide haz-ard and farm income; it is necessary now to examine trade-offs between income and the indi-vidual hazard dimensions themselves. The focus was placed on the ecological hazard dimensions rather than the on-farm hazards to health, which would be expected to be ‘internalised’, for exam-ple, by wearing protective clothing.
Table 5 summarises the relative performance of the different instruments in terms of their impacts on individual ecological and health hazards. Few trade-offs between hazard reductions for different dimensions were observed for the CONV farm. However, some negative consequences were ob-served for the PROG model, for example, in terms of hazards from organo-phosphates. Gener-ally, the observed negative effects related more to human health rather than ecological dimensions. Nevertheless, it appears that a pesticide reduction policy based on an ad6aloremtax will not neces-sarily produce desirable changes in usage. It is also encouraging that the frontiers produced
Fig. 3. Scenario frontiers for total farm hazard scores, CONV.
der the UNIT and HAZ policy scenarios were reasonably similar, given the arguably simpler tax base of the former instrument.
Interest also lay in the relative extent to which individual dimensions were improved. Another approach to instrument evaluation and compari-son involved the use of a summary index of cost-effectiveness (CE) to indicate the ‘elasticity’ of trade-offs between farm income and policy indicators, both of which are contingent upon the farm-plans resulting under different policy scenar-ios. This method facilitates evaluation along mul-tiple dimensions of interest, providing different information to the evaluations above.
A unitless cost-effectiveness ratio was calcu-lated using percentage changes in any given di-mension X as compared to changes in farm income, rather than absolute changes from the baseline (the policy-off situation). A CE score of 1 indicates unit elasticity, i.e. a 1% change in the criterion value is accompanied by a 1% change in real farm income; a value of 2 would indicate a 2% change in the criterion accompanied by a 1% change in farm income. A larger ratio indicates a more cost-effective policy. However, in the ab-sence of knowledge of social preferences for these
changes, it is impossible to identify desirable thresholds of CE for policy instruments to achieve; still, the analysis is useful for comparing policies. A negative ratio indicates that policy implementation gives rise to adverse effects, such as an increase in total hazard, even if other parameters, such as spray expenditure or usage have fallen.
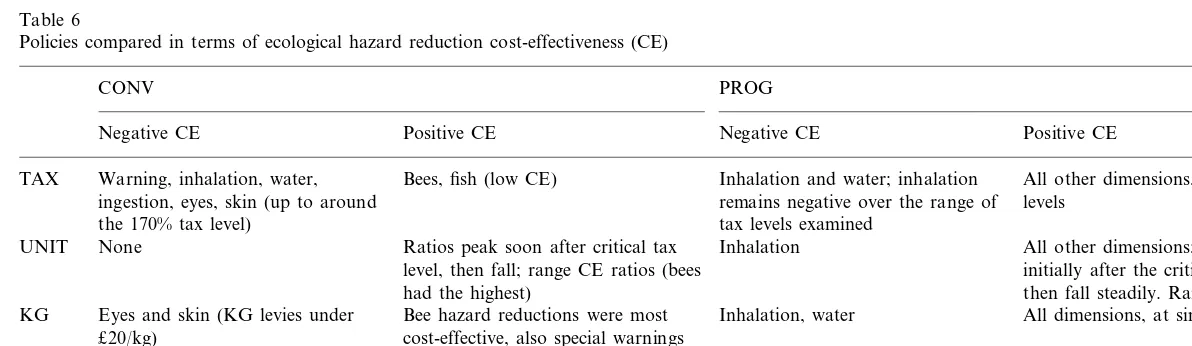
priori-ties of achieving hazards to the various dimen-sions. The CE trends for each policy with regard to ecological hazard dimensions are summarised in Table 6.
5. Discussion
The policy issue here is how best to reduce pesticide contamination of the environment, espe-cially through encouraging reduced pesticide ap-plication levels, with the lowest possible reduction in farm production and incomes, and without prejudicing other environmental policy goals such as reductions in nitrate leaching. In addition, a more immediate issue is how to combine and analyse the available information for useful policy analysis.
One aim of the research was to develop agri-en-vironmental policy evaluation methodology, fo-cusing on the potential of economic incentives to reduce the environmental problems of pesticide usage. The linking of farm-economic and ecologi-cal components (through the use of the pesticide hazard indicator) in the model was found to be useful for articulating the trade-offs in policy implementation between different environmental concerns. Existing policy evaluation work has been extended in several aspects within a concep-tual ‘production ecology’ framework, i.e. through inclusion of low-spray input practices, based on empirical trials data collected in the region; inclusion of a physical spray usage component,
and
inclusion of a set of indicators representing pesticide hazards along a number of human health and ecological dimensions.
An important hypothesis was that the choice of environmental or health policy target was likely to be highly important to policy cost-effectiveness since targets are not perfectly substitutable. Ob-jectives such as reductions in the hazards posed by spray usage to different environmental dimensions were achieved with different levels of cost-effec-tiveness. Imperfect correlations between spray ex-penditure and hazard imply that ad6aloremspray taxation is not the best way of achieving spray usage or hazard reduction goals, and the model results confirm this. Ad 6alorem taxation may however, be redeemed by its other attributes, such as its relative simplicity and familiarity as a policy instrument.
The differences between pesticides in terms of their potential environmental hazards and im-pacts, and the relative efficiency of HAZ suggest that compound-specific policies, i.e. differentially-applied taxes or restrictions, should be consid-ered. Interestingly, the results suggested that there are potential trade-offs between the improvements to the different dimensions possible under the policies (e.g. between pesticide and chemical fer-tiliser contamination reductions). While TAX was the least cost-effective instrument at reducing pes-ticide usage and hazards, it also had some sec-ondary environmental advantages in being the policy instrument that most cost-effectively re-duces fertiliser usage as a positive side-effect. However, further work investigating other agri-cultural systems is needed to confirm whether this
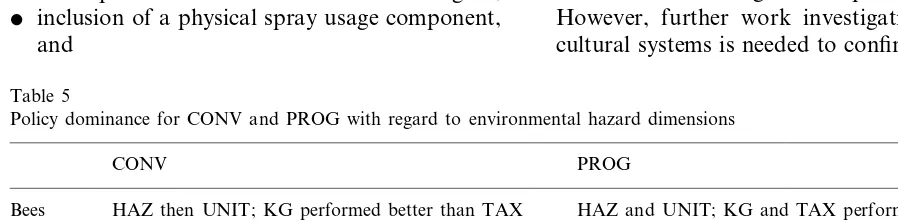
Table 5
Policy dominance for CONV and PROG with regard to environmental hazard dimensions
PROG CONV
Bees HAZ then UNIT; KG performed better than TAX HAZ and UNIT; KG and TAX performed badly (no change in hazard levels)
HAZ and UNIT, KG and TAX slightly Water HAZ and UNIT, then KG
counter-productive
Warnings HAZ and UNIT, then KG HAZ and UNIT, TAX counter-productive Fish All instruments performed similarly UNIT then HAZ, KG performed worst
All instruments performed similarly (KG poorest), Not applicable (zero hazard) Game
K
.
Falconer
,
I
.
Hodge
/
Ecological
Economics
36
(2001)
263
–
279
Table 6
Policies compared in terms of ecological hazard reduction cost-effectiveness (CE)
PROG CONV
Positive CE Positive CE
Negative CE Negative CE
All other dimensions, but very low Inhalation and water; inhalation
Warning, inhalation, water,
TAX Bees, fish (low CE)
ingestion, eyes, skin (up to around remains negative over the range of levels
the 170% tax level) tax levels examined
All other dimensions; values rise None
UNIT Ratios peak soon after critical tax Inhalation
initially after the critical levy value level, then fall; range CE ratios (bees
had the highest) then fall steadily. Range of values Inhalation, water All dimensions, at similar levels. KG Eyes and skin (KG levies under Bee hazard reductions were most
£20/kg) cost-effective, also special warnings and water hazards
All dimensions, at similar levels. Bee hazard reductions were most
HAZ None None
is a generalisable result. Nevertheless, although the models included only some of the chemicals potentially used in arable production, they were chosen on the basis of survey data to reflect typical strategies for each crop, so results are thought to be reasonably generalisable within this type of production.
Instrument rankings were not consistent over all of the ecological and health hazard indicators. This is an important observation as practical pol-icy-making must take into account and meet mul-tiple objectives, so issues such as which objectives take priority, and the degree to which trade-offs between the achievement of different objectives are acceptable, must be resolved. The next step in practical policy-making terms requires reaching a social consensus on favoured packages of ecologi-cal and health hazard reductions. Alternatively, information is needed on how acceptable negative changes to some dimensions are, if other changes are considered positive. A problem is the absence of information on social preferences for environ-mental protection relative to food production and other activities.
At present, farms are being encouraged to con-vert to low-pesticide production and further pesti-cide reductions are still a policy goal. It might well be that conversion to PROG production is sufficient to achieve agro-chemical reduction goals, implying that policy efforts should be fo-cused on encouraging system change to PROG from CONV rather than tax pesticide inputs with farms remaining at CONV.
6. Concluding comments
Concepts such as sustainability imply that eco-logical problems should not be compartmen-talised and examined in isolation: other objectives should be considered simultaneously, i.e. by tak-ing an integrated, multi-dimensional approach to agri-environmental policy formulation and evalu-ation. Sustainable agriculture has ecological, agri-cultural and socio-economic dimensions, so trade-offs between different objectives must be recognised and compromises found. The type and degree of trade-offs may vary across different
systems, so assessment will always, of necessity, be empirical.
Ideally, policy should aim to create incentives for changes in agricultural systems, such as move-ment towards integrated farm managemove-ment. For example, policy might develop based on incentives for conversion to integrated farm management, rather than simply partial changes such as switches between chemicals or crops. Partial changes would probably risk shifting adverse im-pacts to different compartments of the ecological system, instead of actually reducing undesired ef-fects. Pesticide heterogeneity even means that the effects of pesticide usage reductions are not neces-sarily positive. It is very unlikely that a single instrument will satisfactorily solve the multi-di-mensional problems of pesticide contamination. Advice, extension and education will be central to any strategy.
The complexity of non-point environmental problems is a significant challenge for analysis. The aim of this study was to contribute to the development of effective ways of utilising avail-able knowledge for policy evaluation and manage-ment recommendation purposes; linking ecological and economic components would im-prove quantitative evaluation of the farm-level impacts of different pesticide reduction policies. The meeting of economic and ecological perspec-tives requires questioning the neo-classical belief that a simple theoretical construct based on rela-tively simple assumptions can be used to analyse all economic activity, as well as the environmental issues associated with the economic system. Neo-classical economic theory provides a useful con-ceptual orientation for policy-making and a basis from which to qualify recommendations or make refinements in modelling. However, it is very im-portant to raise awareness of the system within which we exist, produce and consume and the secondary effects of our actions.
the current economic framework. Trade-offs be-tween different environmental concerns, as well as between environmental quality and agricultural production, are inevitable. Therefore, rather than taking a piecemeal approach to policy-making, concerns should be integrated into a comprehen-sive framework, to exploit positive side-effects of different components and reduce conflicts. Given a complex real world of inter-related components, and high transactions (and policy-making) costs, it is appropriate to recognise multiple outcomes from single instruments. More work is needed to identify the opportunities or mechanisms for joint implementation of policies and the joint achieve-ment of different goals.
Finally, it is important to recognise that models are just tools to assist policy-makers, i.e. starting-points for analysis. In the absence of knowledge regarding social preferences, it is impossible to reach any firm conclusions about the preference of policy outcomes. Trade-offs must be resolved through the political process, unless the outcomes in all dimensions of a particular instrument domi-nate those of other instruments (for example, if a particular policy can stimulate a greater change (reduction) in environmental impact, at lower cost (foregone income losses) to farmers.
Acknowledgements
Grateful acknowledgement is made to the Agri-cultural Development and Advisory Service (ADAS) for permission to use field trials data. This work was completed as part of a Ph.D. thesis at the Department of Land Economy, University of Cambridge, and was funded by a MAFF stu-dentship. The authors acknowledge the comments of anonymous referees; the usual caveats apply.
References
Barnard, C., Nix, J., 1979. Farm Management. John Wiley & Sons, New York.
Bauer, S., Hoppe. U., Hummelsheim, S., 1995. Decision Sup-port System for Controlling Pesticide Use in Hessen. In Oskam, A., Vijftigschild, R. (Eds.), Proceedings, Work-shop on Pesticides, Wageningen, August, pp. 25 – 27.
Berg, E., 1984. Economic Aspects of Environmental Regula-tion in the FRG. UK Agriculture and the Environment: the Economist’s Approach. Paper presented at the Agricul-tural Economics Society One-Day Conference, London. Braden, J.B., Segerson, K., 1993. Information Problems in the
Design of Non-Point Source Pollution Policy. In: Russell, C.S., Shogren, J.F. (Eds.), Modelling and Experience in the Management of Non-Point Source Pollution. Kluwer Aca-demic Publishers, Boston.
Brooke, A., Kendrick, D., Meeraus, A., 1992. General Alge-braic Modelling System (GAMS), a User’s Guide. GAMS Corporation, Washington DC Release 2.25.
De Koeijer, T.J., Wossink, G.A.A., van Ittersum, M.K., 1995. Environmental-Economic Modelling at Farm-Level: Ex-ploring Options for Sustainable Agriculture. In: Oskam, A., Vijftigschild, R. (Eds.), 1997, Proceedings from the Workshop on Pesticides, August 25 – 27, Wageningen. Department of the Environment, Transport and the Regions
DETR, 1997. Economic Instruments for Water Pollution. Consultation paper. London, DETR.
Drinking Water Inspectorate DWI, 1994. Drinking Water 1993: A Report by the Chief Inspector for Drinking Water DoE/Welsh Office/HMSO: London.
Falconer, K.E., Whitby, M., 1999 Transactions and Adminis-trative Costs in Countryside Stewardship Policies: an In-vestigation for Eight European Member States. Centre for Rural Economy Research Report, March 1999. CRE, Uni-versity of Newcastle, Newcastle upon Tyne.
Falconer, K.E., 1997. Environmental Policy and the Use of Agricultural Pesticides. Unpublished Ph.D. thesis, Univer-sity of Cambridge.
Freemark, K., Bontin, C., 1995. Impacts of Agricultural Use or Terrestrial Wildlife in Temperate Landscapes in a Re-view with Special Reference to North America. Agriculture Ecosystems and Environment 52, 67 – 91.
Garthwaite, D.G., Thomas, M.R., Hart, M., 1995. Pesticide Usage Survey Group Report: Arable Farm Crops in Great Britain. HMSO, London.
Hazell, P.B.R., Norton, R.D., 1986. Mathematical Program-ming for Economic Analysis in Agriculture. Macmillan, London.
Ivens, G.W., 1994. UK Pesticide Guide 1994 CAB Interna-tional/BCPC: Farnham.
Kovach, J., Petzoldt, C., Degri, J., Tette, J., 1992. A Method to Measure the Environmental Impact of Pesticides. New York’s Food and Life Sciences Bulletin 139, 1 – 8. McLaughlin, A., Mineau, P., 1996. The Impact of Agricultural
Practices on Biodiversity. Agriculture Ecosystems and En-vironment 55, 201 – 212.
Milon, J.W., 1987. Optimising NPS Controls in Water Quality Regulation. Water Resources Bulletin 23 (3), 387 – 396. Murphy, M.C., 1995. Report on Farming in the Eastern
Counties of England, 1993/4. Agricultural Economics Unit, University of Cambridge.
Oskam, A.J., Van Zeijts, H., Thijssen, G.J., Wossink, G.A.A., Vijftigschild, R., 1992. Pesticide Use and Pesti-cide Policy in the Netherlands. Wageningen Economic Studies 26. Wageningen Agricultural University, Wa-geningen, The Netherlands.
Reus, J.A.W.A., Weckseler, H.J., Pak, G.A., 1994. Towards a Future EC Pesticide Policy: an Inventory of Risks of Pesticide Use, Possible Solutions and Policy Instruments. CLM paper 149, Centre for Agriculture and Environ-ment, Utrecht.
Runge, C.F. and Myers, J.R., 1985. Shifting Foundations ofAgricultural Policy Analysis: Welfare Economics When Risk Markets are Incomplete, American Journal of Agri-cultural Economics, 1010 – 1016.
Schulte, J., 1983. Der Einfluss eines begrentzen Handels-duenger und Pflanzenbehandlung-smitteleinsatzes auf be-triebsorganisation und Einkommen verschiedner Betrie-bssyteme. Dissertation, Rheinischen Friedrich-Wilhelms Universitat, Bonn.
Skinner, J.A., Lewis, K.A., Bardon, K.S., Tucker, P., Catt, J.A., Chambers, B.J., 1997. An Overview of the Environ-mental Impact of Agriculture in the UK. Journal of En-vironmental Management 50 (2), 111 – 128.
Vatn, A., 1995. Input Versus Emissions Taxes: Green Taxes in a Mass Balance and Transactions Costs Perspective. EcEc/RMPA Working paper 41.
Weinschenk, G., Dabbert, S., 1987. Decrease in the Intensity of Natural Resource Use as a Way to Reduce Surplus Reduction, in Dubgaard, A. and Nielsen, A.H., 1987, eds. Economic Aspects of Environmental Regulations in Agriculture Wissenschaftsverlag Vauk Kiel KG.
Wossink, A., De Koeijer, T., Renkama, J., 1992. Incorporat-ing the Environment in Economic ModellIncorporat-ing of Farm Management. Sociologia Ruralis 32 (1), 115 – 126. World Wide Fund for Nature WWF, 1995. Pesticide
Reduction: Economic Instruments. WWF, Gland, Switzerland.