* Huawu Deng is the corresponding author from PCI Geomatics, Canada (http://www.pcigeomatics.com) by email
HIGH PERFORMANCE COMPUTING FOR DSM EXTRACTION FROM ZY-3
TRI-STEREO IMAGERY
Shuning Lua, Shicun Huanga, Zhiqiang Pana; Huawu Dengb, *, David Stanleyb, Yubin Xinb
a China Centre for Resources Satellite Data and Application (CRESDA), 5 Fengxiandong Road, Yongfeng Industry Zone, Haidian
District, Beijing, China 100094 – [email protected], (hscwhp, panzhiqiang2011)@126.com
b PCI Geomatics, National Capital Office, 490 Saint Joseph Boulevard, Suite 400, Gatineau, Quebec, Canada J8Y 3Y7
–
(deng,stanley, xin)@pcigeomatics.com
Commission I, WG I/5
KEY WORDS: High Performance Computing, Parallel Computing, Distributed Computing, Automation, Image Matching, DSM Extraction
ABSTRACT:
ZY-3 has been acquiring high quality imagery since its launch in 2012 and its tri-stereo (three-view or three-line-array) imagery has become one of the top choices for extracting DSM (Digital Surface Model) products in China over the past few years. The ZY-3 tri-stereo sensors offer users the ability to capture imagery over large regions including an entire territory of a country, such as China, resulting in a large volume of ZY-3 tri-stereo scenes which require timely (e.g., near real time) processing, something that is not currently possible using traditional photogrammetry workstations. This paper presents a high performance computing solution which can efficiently and automatically extract DSM products from ZY-3 tri-stereo imagery. The high performance computing solution leverages certain parallel computing technologies to accelerate computation within an individual scene and then deploys a distributed computing technology to increase the overall data throughput in a robust and efficient manner. By taking advantage of the inherent efficiencies within the high performance computing environment, the DSM extraction process can exploit all combinations offered from a set of tri-stereo images (forward-backword, forward-nadir and backword-nadir). The DSM results merged from all of the potential combinations can minimize blunders (e.g., incorrect matches) and also offer the ability to remove potential occlusions which may exist in a single stereo pair, resulting in improved accuracy and quality versus those that are not merged. Accelerated performance is inherent within each of the individual steps of the DSM extraction workflow, including the collection of ground control points and tie points, image bundle adjustment, the creation of epipolar images, and computing elevations. Preliminary experiments over a large area in China have proven that the high performance computing system can generate high quality and accurate DSM products in a rapid manner.
1. INTRODUCTION
Among a large number (more than 50) of Earth Observation (EO) satellites (Guo, 2012) (Xu, et al., 2014) (Deng, et al., 2014a) launched by China from 2004 to 2016, ZY-3 is considered as one of the most successful Chinese satellites (Li, 2012). ZY-3 was launched in 2012 and it acquires multispectral and panchromatic imagery (CRESDA, 2015). The multispectral products have four bands (blue, green, red and near infrared) with a nominal ground resolution/ground resolved distance (GRD) at 6 meters (m) and a swath width of 51 kilometres (km). The panchromatic products are acquired using three cameras, one pointing to the nadir direction, one forward, and the other pointing backward, with nominal GRD at 2.1m, 3.5m and 3.5m respectively. The viewing angle (along track) of the off-nadir scanners is 21 degrees off nadir. An extensive amount of literature is available to assess the radiometric (Huang, et al., 2013) and the geometric quality (Tang, et al., 2013; Tang, et al., 2015) (Xu, et al., 2012) (Liu, et al., 2012) (Jiang, et al., 2013) (Pan, et al., 2013) (Zhang, et al., 2014) (Wang, et al., 2014) (Jiang, et al., 2014) (Deng, et al., 2014b) of the imagery from ZY-3.
One of the predominant features that makes ZY-3 so popular is that it offers the potential to extract high quality DSM/DEM (Digital Elevation Model) products from its tri-stereo (also called three-line or three-view) imagery (Li, 2012). A national-scale surveying project in China (SBSM, 2015) (Baike, 2015) acquired and demonstrated the use of ZY-3 tri-stereo imagery. Researchers have reported on extracting DSM from ZY-3 images
(Zhang, et al., 2012) (Xue, et al., 2015) (Guo, et al., 2015). There is an increasing demand for national-scale surveying projects using ZY-3 tri-stereo imagery. In order to provide full coverage of the entire territory of China using ZY-3 imagery, more than 30,000 scenes must be acquired and processed. Processing this large volume of scenes in a timely manner within a project is very challenging. Users are increasingly seeking to lower their processing costs, while sensors continue to be more complex. They still want to achieve high quality DSM/DEM products (i.e., higher resolution, and less noise and abnormal values, and remain competitive with the free 30m ASTER DEM (ASTER, 2015) and 90m SRTM DEM (USGS, 2015b)). A system which offers high accuracy and high volume output while maintaining high quality standards entails a significant achievement of high efficiency in production processes. Traditional photogrammetric workstation software systems have been severely challenged, due to their sequential computing software architecture which cannot take advantage of the latest computer hardware architecture (multiple or many cores system) to gain computing power. Traditional photogrammetric workstations would require significant and time consuming upgrades to compete with the high performance computing system.
Hence, solutions were sought from the high performance computing technologies, among which parallel computing and distributed computing are outstanding. The choice of parallel computing is rooted from the parallel computation nature in most image processing algorithms (Stevenson, et al., 2000) (Merigot & Petrosino, 2008). Distributed computing from another ISPRS Annals of the Photogrammetry, Remote Sensing and Spatial Information Sciences, Volume III-1, 2016
perspective could simultaneously execute computation from different tasks and hence increase the overall data throughput in a limited time (WikiPedia, 2015e) (Deng, et al., 2014a).
Since a set of tri-stereo imagery has advantages over the traditional dual-stereo imagery (i.e., stereo pairs): a wider viewing angle (forward-backward), and two regular viewing angles (forward, backward when combined with the nadir viewing angle) in order to reduce occlusion (Pollard, et al., 2010) (Krishma, et al., 2008), the high performance system is ideal to gain efficiencies when processing all potential combinations which require less computing resources.
The remainder of the paper is organized as follows. Section 2 reviews the technologies for high performance computing in the remote sensing domain. Section 3 then renders the ideas of architecting a system that could deploy both parallel computing and distributed computing to the DSM extraction process. Section 4 reports preliminary experiments over a large region in China in order to demonstrate the computing performance and accurate results derived from the system.
2. OVERVIEW OF HIGH PERFORMANCE
COMPUTING
2.1 Parallel Computing
The performance of parallel computing is generally associated with two issues: one is the software implementation and the other is the hardware configuration.
The issue of software implementation examines how a traditional sequential algorithm is converted to a parallel one. Early research (Pachowics, 1989) examines how to convert sequential image processing algorithms into parallel ones for a simple sequential minicomputer. The first approach proposed in this research was to pack more than one image pixel (particularly for binary and grey level images) into a single type of data to reduce computation. The research then categorized the image operations into a low (e.g., logical, arithmetic and shift) level and a high level type (e.g., choice of neighbouring pixels, conditional operations, counting operation, etc.) to take advantage of the packing of pixels in parallelization. A lot of research was done using various strategies to parallelize the sequential algorithms (Stevenson, et al., 2000) (Jones, et al., 2003) (Akoguz, et al., 2013) (Bhojne, et al., 2013) (Plaza & Chang, 2007). Those various implementations require image processing domain knowledge from scientists and computer knowledge from computer engineers, which creates a gap between image processing and high performance (Seinstra, et al., 2002). The researchers (Seinstra, et al., 2002) initialized a software architecture with an extensive library of data parallel low level image operations (assuming the computing environment to be homogeneous distributed multi-computers). Although such initiatives could remove the cumbersome implementation work from image processing researchers, the efficiency of using the parallel libraries yet remains in hands of the users who are required to have comprehensive knowledge of the library and associated domain knowledge (Seinstra, et al., 2002). Similar efforts are reported in a few practices that targeted making parallel image processing algorithms as open sources (OpenCV, 2015) (OpenVIDIA, 2015). OpenCL (Open Computing Language) is a project in computer science to provide a generic software tool to implement parallel algorithms in various areas including image processing (Khronos, 2015). An advantage of OpenCL is its abstraction to various hardware platforms. An
OpenCL-supported programming tool compiles a program with parallel instructions into a parallel program against a particular platform for the distribution of executables.
The issue of hardware configuration concerns what computing architecture for parallelization is implemented and how fast the hardware can process floating-point data, e.g., every second (usually in a unit of GFLOPS/TFLOPS/PFLOPS – Giga/Tera/Peta Floating-point Operations Per Second).
There are two computing architectures for parallelization: the SIMD (Single Instruction, Multiple Date streams) and MIMD (Multiple Instructions, Multiple Data streams) architectures
according to Flynn’s taxonomy (Flynn, 1972). In the SIMD architecture, many computing units simultaneously execute the same instruction with their own data which can be different from each other. For example, the supercomputer with vector processors decades ago supported SIMD, and the recent popular General Purpose GPU (GPGPU, which is still referred to as GPU hereafter in this paper) cards achieve impressive performance by implementing the SIMD instructions (Tsuchiyama, et al., 2012). The MIMD architecture executes different instructions with different data simultaneously. The present multiple-core CPU system is an implementation of MIMD. Note that a memory type for data accessing when executing either SIMD or MIMD instructions is critical for achieving the best performance in parallel computing and the choice of a memory type (e.g., distributed or shared) leads to different hardware products in a computer system (Tsuchiyama, et al., 2012).
The speed for floating-point data operations is considered as an indicator of how well the hardware can support parallelization. When increasing the clock cycles in a single core slowed down in the early part of the 21st century, development of multiple cores in a single CPU takes the majority of the responsibility to increase computing speed (WikiPedia, 2015d). A commercially available four-core CPU can achieve about 40 GFLOPS (more or less subject to manufacturing technology) in comparison with a single core CPU which has about 10 GFLOPS (WikiPedia, 2015b). Yet, the pace for increasing the number of cores in a single CPU is slow (Lee, et al., 2011) (WikiPedia, 2015d). The GPU technology has proven that it can handle the same tasks at a much faster pace to offer significantly more cores in comparison with CPU (Owens, et al., 2007). For example, a
low-end commercial GPU from NVIDIA’s GeForce GTX 660 offers
960 cores and is able to achieve a peak of 1,800 GFLOPS (single precision), while a high-end GPU from NVDIA’s K10 offers about 3,000 cores and can reach up to 5,000 GFLOPS (single precision) (WikiPedia, 2015c). The GPU demonstrates an impressive advantage in boosting performance for parallel computing. The GPU always requires a CPU for data communication from storage to memory (either from the device or from the host) and hence results in a data feed bottleneck in high performance computing. APU (Advanced Processing Unit) technology has recently emerged in order to overcome the communication issue between host and device (AMD, 2015). Sharing the same fast data bus between CPU and GPU, performance of a parallel computing algorithm should be improved (Daga, et al., 2011). Although the APU technology is still in its infancy and the mainstream of CPU/GPU manufacturers have not taken this path, it can be predicted that this would have great potential to speed up performance in parallel computing and its applications in the remote sensing domain. Cell Broadband Engine (Cell) is another hardware solution to combine powers from both CPU and GPU-like units, which has seen successes in gaming applications etc., but it poses ISPRS Annals of the Photogrammetry, Remote Sensing and Spatial Information Sciences, Volume III-1, 2016
challenges to developers due to the architecture of its memory usage (WikiPedia, 2015a).
FPGA (Field-programming Gate Array) is one solution that combines the software implementation with a configurable hardware. It has a pool of parallel image processing algorithms and those algorithms can be chosen by switching gates in the hardware device. This configurable hardware device enables users to select the desired algorithms for a particular application and hence achieves a high performance of computing. It has advantages due to its compact size so that it can be embedded on-board a sensor with a flying platform (El-Araby, et al., 2009), while it has restrictions due to the limitation of functions available on one FPGA unit regardless of the reconfigurable nature of those functions (Lee, et al., 2011). Experimental tests (Asano, et al., 2009) were done to compare the performance of CPU, GPU and FPGA and showed that the performance of GPU can match that of the FPGA even without careful tuning of the GPU programs.
2.2 Distributed Computing
Distributed computing is achieved through an infrastructure that combines computing power from a large number of processing nodes, which are often geographically located in different places. The distributed computing infrastructure is a high level system that acts as a virtual organization from different entities (Hager & Wellein, 2010) (Lee, et al., 2011). The history of the development and application of distributed computing systems can be traced back to more than a half century ago (Lee, et al., 2011) (Sun, et al., 2010). There are a number of distributed computing types available for research and industrial applications such as grid computing, cloud computing, and volunteer computing etc. (Hager & Wellein, 2010).
The essence in distributed computing for high performance is its scalability that either aggregates a huge number of potential computing power units from an entire region, a whole country and even the world or increases computing power by adding new processing units locally. The applications of distributed computing in science and industries are tremendous. The paper (Lee, et al., 2011) provides a thorough survey of available distributed computing systems for remote sensing applications, including Matsu, GENESI-DR and GENESI-DEC, G-POD, GMSEC, GEO Grid, and GEOSS, etc. Some other applications of distributed computing in remote sensing are discussed in the book (Plaza & Chang, 2007).
3. SOLUTION
3.1 Workflow Design
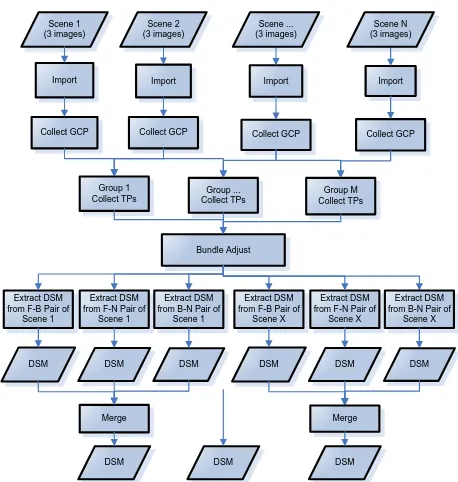
A general workflow for extracting DSM is described in the diagram below (Figure 1).
The key functions in the workflow are:
Importing. It performs data format conversion from a commercial data format to an internal one, and then builds relevant metadata and initiates a geometric math model. Each scene can be imported independently. A tri-stereo scene consists of three images and each image may be imported without dependency.
Collecting GCPs (Ground Control Points). The core algorithm is about matching a target image to a reference image, which leads to extracting accurate geolocation information from the reference image for a
number of points (i.e., GCPs) in the target image. Those GCPs are then used to refine the initial math model via removing geometric dislocation with respect to the ground and distortions between pixels.
Collecting TPs (Tie Points). All scenes are divided into subgroups according to their spatial relationship, provided that a minimum spatial overlap be kept between two neighbour subgroups. TPs are then collected between two images for all spatially overlapped image pairs in a subgroup.
Bundle adjusting. After TPs are collected, all images are consolidated into a single group and the math model of each image is adjusted for better accuracy and with evenly distributed errors.
Extracting DSM. DSM is then extracted from each stereo pair after executing the following functions: creating epipolar images, searching common points, computing parallax and then elevation, post-processing and interpolation.
Merging. Three DSMs generated from three combinations of one scene are merged into a single DSM according to their image matching scores, in which the highest score means the highest reliability of the computed elevation.
Scene 1 (3 images)
Import Import Import Import
Collect GCP Collect GCP Collect GCP Collect GCP
Bundle Adjust
Figure 1. Design of DSM extraction workflow (in which F stands for forward, B for backward, and N for nadir)
All DSMs merged from each scene may be mosaicked into a single DSM if necessary.
3.2 Distributed Computing
All functions except the bundle adjustment in the above workflow can be executed against an individual image or a pair of images. This means that each image or a pair of images can be distributed to any computing node and the processing of that image or pair is independent of the others. This phenomenon fits very well into a typical scenario that can be resolved by a system with distributed computing capability. A system with distributed computing capability allows executing multiple processes simultaneously not only in a single computing node (should it have the capability of running multiple processes) but also in a ISPRS Annals of the Photogrammetry, Remote Sensing and Spatial Information Sciences, Volume III-1, 2016
group of computing nodes. For its simplicity in implementation and advantage of having redundancy naturally, the computer clustering technology (WikiPedia, 2015e) (Deng, et al., 2014a) is an optimal choice for implementing the distributed computing capability.
3.3 Automation
Human interference should be avoided or should be reduced to the minimum if the full capability of a distributed computing system can be employed. Therefore, automation of the above functions is critical. The bottleneck often occurs in the process of collecting GCPs because trained technicians are usually required to finding GCPs from reference data. Fortunately, image matching technology has matured (Zitova & Flusser, 2003) (Wyawahare, et al., 2009). As long as there is sufficient similarity between two images, it is possible to choose one or certain specific algorithms to match one image against another automatically and hence GCPs can then be collected. With orthorectified imagery having become pretty common nowadays, a proper image matching algorithm should be able to automate GCPs collection from a reference image. The scenario is much simpler in automating TP collection because the images to be matched in this scenario are generally similar (usually coming from the same satellite and acquired almost at the same time). All the rest of functions (bundle adjustment, DSM extraction and merging) do not require any human intervention.
3.4 Parallelization of GCP and TP Collection Algorithms
There are many image matching algorithms that have been developed (Zitova & Flusser, 2003) (Wyawahare, et al., 2009) and most of them require the following two critical steps: 1. Extract features from both reference and target images; 2. Matching features. The computation of extracting features in Step 1 in most algorithms is generally localized in a small neighbourhood and hence the feature extraction algorithm can be made highly parallel. The most time-consuming work when matching features is to compute the similarity between the feature from the reference image and the candidate features (many) from the target image. After a similarity measure (e.g., the minimum Euclidean distance) is defined, the computation of similarity among pair-wise features can be parallelized. Because a GCP/TP searching process involves numerous operations of feature extraction and matching, the performance gain in those computations is tremendous when parallelized.
3.5 Parallelization of DSM Extraction Algorithms
After images are properly georeferenced and aligned with each other, the main steps for extracting DSM from a pair of stereo images are first to build epipolar images, then to match common points between a pair of epipolar images, to compute parallax and elevation, to interpolate elevations in a raster grid from the points that have elevation extracted, and to filter the rasterized elevation values as the last step. The computation in building epipolar images is to align two images line by line and the alignment of one line is independent of another, which can hence be parallelized. Both matching points along an epipolar line and the computation of parallax and elevation happen in a small neighbourhood and can thus be executed simultaneously as well. Interpolation from known points depends on the selected points that are most likely near to those points to be interpolated, so the computation for elevation interpolation in a raster grid can be parallelized. Filtering (linearly) is about the convolution of an image with a small size kernel that is a typical local operator like most image processing algorithms, which can certainly be carried out in parallel. Parallelization of those computations in the above steps may result in a great gain in performance.
3.6 Hardware Configuration for High Performance
Computing
There are a few practices reported (Zhang & Huang, 2011) (Philip, et al., 2011) (Dai & Yang, 2011) (Fang, et al., 2014) to use GPU plus CPU to maximize the parallelization performance for a couple of reasons. The first reason is to use CPU to control multiple GPU devices if available. The second reason is to use CPU to control conditional flows and execute the less efficient parallelization code or the portion of parallelization that requires large I/O, while GPU takes the tasks with highly efficient parallelization code and less demanding of I/O.
The performance of storage (i.e., hard drive) and network may dampen maximizing the performance of parallelization generated by GPU plus CPU. This is particularly true for the processes that require intensive reading and writing of image from/to storage. A few strategies can be used to mitigate restrictions from hardware and network: 1. Use a high performance hard drive as a local disk for a processing node so that the data swapping speed between memory and hard drive does not cause too much latency for parallelization; 2. Use a high speed network so that the data transferring speed over network will have minimum latency for parallelization; 3. Minimize the frequency of data transferring over network by first preparing data in a local disk, processing the data in the local disk, generate intermediate data in the local disk, and archive the results to the central storage at the last stage.
4. EXPERIMENTS
4.1 Implementation
The above solution is implemented in a high performance processing system. It uses a clustering technology to manage computing resources (nodes) and distribute processes to the desired computing nodes. Four key modules are implemented: Data Ingestion, GCP collection, Bundle Adjustment, and DSM Extraction. The Data Ingestion process takes all scenes and distributes them to all available nodes so that each image can be imported simultaneously. The GCP Collection process also distributes all ingested images to all available nodes and collects GCPs for each image against a reference image independently and simultaneously. The Bundle Adjustment process divides all ISPRS Annals of the Photogrammetry, Remote Sensing and Spatial Information Sciences, Volume III-1, 2016
images into a few groups and then distributes each group to the available processing nodes for parallel TP collection, followed by consolidating all collected TPs and adjusting math models accordingly. The DSM extraction process handles each scene (three images) simultaneously by building epipolar pairs, matching common points and computing elevation, and then fusing individual DSMs into a final DSM.
The experiments below were conducted using the above implemented system to demonstrate the processing efficiency and capability of producing quality DSM products.
4.2 Test Data and Computing Environment
The study region for performance comparison covers an area of about 25,600 km² (i.e., 160km x 160km) in the centre of China. A total of 17 ZY-3 tri-stereo scenes or 51 images were selected according to the following criteria: minimum or free clouds and haze, acquisition dates between spring and fall, which was chosen to minimize the impact from lands/human build-ups covered by snow/ice. The reference image used for collecting GCPs is from Landsat 7 archives (before 2000) (USGS, 2015a). A different set of ZY-3 scenes was used for DSM accuracy assessment due to limitation of accessing high-resolution reference image and DEM data. This data set consists of three ZY-3 scenes, and each scene has landscapes of flat (at sea level of 80 meters), mountain (at sea level of 1,200 meters) and hill (or mixture of flat and mountain, at sea level of 800 meters) respectively. The reference image used for collecting GCPs has 2 meters planimetric accuracy at 2 meters resolution; the reference DEM used for extracting elevations for collected GCPs is from SRTM at 90 meters resolution; the reference DEM used for accuracy comparison has 3 meters vertical accuracy at 5 meters horizontal resolution.
The computing environment for performance comparison used a desktop computer configured with one Intel Core i7 (3rd
generation) processor (3.4GHz), 32GB memory, a commercial GPU card (NVIDIA GeForce GTX 660 with 1GB device memory), and three hard drive disks (7,200 RPM). The i7 CPU processor have four physical cores only but can be hyper-threaded into eight logical cores. Multiple processes (up to eight in general) from the above implemented system are allowed to be executed simultaneously in this single desktop environment. Particularly, eight simultaneous importing processes are allowed for its low cost in CPU but high in I/O; six simultaneous GCP/TP collection processes are allowed considering its intensive usage of both CPU and I/O; five DSM extraction processes are allowed when extracting DSMs for achieving a somewhat balanced usage between CPU and I/O.
4.3 Tests and Results
Computing performance is compared between a manual workstation system and the above high performance system. In the manual workstation system, each scene was processed (e.g., GCPs are collected manually) sequentially and hence the total processing time was calculated from the time for the single scene multiplied by the number of images (or pairs); in the high performance system, the time was the actual time elapsing for processing all scenes since multiple scenes can be processed simultaneously.
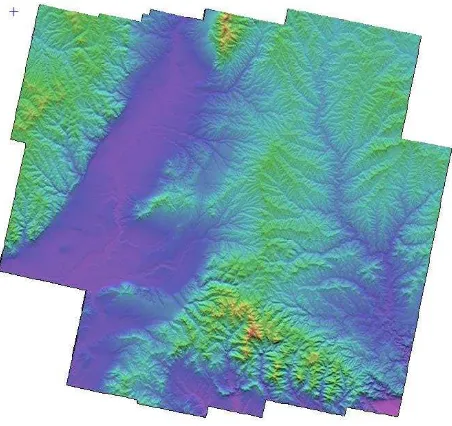
Figure 2. Merged DSM of the entire testing region Figure 2 depicts the DSM result covering the entire testing region, rendered in a coloured shade relief fashion. Table 1 (below) summarizes the timings measuring the performance from both the high performance system and the traditional one when generating a 30m DSM using all 51 images for the entire study region. The time required in the high performance system is more than 10 times faster than that required in the traditional one.
Table 1. Performance comparison between the high performance system and a traditional one
High Performance
(minutes)
Workstation (minutes)
Import 14.73 102.00
GCP Collection 19.00 1530.00
Bundle Adjustment 87.88 510.00
DEM Extraction 62.00 405.00
Total: 183.61 2547.00
The accuracy of the DSM results is assessed by comparing them with a 5m reference DEM. A random set of points (about 100 points, evenly distributed in each scene) are generated over the study area and then differences between two DSM/DEM are calculated. RMS (root mean square) is used to indicate the elevation difference for one comparison.
The table below (Table 2) illustrates the comparisons. It shows that all three stereo pairs generate almost similarly accurate DSM results, in which the backward-forward pair generates slightly less accuracy than the other two pairs and the merged results are more accurate (less than 5 meters or 1 pixel planimetric resolution) than those from any single pair (close to 6 meters). Since the majority of this area is mountainous and human build-ups are rare, the generated DSM is assumed as an approximate DEM for that area (without extending the topic of this paper to discuss the conversion of DSM to DEM).
Table 2. RMS of accuracy (elevation in meters) when comparing the results from each stereo pair with a reference
DEM
Merged Backward
-Forward
Backward -Nadir
Forward -Nadir
Flat 3.30 3.58 4.90 5.56
Mountain 4.49 8.20 5.42 5.27
Hill 5.67 6.26 7.02 6.55
Average 4.49 6.01 5.78 5.79
It is noted that the quality of the merged DSM is also better. Below figures show the quality comparisons between the merged one against those results from all individual pairs. It can be seen in Figure 3 that the merged one picks the best part (see Figure 4) from the forward-backward result (which is usually inferior to the results from the other two pairs in most areas) but also improves it slightly (smoother). The results from the backward-nadir and forward-nadir pairs have much more noise (which could be associated with blunders when matching) than the forward-backward result (see Figure 5 and Figure 6).
Figure 3. A sample from a merged DSM
Figure 4. A sample from the forward-backward DSM.
Figure 5. A sample from the backward-nadir DSM
Figure 6. A sample from the forward-nadir DSM
5. CONCLUSION AND DISCUSSION
The proposed solution and its corresponding implementation take advantage of high performance computing from parallel and distributed computing. The parallel computing accelerates the speed of processing individual scenes by leveraging the parallel computing power from multiple/many cores hardware. The distributed computing allows processing of multiple scenes simultaneously and hence achieves performance gain almost proportional to the number of processes (and processing nodes). The preliminary experiments conducted in this paper show that the performance of the high performance system is increased tenfold over traditional manual workstation-style systems. With computing performance gained through the high performance system, more combinations of the ZY-3 tri-stereo images can be processed and their results may be fused in order to generate more accurate and higher quality DSM products versus those from a single stereo pair. The initial experiments conducted in this paper are confirmation of our research ISPRS Annals of the Photogrammetry, Remote Sensing and Spatial Information Sciences, Volume III-1, 2016
hypothesis, and more research is required. It is expected to operate on a much larger data set, covering at least an area of multiple provincial territories within China, with data provided by the data provider after the DSM extraction function in the system (deployed in a cluster of multiple processing nodes) is fully operational. Future experiments are currently planned and they will provide more information to confirm the performance gain and the quality and accuracy of DSM results reported in this paper.
ACKNOWLEDGEMENTS
The authors are grateful for the full support from both organizations CRESDA (http://www.cresda.com) and PCI Geomatics (http://www.pcigeomaics.com) to complete this research. We would also like to thank Bonnie Harris who proof read this paper and put great effort in editing this paper.
REFERENCES
Akoguz, A. et al., 2013. Remote Sensing Data Fusion Algorithms with Parallel Computing. Istanbul, IEEE the 6th International Conference on Recent Advances in Space Technologies (RAST), pp. 87-92.
AMD, 2015. AMD Pro A-Series APUs. [Online] Available at: http://www.amd.com/en-us/solutions/pro [Accessed 08 December 2015].
Asano, S., Maruyama, T. & Yamaguchi, Y., 2009. Performance Comparison of FPGA, GPU and CPU in Image Processing. Prague, IEEE International Conference on Field Programmable Logic and Applications, pp. 126-131.
ASTER, 2015. ASTER GDEM. [Online]
Available at: http://gdem.ersdac.jspacesystems.or.jp/ [Accessed 08 December 2015].
Baike, 2015. Introduction of the Second National Land Survey. [Online]
Available at: http://baike.baidu.com/view/1712729.htm [Accessed 08 December 2015].
Bhojne, M., Chakravarti, A., Pallav, A. & V, S., 2013. High Performance Computing for Satellite Image Processing and Analyzing - A Review. International Journal of Computer Applications Technology and Research, 2(4), pp. 424-430. CRESDA, 2015. Chinese EO Satellites. [Online] Available at: http://www.cresda.com/site1/Satellite/3070.shtml [Accessed 08 December 2015].
Daga, M., Aji, A. M. & Feng, W.-C., 2011. On the Efficacy of a Fused CUP+ GPU Processor (or APU) for Parallel Computing. Knoxville, TN, IEEE Symposium on Application Accelerators in High-Performance Computing (SAAHPC), pp. 141-149. Dai, C. & Yang, J., 2011. Research on Orthorectification of Remote Sensing Images Using GPU-CPU Cooperative Processing. Tengchong, Yunnan, IEEE International Symposium on Image and Data Fusion (ISIDF), pp. 1-4. Deng, H. et al., 2014a. Builing High Performance System for Processing a Daily Large Volume of Chinese Satellites Imagery. Armsterdan, SPIE High-Performance Computing in Remote Sensing IV, Proceedings of SPIE, pp. 1-15.
Deng, H. et al., 2014b. Geometric Accuracy Assessment and Correction of Imagery from Chinese Earth Observation Satellites (HJ-1 A/B, CBERS-02C and ZY-3). Toronto, Canada, The International Archives of the Photogrammetry, Remote Sensing and Spatial Information Sciences, pp. 1-8.
El-Araby, E., El-Ghazawi, T., Moigne, J. L. & Irish, R., 2009. Reconfigurable Processing for Satellite On-board Automatic
Cloud Cover Assessment. Journal of Real-Time Image Processing, 4(1), pp. 245-259.
Fang, L., Wang, M., Li, D. & Pan, J., 2014. CUP/GPU Near Real-time Preprocessing for ZY-3 Satellite Images: Relative Radiometric Correction, MTF Compensation, and Geocorrection. ISPRS Journal of Photogrammetry and Remote Sensing, Volume 87, pp. 229-240.
Flynn, M. J., 1972. Some Computer Organizations and Their Effectiveness. IEEE Transactions on Computers, c-21(9), pp. 948-960.
Guo, H., 2012. China's Earth Observing Satellites for Building a Digital Earth. International Journal of Digital Ea rth, 5(3), pp. 185-188.
Guo, K., Wang, J. & Wang, Y., 2015. Application of ZY-3 Remote Sensing Image in the Research of Huashan Experimental Watershed. Guangzhou, China, Remote Sensing and GIS for Hydrology and Water Resources, pp. 51-56.
Hager, G. & Wellein, G., 2010. Introduction to High Performance Computing for Scientists and Engineers. 1st ed. s.l.:Chapman & Hall/CRC.
Huang, X., Wen, D., Xie, J. & Zhang, L., 2013. Quality Assessment of Panchromatic and Multispectral Image Fusion for the ZY-3 Satellite: From an Information Extraction Perspective. IEEE Geoscience and Remote Sensing Letters, 11(4), pp. 753-757.
Jiang, Y.-h.et al., 2014. Geometric Calibration and Accuracy Assessment of ZiYuan-3 Multispectral Images. IEEE Transactions on Geoscience and Remote Sensing, 52(7), pp. 4161-4172.
Jiang, Y. et al., 2013. High Accuracy Geometric Calibration of ZY-3 Three-Line Image. Acta Geodaetica et Cartographica Sinica, 42(4), pp. 523-529.
Jones, D. R., Jurrus, E. R., Moon, B. D. & Perrine, K. A., 2003. Gigapixel-size Real-time Interactive Image Processing with Parallel Computers. Nice, France, IEEE International Parallel and Distributed Processing Symposium, pp. 1-7.
Khronos, 2015. The Open Standard for Parallel Programming of
Heterogeneous Systems. [Online]
Available at: https://www.khronos.org/opencl/ [Accessed 08 December 2015].
Krishma, G., Amitabh, B., Srinivasan, T. P. & Srivastava, P. K., 2008. DEM Generation from High Resolution Multi-View Data Product. s.l., The Internation Archives of the Photogrammetry, Remote Sensing and Spatial Information Scienes, pp. 1099-1102. Lee, C. A. et al., 2011. Recent Developments in High Performance Computing for Remote Sensing: A Review. IEEE Journal of Selected Topics in Applied Earth Observations and Remote Sensing, 4(3), pp. 508-527.
Li, D., 2012. China's First Civilian Three-line-array Stereo Mapping Satellite: ZY-3. Acta Geodaetica et Cartographica Sinica, 41(3), pp. 317-322.
Liu, B., Sun, X.-l., Di, K.-c. & Liu, Z.-q., 2012. Accuracy Analysis and Validation of ZY-3's Sensor Corrected Products. Remote Sensing for Land & Resources, 24(4), pp. 36-40. Merigot, A. & Petrosino, A., 2008. Parallel Processing for Image and Video Processing: Issues and Challenges. Parallel Computing, 34(12), pp. 694-699.
OpenCV, 2015. Home of OpenCV. [Online]
Available at: http://opencv.org/
[Accessed 08 December 2015].
OpenVIDIA, 2015. OpenVIDIA: Parallel GPU Computer
Vision. [Online]
Available at: https://www.openhub.net/p/openvidia [Accessed 08 December 2015].
Owens, J. D. et al., 2007. A Survey of General-Purpose Computation on Graphics Hardware. Computer Graphics Forum, 26(1), pp. 80-113.
Pachowics, P. W., 1989. Image Processing by Software Parallel Computation. Image and Vision Computing, 7(2), pp. 122-128. Pan, H. et al., 2013. Accuracy Analysis and Verification of ZY-3 Products. Acta Geodaetica et Cartographica Sinica, 42(5), pp. 738-744.
Philip, S., Summa, B., Pascucci, V. & Bremer, P.-T., 2011. Hybrid CPU-GPU Solver for Gradient Domain Processing of Massive Images. Tainan, IEEE 17th International Conference on Parallel and Distributed Systems (ICPADS), pp. 244-251. Plaza, A. J. & Chang, C.-I., 2007. High Performance Computing in Remote Sensing. 1st ed. Boca Raton, FL: Chapman & Hall/CRC.
Pollard, T., Eden, I., Mundy, J. L. & Cooper, D. B., 2010. A Volumetric Approach to Change Detection in Satellite Images. ASPRS Journal of Phtogrammetric Engineering & Remote Sensing, 76(7), pp. 817-831.
SBSM, 2015. The First National Census of Geographic
Conditions. [Online]
Available at:
http://chzt13.sbsm.gov.cn/article/zxgz/dycdlsqpc/gzjb/ [Accessed 08 December 2015].
Seinstra, F. J., Koelma, D. & Geusebroek, J. M., 2002. A Software Achiteture for User Transparent Parallel Image Processing. Parallel Computing, 28(7-8), pp. 967-993.
Stevenson, R. L., Lumsdaine, A., Squires, J. M. & Mcnally, M. P., 2000. Parallel and Distributed Algorithms for High-speed Image Processing, Rome, New York: National Technical Information Service (NTIS).
Sun, N., Kahaner, D. & Chen, D., 2010. High-performance Computing in China: Research and Applications. International Journal of High Performance Computing Applications, 24(4), pp. 363-409.
Tang, X. et al., 2013. Triple Linear-Array Image Geometry Model of ZiYuan-3 Surveying Satellite and Its Validation. International Journal of Image and Data Fusion, 4(1), pp. 33-51. Tang, X. et al., 2015. Verification of ZY-3 Satellite Imagery Geometric Accuracy Without Ground Control Points. IEEE Geoscience and Remote Sensing Letters, 12(10), pp. 2100 - 2104. Tsuchiyama, R. et al., 2012. The OpenCL Programming Book. s.l.:Fixstars.
USGS, 2015a. FREE Global Orthorectified Landsat Data. [Online]
Available at: http://earthexplorer.usgs.gov/ [Accessed 08 December 2015].
USGS, 2015b. Shuttle Radar Topography Mission. [Online] Available at: http://srtm.usgs.gov/index.php [Accessed 08 December 2015].
Wang, T. et al., 2014. Geometric Accuracy Validation for ZY-3 Satellite Imagery. IEEE Geoscience and Remote Sensing Letters, 11(6), pp. 1168-1171.
WikiPedia, 2015a. Cell (Microprocessor). [Online] Available at: http://en.wikipedia.org/wiki/Cell_(microprocessor) [Accessed 08 December 2015].
WikiPedia, 2015b. FLOPS. [Online]
Available at: http://en.wikipedia.org/wiki/FLOPS#cite_note-en.community.dell.com-1
[Accessed 08 December 2015].
WikiPedia, 2015c. List of Nvidia Graphics Processing Units. [Online]
Available at:
http://en.wikipedia.org/wiki/Comparison_of_Nvidia_graphics_p rocessing_units
[Accessed 08 December 2015].
WikiPedia, 2015d. Microprocessors Chronology. [Online]
Available at:
http://en.wikipedia.org/wiki/Microprocessor_chronology [Accessed 08 December 2015].
WikiPedia, 2015e. Computer Cluster. [Online] Available at: https://en.wikipedia.org/wiki/Computer_cluster [Accessed 08 December 2015].
Wyawahare, M. V., Patil, P. M. & Abhyankar, H. K., 2009. Image Registration Techniques: An Overview. International Journal of Signal Processing, Image Processing and Pattern Recognition, 2(3), pp. 11-27.
Xue, Y., Xie, W., Du, Q. & Sang, H., 2015. Performance Evaluation of DSM Extraction from ZY-3 Three-line Arrays Imagery. Kona, Hawaii, 2015 International Workshop on Image and Data Fusion, pp. 247-253.
Xu, W., Gong, J. & Wang, M., 2014. Development, Application, and Prospects for Chinese Land Observation Satellites. Geo-spatial Informaition Science, 17(2), pp. 102-109.
Xu, W., Long, X., Yu, W. & Li, Q., 2012. Geometric Quality Analysis of Three-line Array CCD Imagery of ZY-3 Satellite. Spacecraft Recovery & Remote Sensing, 33(3), pp. 55-63. Zhang, C. & Huang, D., 2011. Study of GPU and CPU Collective in Matching Data Flow. Procedia Engineering, Volume 15, pp. 4068-4072.
Zhang, Y., Du, F. & Zhu, C., 2012. DEM Extraction and Accuracy Assessment Based on ZY-3 Stereo Images. Changchun, IEEE the 2nd International Conference on Computer Science and Network Technology (ICCSNT), pp. 1439 - 1442.
Zhang, Y. et al., 2014. On-Orbit Geometric Calibration of ZY-3 Three-Line Array Imagery With Multistrip Data Sets. IEEE Transactions on Geoscience and Remote Sensing, 52(1), pp. 224-234.
Zitova, B. & Flusser, J., 2003. Image Registration Methods: A Survey. Image and Vision Computing, 21(11), pp. 977-1000. ISPRS Annals of the Photogrammetry, Remote Sensing and Spatial Information Sciences, Volume III-1, 2016