ANALYSIS OF DEBRIS FLOW DISASTER DUE TO HEAVY RAIN BY X-BAND MP
RADAR DATA
M. Nishio a, *, M. Mori b
a
Graduate School of Humanity-Oriented Science and Engineering, Kinki University, 8208555 Iizuka City, Fukuoka, Japan - [email protected]
b
Dept. of Information Science, School of Humanity-Oriented Science and Engineering, Kinki University, 8208555 Iizuka City, Fukuoka, Japan – [email protected]
Commission VIII, WG VIII/1
KEY WORDS: M X-band MP radar, GIS, Disaster prevention, Web-based
ABSTRACT:
On August 20 of 2014, Hiroshima City (Japan) was struck by local heavy rain from an autumnal rain front. The resultant debris flow disaster claimed 75 victims and destroyed many buildings. From 1:30 am to 4:30 am on August 20, the accumulated rainfall in Hiroshima City exceeded 200 mm. Serious damage occurred in the Asakita and Asaminami wards of Hiroshima City. As a disaster prevention measure, local heavy rain (localized torrential rains) is usually observed by the Automated Meteorological Data Acquisition System (AMeDAS) operated by the Japan Meteorological Agency (JMA) and by the C-band radar operated by the Ministry of Land, Infrastructure, Transport and Tourism (MLIT) of Japan, with spatial resolutions of 2.5 km and 1 km, respectively. The new X-band MP radar system enables more detailed rainfall observations than the C-band radar. In fact, this radar can observe local rainfall throughout Japan in near-real time over a minimum mesh size of 250 m. A fine-scale accumulated rainfall monitoring system is crucial for disaster prevention, and potential disasters can be alerted by the hazard levels of the accumulated rainfall.
* Corresponding author
1. INTRODUCTION
As warm wet air flowed toward a stationary front that had stagnated in the Sea of Japan, the atmosphere above Hiroshima Prefecture destabilized, dumping severe rain around Hiroshima City from the night of August 19 to the dawn of August 20, 2014. Localized torrential rain fell from Asaminami Ward to Asakita Ward of Hiroshima City, which was sourced from linear rainbands. The precipitation exceeded 200 mm in 3 h and generated a large-scale debris flow.
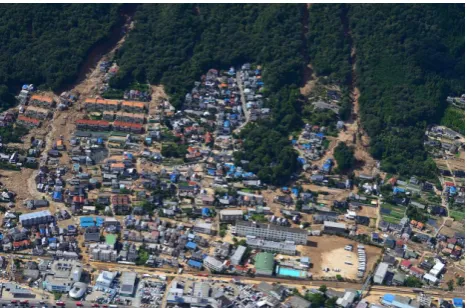
Kabe Ward and several districts of Asaminami Ward (Yagi, Yamamoto, and Midorii), Hiroshima City, are located on steep land. The landslide damage in the vicinity of Yagi following the August 20 downpour is photographed in Figure 1.
Figure 1. Sediment disaster (Hiroshima City Asaminami Ward Yagi ).
Decomposed granite soil that weathers the Hiroshima granite piles on the hilly terrain stretching to the Ota River basin in Asaminami Ward. Asakita Ward occupies the northern part of the city region, which is geographically and geologically vulnerable to slope failure and debris flow induced by localized torrential rain. The August 20, 2014, sediment disaster was the most severe in Japan throughout the past 30 years, resulting in 74 deaths. This damage exceeded even the large-scale landslide disaster that struck Hiroshima City on June 29, 1999 (the so-called disaster by June 29 downpours).
The August 20, 2014, downpour also caused a river disaster at approximately 4:20 am. Flooding occurred in the Kabe 3-chome vicinity of Nenotani River at the Ota River tributary. Landslide-related disasters occurred at 166 sites (107 and 59 sites were damaged by debris flow and landslides, respectively). Adding the damages caused to public utilities such as roads, bridges, and riverbanks, the number of damaged sites rose to 1,333.
To prevent rain-related disasters, localized heavy rain (localized torrential rains) in Japan is usually observed by the Automated Meteorological Data Acquisition System (AMeDAS) operated by the Japan Meteorological Agency (JMA) and by the C-band radar operated by the Ministry of Land, Infrastructure, Transport and Tourism (MLIT) of Japan, with spatial resolutions of 2.5 km and 1 km, respectively. Rainfall analysis (downpour analysis) using AMeDAS and the MLIT C-band radar of JMA has been extensively reported (Yamamoto et al., 2015).
However, the spatial resolutions of AMeDAS and C-band radar (which recorded the Hiroshima City downpour on August 19-20, 2014) are inadequate for precise rainfall measurements. Therefore, they could not precisely predict the
debris flow disasters in Asakita and Asaminami wards. In the same period, the rainfall data in Hiroshima City was also observed by the X-band Multi-Parameter (MP) radar system. This new radar system acquires more detailed rainfall observations than the C-band radar. X-band MP radar can observe local rainfall in near-real time throughout Japan's territory, supporting appropriate disaster prevention activity. Its minimum observation area is a 250 m mesh.
The X-band MP radar accurately measured the rainfall data in Asakita and Asaminami wards at the time of the disaster. However, the special data structure of the radar is difficult to process by GIS or other software. Moreover, the X-band MP radar data have never been accumulated in a rainfall monitoring system. Therefore, we developed a new system using a web-based interface in a GIS framework. The accumulated rainfall monitoring system (Nishio et al., 2015) is crucial for disaster prevention.
JMA has provided a standard for the rain situation (strength of rain), which shows the hazard levels of the precipitation in one hour. These hazard levels of the accumulated rainfall amount are important for estimating disaster occurrences. Using the rainfall data of the MLIT X-band MP radar for Asakita and Asaminami wards in Hiroshima City, which experienced a large-scale sediment disaster (landslide), this study analyzes the outline and features of the August 2014 downpour.
2. METEOROLOGICAL STATE
In the August 2014 event, the rain front and damp air current over Japan were approached by a two-horn typhoon (No.11 and No.12). The resultant heavy rain persisted over the whole country, devastating many regions from Hokkaido to Kyushu.
The heavy rain and the flood advisory were announced in Hiroshima City on August 19(16:03). In addition, the heavy rain and the flood warning were announced at 21:26. Wet, warm air flew from the night of August 19 to the dawn of August 20, intercepting the front that had stagnated in the Sea of Japan in the Hiroshima area. This activity greatly destabilized the atmosphere, inducing heavy rain.
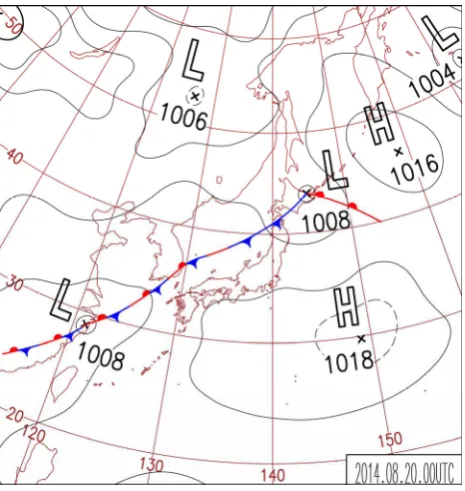
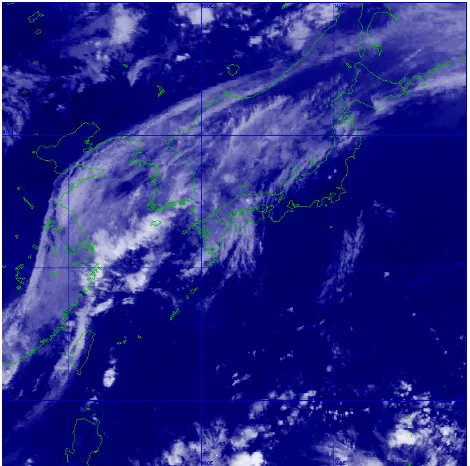
Around the prefectural boundary of Hiroshima and Yamaguchi prefectures, successive cumulonimbus groups (approximately 3-5 cumulonimbus) passed through the sky over Hiroshima City. The linear precipitation belt maintained in the same region became an intense heavy rain. The concentrated rain is presumably sourced from the line of successive cumulonimbus (the so-called black building phenomenon). Figure 2 shows the weather chart of JMA at 0:00 of August 20, 2014, and Figure 3 is JMA's (infrared) weather satellite image at 3:40 of the same day. The infrared images of the Meteorology Satellite of the Meteorological Agency correctly captured the developing cumulonimbus. Hiroshima City was approximately 300 km south of the front-which widened to approximately 500 km, reaching the Sea of Japan from the East China Sea (its location was the south end of a damp area in the sky). This position typifies heavy rain generation during the rainy season.
The JMA Hiroshima Local Meteorological Observatories (Hiroshima City Asakita Ward Miiri) recorded a maximum of 101.0 mm precipitation per hour during the August 20 event. In 3 h, the maximum local precipitation reached 217.5 mm. In 24 h, the value reached 257.0 mm, which is the highest in JMA's observational history.
The local downpour continued until the pre-dawn of August 20. In Asakita Ward, the maximum hourly precipitation
reached 121mm and the accumulated precipitation was 287 mm after 24 h. Table 1 shows the precipitation accumulated per hour in the JMA AMeDAS Hiroshima Prefecture from 10:00 August 19 to 15:00 August 20. The accumulated precipitations are graphed in Figure 4. The maximum hourly and 24 h precipitations in the Asaminami Ward region were 87 mm and 247 mm, respectively. This chain of heavy rains has been called "Downpour in August 2014" by the Meteorological Agency.
Figure 2. JMA weather chart (0:00 August 20, 2014).
3. ANALYSIS OF PRECIPITATION INFORMATION
The X-band MP radar observes local rainfall in near-real time. Therefore, the data of flood damage and landslide disaster caused by localized torrential and heavy rains (downpours) can be analyzed for appropriate river management and disaster-prevention activity. The X-band MP radar collects detailed observations of regional heavy rain in real time (observation radius = 60 km, versus 120 for the C-band radar), which is suitable for gauging large-area rainfall. The high resolution of the X-band MP radar is enabled by its shorter wavelength (8-12 GHz) than that of the C-band radar (4-8 GHz). The raindrop shape can be understood by transmitting vertically and horizontally polarized light. The rainfall can be deduced from the flatness and other shape properties of the raindrops. Such highly accurate rainfall data collected in real time require no correction by the ground rain gauge.
The movement direction and transfer rate of the raindrops, which are useful for rainfall prediction, can be deduced from the Doppler function. The X-band MP radar can observe at a 5 times higher frequency and 16 times higher resolution than the C-band radar. Its minimum observation area is a 250 m mesh, and its delivery period is 1 min.
However, the special data structure of the X-band MP radar is difficult to process by GIS or other software. Therefore, to enable compatibility with GIS, we developed original software. A flowchart of the software is shown in Figure 5, and the conversion of the X-band MP radar rainfall data into GIS data is shown in Figure 6.
Using the rainfall data collected by the X-band MP radar during August 19-20 of 2014 and GIS, we analyzed the expansion range of the forecasted disaster generation point. The JMA weather information (AMeDAS) is a basic climate observing system that covers the Japanese territory. Figure 7 shows the information on the observation point in the JMA AMeDAS Hiroshima Prefecture.
Precipitation information during the disaster (2014.8.19-20) was captured by the regional observing system (AMeDAS) of JMA. The JMA AMeDAS system is commonly used by local governments. Prior to data analysis at disaster sites, the JMA AMeDAS precipitation information is input to a GIS. Moreover, the rainfall information of the X-band MP radar is input to GIS for rainfall analysis. The Hiroshima Local Meteorological Observatories reported severe rainfall around Hiroshima City, which persisted from the night (19:00) of August 19 to the dawn (4:00) of August 20 around Hiroshima City. At the Asakita Ward Uehara observation point, the rain gauge recorded 115 mm of rainfall from 2:00 to 3:00 and 92 mm from 3:00 to 4:00 at Hiroshima Prefecture. The JMA AMeDAS at the Miiri observation point recorded a total rainfall of 243 mm during 1:00-4:00 on August 20.
Table 1. Hourly precipitation measured by JMA AMeDAS (2014.08.19 10:00 - 2014.08.20 15:00).
Date Miiri Tsushimi Midori Hiroshima
8/19 10:00 0 0 0 0
Here, we analyzed the rainfall information acquired by the X-band MP radar in the vicinity of the Miri observation point (AMeDAS) in Asakita Ward, where a disaster event occurred. The site was almost centralized in a region of localized torrential rain. Figures 8-11 present the precipitation information captured by the X-band MP radar during 1:00-4:00 and input to the GIS. The images confirm that the X-band MP radar correctly captured the localized torrential rain. To thoroughly analyze the rainfall amount in the disaster region, we also prepared a GIS visualization (isohyetal map). Figure 12 shows the result of the rainfall analysis based on the X-band MP radar. The regional rainfall amount was accurately analyzed by our system using X-band MP radar data.
Figure 3. JMA weather satellite image (3:40 August 20, 2014).
0
10:0011:008/1912:008/1913:008/1914:008/1915:008/1916:008/1917:008/1918:008/1919:008/1920:008/1921:008/1922:008/1923:008/1924:008/198/201:008/202:008/203:008/204:008/205:008/206:008/207:008:008/208/209:0010:008/2011:008/2012:008/2013:008/2014:008/2015:008/20
Miiri Tsushimi Midori Hiroshima
(mm)
Figure 4. Accumulated precipitation for one hour of Hiroshima Prefecture region of JMA AMeDAS.
X‐band MP data (binary)
X‐Band MP data (Amount of rainfall) X‐band MP data Convert
(text)
X‐band MP data Convert (img bmp‐data)
X‐band MP data Convert (img bmp‐data)
X‐band MP data Convert (bmp Geofile)
Img bmp‐data Geofile
X-band MP data extracted (rainfall data)
X-band MP data Convert (Geo-img-data)
X-band MP Geo-img-data X-band MP data Convert
(img-data)
Figure 5. The flow of processing of the conversion of the GIS data of the X-band MP radar rainfall data is shown.
Figure 6. Conversion result of the rainfall data measured by the X-band MP radar (2014.08.20 01:00).
Figure 7. Information on observation point in the vicinity of JMA AMeDAS of Hiroshima Prefecture.
Figure 8. Result of taking rainfall information of the X-band MP radar into GIS (2014.08.20 1:00).
Figure 9. Result of taking rainfall information of the X-band MP radar into GIS (2014.08.20 2:00).
Figure 10. Result of taking rainfall information of the X-band MP radar into GIS (2014.08.20 3:00).
Miiri
Figure 11. Result of taking rainfall information of the X-band MP radar into GIS (2014.08.20 4:00).
Figure 12. Analysis of rainfall data collected by the X-band MP radar (2014.08.20 4:00).
4. APPLICATION TO DISASTER PREVENTION
INFORMATION
4.1 Sediment disaster
The downpour of August 2014 and resultant large-scale debris flow caused much personal suffering and severe material damage. Among the 166 materially damaged sites, landslides occurred at 59 sites (36%) and debris flow affected 75 sites (64%) (as of September 3, 2014, announced by Hiroshima Prefecture). Damage was caused by the large amount of rain water deposited during the downpour.
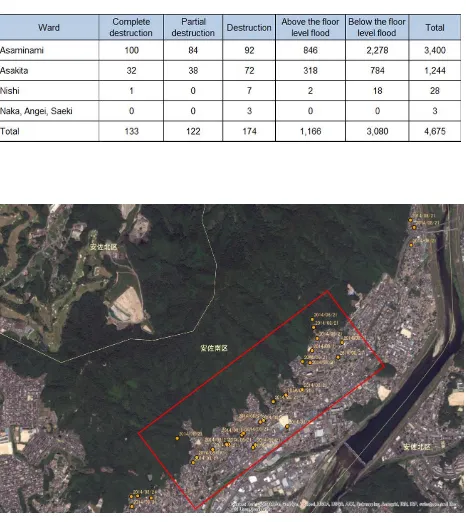
Personal suffering was concentrated in the green well and Yagi districts of Asaminami Ward. Fifty-two of the 74 reported deaths (70%) occurred in the Yagi district. Debris flew into the densely housed neighborhood in the Yagi district, causing severe damage to properties. Building damages were severe throughout the Hiroshima City. Among the damaged houses, 133 were completely destroyed, 122 were partially destroyed, and 1,301 were damaged by flooding above floor level. Tables 2 and 3 show the breakdowns of personal suffering and housing damage in the Hiroshima region, respectively.
Many of the geological features in the region struck by the downpour are composed of granite, which is easily weathered. The area covered by the decomposed granite soil in Hiroshima Prefecture is thought to have expanded by approximately 48%, generating shallow landslides. Moisture had accumulated in the soil under the continued rainfall. Post-disaster investigation revealed decomposed weathered granite on the ground and outflows of comparatively hard materials such as sedimentary rocks.
In Asaminami Ward Yagi 3, a large-scale disaster site, the debris flow exceeded 40 km/h and momentarily peaked at 144 km/h. Figure 13 shows the locations of the earth and sand deposition. Figures 14-18 are photographs of the landslide disaster sites in the Hiroshima Prefecture. Figure 19 shows the visualization of the rainfall measured by the X-band MP radar.
Table 2. Personal suffering (Hiroshima City region).
Ward District Death serious or
slight injury Total
Yagi 52 20 72
Midorii 14 11 25
Yamamoto 2 0 2
Miiri 1 1 2
Kabe, Kabehigashi 5 11 16
Obayashi 0 1 1
Total 74 44 118
Asaminami
Asakita
Table 3. House damage(Hiroshima region).
Figure 13. The landslide disaster generation location is shown.
Figure 14. Asaminami Ward Yagi district (1).
Figure 15. Asaminami Ward Yagi district (2).
Figure 16. Asaminami Ward Yagi the district (3).
Figure 17. Asaminami Ward green well district (1).
Figure 18 . Asaminami Ward green well district (2).
4.2 Application to disaster prevention
The local government is investigating sediment disasters in the Hiroshima region of Japan. Many of the sediment disasters were likely generated by the heavy rain. Sediment danger is alerted during heavy rainfalls (≥20 mm/h) or when the total rainfall exceeds 100 mm. Heavy and persistent rains might lead to landslide disaster. Japan has implemented a precaution shelter standard against sediment disaster (Table 4). In the event of potential sediment damage and risk to human life, the local government orders residents to evacuate to the directed shelter. The evacuation order provides shelter preparation information, an evacuation order, and an evacuation directive. When heavy rain increases the landslide disaster risk, the local government and JMA jointly announce information on landslide disaster attention.
Our new system can analyze the amount of accumulated rainfall, which is important for landslide disaster prevention.
Table 4. Precaution shelter standard of sediment disaster
Shelter preparation information Evacuation order Evacuation directive
A continuous rainfall until the day before is 100mm or more.
The daily rainfall on that day is 50mm or more.
Daily rainfall 50mm or more on that day When the heavy rain of 30mm or more in the amount of rainfall per hour is expected.
When forerunning phenomenon of the landslide disaster is admitted When the landslide disaster is generated.
A continuous rainfall until the day before is 40-100mm or more.
The daily rainfall on that day is 80mm or more.
The daily rainfall on that day is 80mm or more.
When the heavy rain of the rainfall 30mm or more in time is expected.
When forerunning phenomenon of the landslide disaster is admitted When the landslide disaster is generated.
There is no rainfall until the day before.
The daily rainfall on that day is 100mm or more.
The daily rainfall on that day is 100mm or more.
When the heavy rain of the rainfall 30mm or more in time is expected.
When forerunning phenomenon of the landslide disaster is admitted When the landslide disaster is generated.
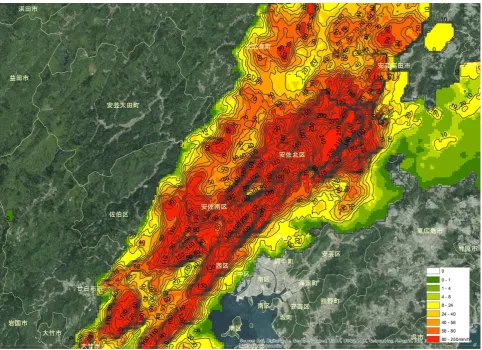
Figure 19. Amount of accumulated rainfall measured by the X-band MP radar (2014 1:00–4:00, August 20).
5. CONCLUSIONS
Monitoring the accumulated rainfall is crucial for disaster prevention. JMA provides a standard for the rain situation (strength of rain), which shows the hazard levels of hourly rainfall amounts. These hazard levels are important for estimating disaster occurrences. The rainfall accumulated over four hours (1:00-4:00 during the August 20 downpour) was visualized by GIS in our new system. By visualizing the rainfall measured by the X-band MP radar at the disaster site in Asaminami Ward, we could compare our results with the accumulated rainfall measured by AMeDAS. The images were very similar, although the hourly rainfall was slightly larger in the AMeDAS data than the X-band MP radar data. However, the difference is not critical. The areas of maximum accumulated rainfall (up to 200 mm) in Asaminami Ward coincided with sites of debris flow and landslide disasters. In summary, the X-band MP radar appears to be necessary for estimating precise locations of heavy rain, because of its higher resolution than those of AMeDAS and the C-band radar. If refuge information were appropriately issued in Hiroshima City, human losses would have been greatly reduced during the August 2014 flooding.
ACKNOWLEDGEMENTS
We thank MLIT for providing X-band MP radar data and the technical data. We thank JMA for weather information and technological material. This work was supported by MEXT Grant-in-Aid for Scientific Research (C) Grant Number 25350510.
REFERENCES
H. Yamamoto, H. Kobayashi: Characteristics of Heavy Rainfall and Debris Flow Disaster in Hiroshia City by Akisame-front, 20 August 2014, J. JSNDS, Vol.33, No.3, pp.293-312, 2014.
M. Nishio, M. Mori: The Web-based accumulated rainfall amount monitoring system by X-band MP radar, Journal of Flood Risk Management, in published online: 21 AUG., jfr3.12196, 2015.
Kato, A., Maki, K., 2009. Localized Heavy Rainfall near Zoshigaya: Tokyo, Japan on 5 August 2008 Observed by X-band Polarimetric Radar. SOLA, 5, 89-92.
Sakurai, N., Iwanami, K., Maesaka, T., Suzuki, S., Shimizu, S., Misumi, R., Misumi, R., Kim, D., Maki, M., 2012. Case Study of Misoscale Convective Echo Behavior Associated with Cumulonimbus Development Observed by Ka-band Doppler Radar in the Kanto Region: Japan. SOLA, 8, 107-110.
Kobayashi, F., Takano, T., Takamura, T., 2011. Isolated Cumulonimbus Initiation Observed by 95-GHz FM-CW Radar, X-band Radar, and Photogrammetry in the Kanto Region: Japan. SOLA, 7, 125-128.
Hirano, K., Maki, M., 2010. Method of VIL Calculation for X-band Polarimetric Radar and Potential of VIL for Nowcasting of Localized Severe Rainfall: Japan. SOLA, 6, 89-92.
Diss, S., Testud, J., Lavabre, J., Ribstein, P., Moreau, E., Parent du Chatelet, J., 2009. Ability of a dual polarized X-band radar to estimate rainfall: Advances in Water Resources, 32-7, 975-985.
Vieux, B.E., Imgarten, J.M., 2012. On the scale-dependent propagation of hydrologic uncertainty using high-resolution X-band radar rainfall estimates: Atmospheric Research, 103, 96-105.
Thorndah, S., Rasmussen, M.R., 2012. Marine X-band weather radar data calibration: Atmospheric Research, 103, 33-44.
Anagnostoua, M.N., Kalogirosb, J., Anagnostou, E.N., Tarolli, M., Papadopoulos, A., Borga, M., 2010. Performance evaluation of high-resolution rainfall estimation by X-band dual-polarization radar for flash flood applications in mountainous basins: Journal of Hydrology, 394, 4-16.
GABELLA, M., et al.: 2008. A portable low-cost X-band RADAR for rainfall estimation in alpine valleys, the report of the project FORALPS by Universita degli Studi di Trento, 1-52.
Nazrul, Md., ISLAM et al.: 2005. Characteristics of Precipitation Systems Analyzed from Radar Data over Bangladesh: Journal of Natural Disaster Science, Vol.27, No. l, 17-23.
Nishio, M., Mori, M., 2012. Web-based Delivery System for Disaster Prevention Information using a New JMA DPI XML Format and AMeDAS Data: ISPRS Annals of the Photogrammetry, Remote Sensing and Spatial Information Sciences, Volume 1-4, 23-27.
VandeBeek, C.Z., et al: 2009. Performance of high-resolution X-band radar for rainfall measurement in The Netherlands: Hydrology and Earth System Sciences Discussions, Vol.6, 6035-6085.
The Ministry of Land, Infrastructure, Transport and Tourism of Japan. Rainfall information of X-band MP radar web site. Available at http://www.river.go.jp/xbandradar (1 Feb. 2015).
Japan Meteorological Agency. Disaster prevention information web site. Available at http://www.jma.go.jp/ (1 Feb. 2015).
Hiroshima District Meteorological Observatory, JMA. Disaster prevention information web site. Available at http://www.jma-net.go.jp/hiroshima/ (1 Feb. 2015).
Hiroshima Prefectural government, Japan. Disaster prevention information web site. Available at http://www.pref.hiroshima.lg.jp/ (1 Feb. 2015).
Hiroshima City, Japan. Disaster prevention information web
site. Available at h http://www.city.hiroshima.lg.jp/english/emegencies/ (1 Feb.
2015).