New Approach for forest inventory estimation and timber harvesting planning in mountain
areas: the SLOPE project
F. Prandi a*, D. Magliocchetti a, A.Poveda b, R. De Amicis a, M. Andreolli a, F. Devigili a,
a Fondazione GraphiTech via alla cascata 56/c 38123 Trento Italy (federico.prandi, daniele.magliocchetti, raffaele.de.amicis, michele.andreolli, federico.devigili)@graphitech.it
b National Software Centre, NSC Campus, Mahon, Co. Cork, Ireland - jpoveda@treemetrics.com
Commission III, WG III/5
KEY WORDS: Digital Forest models, 3D, Terrestrial Laser scanning, UAV, Computer Graphics, Forest production
ABSTRACT:
Forests represent an important economic resource for mountainous areas being for a few region and mountain communities the main form of income. However, wood chain management in these contexts differs from the traditional schemes due to the limits imposed by terrain morphology, both for the operation planning aspects and the hardware requirements. In fact, forest organizational and technical problems require a wider strategic and detailed level of planning to reach the level of productivity of forest operation techniques applied on flatlands.
In particular, a perfect knowledge of forest inventories improves long-term management sustainability and efficiency allowing a better understanding of forest ecosystems. However, this knowledge is usually based on historical parcel information with only few cases of remote sensing information from satellite imageries. This is not enough to fully exploit the benefit of the mountain areas forest stocks where the economic and ecological value of each single parcel depends on singletree characteristics.
The work presented in this paper, based on the results of the SLOPE (Integrated proceSsing and controL systems fOr sustainable forest Production in mountain arEas) project, investigates the capability to generate, manage and visualize detailed virtual forest models using geospatial information, combining data acquired from traditional on-the-field laser scanning surveys technologies with new aerial survey through UAV systems. These models are then combined with interactive 3D virtual globes for continuous assessment of resource characteristics, harvesting planning and real-time monitoring of the whole production.
1. INTRODUCTION
1.1 Motivation
Forests represent an important economic resource for mountainous areas: for many region and mountain’ communities it is the main form of income. In the last decades the wood production in Europe, Russia and South-America grew, highlighting a trend, confirmed at least until 2030 (FAO, 2010). However, wood chain management in these contexts differs from the traditional schemes due to the limits imposed by terrain morphology, both for the operation planning aspects and the hardware requirements.
Specific design, complex extraction and reduced accessibility slow down operations, increase costs and reduce market competitiveness. A wider strategic and detailed level of planning might be crucial to reach the level of productivity of forest operation techniques applied on flatlands.
Forest information systems (FIS) are tools providing decision makers with comprehensive information for a better decision management. The increasing amount of available data, the need for spatial reasoning, the desire to share distributed information and the impressive potential of modern computer technology needs to be made available for the thorough management of forests. FIS allow informed decisions and support the maintenance and enhancement of the multiple forest functions.
* Corresponding author
The work presented in this paper is based on the results of the SLOPE (Integrated proceSsing and controL systems fOr sustainable forest Production in mountain arEas) aimed to develop an integrated Forest Information System (FIS) to optimize forest production in mountainous area. The goal of the project is to provide methodologies and tools supporting wood harvesting in mountainous scenarios combining forest geographic data ranging from wide area spatial information to singletree details, within a three-dimensional virtual globe and a structural model for continuous and real-time assessment of the resource characteristics.
Visualization is one of the most rapidly advancing computer technologies for forest management. It can be used to display trees, stands, and forested landscapes using 2D, 3D, or 4D animations in virtual environments. In mountain environments, 3D forest visualization can help forest managers to better understand habitat disturbance, visual impacts, operational considerations, as well as overall or specific designed features of forest management activities.
1.2 State of the Art and progress beyond
which allows a rapid measurement and acquisition of below-canopy 3D forest.
1.3 Organization of the document
The paper includes five main parts. After a first introduction, chapter 2 describes a methodology for collecting, processing organizing and visualizing data representing the backbone of the system while chapter 3 focuses on the 3D visualization tool to support the forest management and decision system. Finally, chapter 4 presents the case study applied to a forest stand in Trentino region with some conclusions in chapter 5.
2. METHODOLOGY
Improving access to forest information and adoption of digital information systems was formally recognized as a priority by the United Nations Conference on Environment and Development within Agenda 21, Chapter 40 (UNCED, 1992).
Forest resource managers need details for the construction of an adequate technical knowledge base on which they can make the relevant decisions for the sustainable management of forest in accordance with a profitable use of the resources. In order to support them a Forest Information Systems (FIS) should provide a comprehensive set of information to the decision maker, supporting the implementation of more timely and punctual decisions (Dykstra 1997). FIS recognize three types of information needs:
1. Information for strategic planning and analysis 2. Information for tactical (medium and short-term) planning
3. Information for operational management and control
The framework presented in this paper replies mainly on 1 and 3. In order to satisfy the information needs a detailed workflow associated with information management has been defined. Data must be measured, collected, and then analysed in order to extract information. Decision processes rely on information, and the decisions have to be translated into actions.
Figure 1. Data workflow defined to support forest management
The overall methodology to design the final FIS to support forest operation in mountain area is composed by seven main steps and operations described in Figure 1:
1. Definition of the area subject to planning and recovering of existing information
2. UAV survey
3. Trees identification and planning of field measurements
4. Field measurements with Terrestrial Laser Scanner 5. Field data processing and upload on the FIS database 6. Data visualization and user interaction using 3D web viewer
7. Tree marking for selective felling on the field
The whole methodology relies on geospatial data, which, integrated within an interactive, and continuously updated system, can give information about detailed terrain topography, tree growth status, plots characteristics and other forest parameters, delivering a model-based planning system for forest mountain management.
2.1 Data collection and elaboration
General characterization of the forest, in terms of tree numbers, species, forest condition, and regeneration is called forest inventory (FI). Typically, FI database are organized in forest stands instead of individual trees. In the Alpine forests, a stand-wise approach is usually not sufficient for forest management planning as established in a number of European countries (Koch et al., 2006). The forest planning systems, especially those for harvest management plans, typically work at the single tree level (Lamas and Eriksson, 2003). The first step of the overall methodology is therefore to collect and elaborate information in order to detect and model the single trees composing the forest area.
The input data required for the forest model generation includes: DTM for terrain representation, forest DSM and orthophotos obtained from UAV, sample plots acquired by TLS and a forest inventory database. In our study, we did not consider Airborne Laser Scanner (ALS) because the high costs of ALS data acquisition for single trees detection, especially considering the case of small focus surveyed area addressed to harvesting. However, national level acquisitions of LiDAR scans have been completed in several European countries (Bohlin et al. 2012) providing accurate DTMs on large surfaces. These DTMs, can be advantageously combined with photogrammetric DSMs (photo-DSMs) obtained from UAVs in order to produce a very effective hybrid photo-topo or photo-LiDAR Canopy Height Model (CHM) having very high spatial resolution. The data can be reliable thanks to the possibility to acquire information closer to the harvesting period.
Usually, structural forest attributes are extracted from the canopy height model by means of regression models predicting forest variables with metrics. In order to improve the estimation of these parameters and to provide a more accurate estimation of the forest inventory a methodology to combine the canopy height model with a terrestrial laser scanner survey has been developed.
log breakout of clear fell or thinning up to two or three years in advance of harvesting.
Figure 2. TLS survey and trees delineation using Treemetrics Autostem software
First, a tree detection was performed using the CHM, the local maxima algorithm and the watershed segmentation (Jakubowski et al. 2013). To find the local maxima, a variable window size based on the canopy height was used. The relationship between the crown size and the tree height depends on the species and the forest conditions. In comparison with the EO and UAV image, the UAV CHM allows to identify the tree crowns more easily. Preliminary visual inspection of the results shows that the trees detected are well defined and matching the background image with an accuracy of 94%, (considering the trees that can be visually identified interpreting the image) as shown in Figure 3.
Figure 3. Tree delineation using UAV-CHM
Finally, for each detected tree the stem taper has been generated. Taper equations have been used to estimate the tree DBH and complete the stem profile in the points where there was not data form the TLS.
2.2 Data analysis
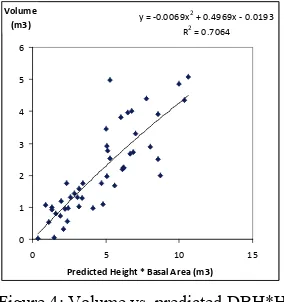
As data is collected and processed, the stem volume and other basic parameters can be estimated analysing each tree taper and DBH. The innovative approach herewith proposed is based on the combination of TLS sample measurements with the remote sensing acquired using UAV systems. The significant correlation between the predicted height from CHM and tree volume can be used for estimating the wood volume based on the UAV information.
Figure 4: Volume vs. predicted DBH*H
The most important steps drafted by the methodology are:
1. TLS analysis: the on-field measured samples have been used to estimate the DBH distribution of the stand. Based on this DBH distribution and on the number of trees counted in the field it is possible to estimate the number of trees for each diameter class and species.
2. DHM calibration: the samples have to match with the trees detected, analysing the Digital Height Model (DHM) extracted from UAV data. This allows the determination of the number of trees that the DHM detected for each diameter class and species, comparing with the TLS measurement. 3. Generalization: the total number of trees in the forest has been estimated analysing the total trees detected by the DHM, assuming similar distribution of the DBH curve created in step 2. The trees detected and the ratio of detection determines the total stems in the forest (Figure 4).
In order to analyse the dendrometrics tree parameters, each species need to be segregated. Each specie, having different forms and shape implies that different species will have a different relationship between the different dendrometric parameters. In order to separate each species enough, samples of each species are required although not always feasible, especially for species with low stand presence. The sparse distribution of the trees make it necessary to walk around the forest looking for new samples. In most cases, this is not justifiable due to the big amount of effort and cost required for sampling species that will have an insignificant impact in the total timber volume and revenue. In these cases, with the exception of high valuable timber, the use of high technology and complex analysis cannot be justified due to the small number of sample. Therefore the minor species (less 10% of volume or value) are usually omitted or analysed in a simplest way (rougher estimation) and the prediction is limited to a subset of the main species (Norway Spruce NS) that can be identified from the air.
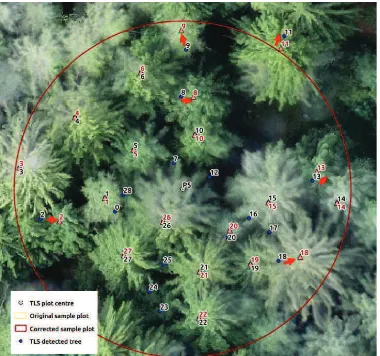
Combining TLS with UAV remote sensing requires an accurate positioning from the ground, GNSS receivers and a good image orthorectification. Otherwise, manual correction is required to match both datasets correctly. Typically, at the trees base the TLS has limited visibility, therefore in the top of the trees the coordinates from the highest point has been used. In the majority of cases, the coordinates from TLS are matching the tree top or are far enough form adjacent tree to avoid confusion (Figure 5).
y = -0.0069x2
+ 0.4969x - 0.0193 R2
= 0.7064
0 1 2 3 4 5 6
0 5 10 15
Predicted Height * Basal Area (m3) Volume
Figure 5. Matching between TLS detected trees (blue) and CHM trees detection
The combination with the TLS/UAV data will be inferred to the rest of the forest area, generating the following results:
• Tree ID
• Single tree location
• Single tree parameters (DBH, height and volume) • Single tree profile (3D)
These outputs are then transfer to the Forest Information System database in order to be managed and visualized as an interactive 3D forest model.
2.3 Data Visualization
The four typology of input data retrieved during the survey of the pilot area are the basis for the development of the full 3D forest. By combining them, it is possible to create a reproduction of a counterpart of the real forest area in a multiscale visualization. Thanks to this reconstruction work, it is possible to provide a web 3D management platform to examine the forest environment from the regional scale to the single tree using a virtual globe paradigm. This allows the inspection of the survey area from different resolution and level of details, from the whole world to the singletree accuracy, giving also the possibility to combine the different datasets on the same area.
Therefore, WebGL 3D forest system becomes the gateway (Craglia, 2012) to access through the web, remote sensing analysis and geographical information of the local mountain forests, allowing owner and operators to optimise their activities.
At the highest level, it is possible to examine the Earth Observation (EO) data and topographic maps. Satellites images give a wider vision of the survey area and are used to detect big patches of trees as well as being adopted as a representation of the historical series giving to the forestry planner a wider scale dimension of the forest potentiality in a wide area of interest. An example can be the visualization of different indexes like NDRE, which can be directly related to the level of wood Chlorophyll and CCCI that can be used as an ancillary measurement to monitor also the Nitrogen and Chlorophyll level. To support planning and management of forest resources it is important to consider additional information like cadastral, logistic and environmental data. These data are typically made available as free “Open-Data” map layers containing the geographical related information. In this work, we integrate them
through a workflow that starts from raw data and arrives to a map service deployment, shown by the 3D web-client.
Figure 6. Satellite imageries evaluated under different indexes: CCCI, NDVI and NDRE
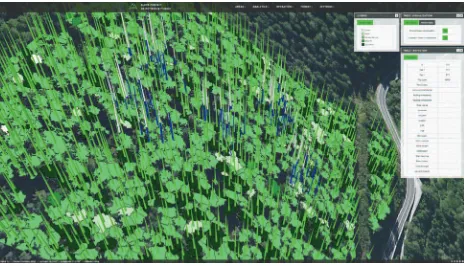
Figure 7. Real-time canopy digital surface model (DSM)
Figure 8. Real-time point cloud (19.7 Millions of points)
resolution of approximately 20 cm representing the DSM of the forest area, and in particular of the digital canopy height model.
Figure 9: Tree stems reconstructed from terrestrial laser scans (TLS).
The DTM/DSM height-maps data and raster images are exposed respectively as a Tile Mapping Service (TMS) and through an OGC Compliant Web Mapping Service (WMS), which are completely interoperable with any other Geographic visualization service in the expanded Forest Information System scenario. A key aspect is the support by the virtual globe of different level of details for both the orthophotos and the terrain height maps. In particular, for these lasts, the multiscale representation varies from a decimetre scale representation of the surface of the area of interest to the 10 meters scale resolution to represent area in the boundaries of the work site but not involved in planning analysis. In the presented forest information system, a Terrain Tile Map Service has been developed to expose tiled maps with different maximum level of detail, without oversampling low-resolution terrain maps and supporting the visualization of all the level of details provided by the height map resolution. In this way, it is possible to visually explore a strict high-resolution area where the terrain is represented with a centimetre scale detail and with the same zoom level the boundaries wider terrain areas without experiencing any sort of artefacts due to over sampling.
A very accurate digital canopy forest model does not always appear suitable for every kind of forest planning. For this reason, the tree properties inferred from the data acquisition phase are also represented as 3D geometrical models correlated with a forest inventory database containing all the properties of a specific plant. Geometrically, they are represented by a 2D polygon identifying the crown segmented from DSM data, a 3D cone defined using the height from canopy model, and the DBH derived from forest equations. This representation would not be complete without the TLS stem geometries but the unstructured nature of its raw point clouds requires a pre-processing phase to extract geometrical information of tree stems.
The TLS processing can segment from the data the trunks information and size, structured as 5cm disks. The trees are reconstructed through cylinder geometry primitives that reproduce the main morphological characteristics of the tree trunks (height, diameter at different height and quality index) and permits a visual exploration of the plot, to let the user inspect information for each single tree within the three dimensional virtual environment (Figure 9). The conical representation of the tree is functional for the forest planner for a rapid analytics of the economic value of the single stem and the advanced planning features presented in the next section, as it augments the decisional support power of the visual virtual environment representation of the forest plot.
3. DECISION SUPPORT SYSTEM
The decision support system, developed in the context of the SLOPE European project and based on the GeoBrowser3D technology (Prandi, 2015), capitalizes on top of the new forest inventory estimation and visualization techniques presented in chapter 2 to build two main logical components opening the doors to a variety of additional services: the forest inventory system and the timber-harvesting planner.
3.1 Forest inventory system
The forest inventory system is built on top of a MySQL relational database with the support of its spatial extensions to store spatial data information. With them, geometries like points, lines and polygons are stored in the database in a binary format enabling the usage of different spatial functions (e.g. distance calculations) and the use of WKT (Well-Known Text) format for feature insertion operations. The forest inventory system is exposed via Web Services modules allowing applications to read and write to the database through a secure REST API. The forest inventory system is divided into four sections:
1. User management 2. Real estate management 3. Storage and logistics
4. Tree and product management
The User management section includes all the information about the users that will be able to access the forest inventory system through an authentication process. The real-estate management section includes all information about origin of the trees and products, with stored entities such as real estate, stand, forest management plan, operation and operation types. The storage and logistic section includes information about products storages and logistics as the data model has been structured to track single log trips between storage areas or to end commercial activities like sawmills. Finally, the tree and product management section includes information about trees, logs and products. More in details, it includes information about standing trees and felled (harvested) commercial logs. The data model tracks the standing tree information collected at the inventory stage to the harvested tree information collected by the processing head with the help of experimental RFID tags.
The parameters collected at the inventory stage include location, volume, quality, DBH, height, taper and branchiness and can be enriched with the parameters collected during the harvesting step: product type, length, Small End Diameter (SED), volume and quality index, determined through a series of real-time analysis during the log-processing phase. In this context, the adoption of a WebGL 3D viewer simplifies access and interaction with the forest inventory system to visualize and update existing data.
Figure 10. Forest inventory with tree status colouring and property inspection
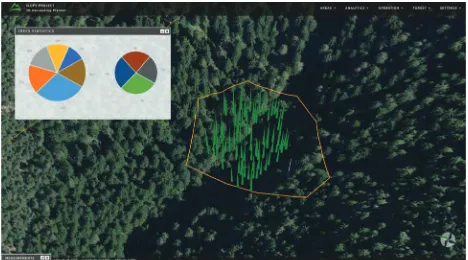
Figure 11. Forest inventory with spatial query and statistics
In the second case, activating the marking trees mode, displays the 3D tree models with a colour depending on its processing status (Figure 10). The different status colours corresponding to: none, measured, marked, field marked and processed, identify the current state of the tree and give a short history of the production process: starting from the initial measurement activity, passing through the virtual and real marking to the final cutting and processing tasks.
The 3D trees model visualization gives the possibility to the user to select a specific tree by clicking on it. The system requests the data to the SLOPE database and provides an inspector dialog with all the information stored in the forest inventory related to the selected tree (Figure 10). Additionally, the same graphical user interface gives access to the virtual marking process and modifies the processing status of the selected tree if needed. This feature is particularly useful for the forest planner to select the trees in advance based on its needs and export such list to be provided to the forester that will proceed with the real marking. In this context, the availability of a spatial query feature enables experts to draw an area by directly clicking on the 3D terrain to request only the trees belonging to a specified area and show its statistics. Among the others, the following parameters can be provided: available surface (ha), productive area (ha), predicted total volume (m3), predicted volume source. In addition to these parameters the tree statistics gives also an overview about the number of trees divided by species, the average volume, the average diameter breast height, volume recorded (m3), predicted volume (m3), predicted volume/Productive Area (m3/ha), predicted stems count (Figure 11).
3.2 Timber harvesting planner
The second element of the decision support system exploits the collected data stored inside the forest inventory for simulation and planning operations. Among the others, a crucial operation
in mountain areas is the optimal setup of cable line through the stand for tree harvesting which phases can be summarized in the following steps:
1. Take measurements to detect working areas and key points for the cable line
2. Verify the possible launch of the cable line
3. Find best intermediate supports configuration for the cable line
4. Export data for on-the-field operations
The planning starts by detecting the most suitable areas for the processing and storage of the harvested trees, evaluating distances from the roads and surface, as well as detecting the starting and ending points of the cable line. Knowing these locations allows the forest planner to evaluate the feasibility of an automatic cable launch with the rope launcher simulation tool. This experimental tool tries to reduce the cable line setup time, a manual procedure requiring, among the other things the displacement of the entire steel cable through the forest. The adoption of this simulation tool allows the planning of transport and positioning of this device and the launch parameters to reach a specific location of the forest taking in account the morphology of the terrain. The simulator allows the user to change several parameters like the angle, orientation and speed of the projectiles to see what will be the final trajectory and the landing area. These parameters can then be exported into the real machine.
Figure 12: Cableway placement and harvesting area simulator
The third step of the process foresees the positioning of intermediate supports by the planner. Every time a new support is placed, it is connected to the previous one and the system checks if the constraints are respected. Each support can be positioned with a click on the map or with the insertion of specific coordinates on the corresponding floating menu (Figure 12) which allow also the modification of the support height. Every time the cableway is modified, the system performs the following steps:
1. Check for intermediate support constraints 2. Calculate cable function
3. Check for cable constraints 4. Calculate serviceable area
sides. Points along the cable line with a low height will have a reduced harvesting area. This system provides a good yet simple estimation of the area serviceable by the cableway. The cable height evolution between pylons is computed following a catenary function, which describes the curve of a rope hanging from two points of a certain length supporting only his weight. Instead of using a fixed length cable based on the distance between the pylons, we calculated the required cable length to reach a certain fixed tensile force. This is what actually happens on the field, cables are tightened to a certain force, roughly up to 120KN. The catenary itself does not represent the position of the cable under the load of the carriage but it is a starting point from which the planner can estimate the cable behaviour during actual workload. To evaluate the validity of the selected intermediate positions the system also calculates a maximum amount by which the cable can lower when under the load of the carriage.
As a final step, once the forest planner has found a good cable line configuration, he can export all the setup parameters (e.g. intermediate support coordinates) in a report, which is automatically generated by the online viewer, and bring it in the operational field to verify the feasibility of the system.
4. CASE STUDY
The demonstration area was located in Piscine (Province of Trento, Italy) between 860-1020m above sea level in a steep surface of 4.18ha of mixed age forestry composed mainly of Norway spruce (Picea abies) mixed with other secondary species: Scots pine (Pinus sylvestris), European larch (Larix decidua), silver fir (Abies alba) and Pinus cembra.
Using Microsoft Bing Maps (RGB 0.5m) and UAV images (RGB-NIR 0.1m) as remote sensing data sources, as well as a DSM (0.1m) and a DTM (1.0m) of the demo area, three different forest analysis approaches have been tested and compared: 1. EO analysis (Bing Maps): for cases where UAV is not
available for the area of study. Forest productive area, tree detection and stratification analysis have been performed. 2. UAV analysis: for cases where DTM is not available for the
area of study. Forest productive area, tree detection and stratification analysis have been performed.
3. UAV-DTM analysis: for cases where a DTM is combined with UAV DSM. Forest productive area, tree detection and stratification analysis have been performed.
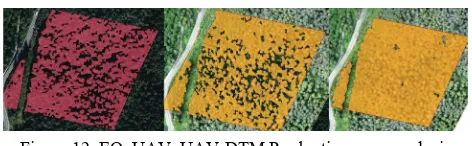
Figure 12: EO, UAV, UAV-DTM Productive areas analysis
UAV/LiDAR point cloud and DTM has been used to generate a Digital Height Model (DHM) for the forest areas keeping the local maxima point without smooth with the rest of the canopy smoothed to remove noise. This approach has been useful for the tree identification. Productive area analysis results are shown in Figure 12. For EO, a first colour image normalization has been required to calculate an Excess Green ExG index used together with the texture for segmentation and classification phases. A minimum gap size of 10sqm has been used together with a manual reclassification to remove the misclassification under the powerline. For UAV, a NDVI has been estimated and used with the same approach as EO. Some misclassification due to scrub vegetation grown under the power line has occurred and solved manually. Finally, the combination of UAV image with DHM
has solved the issues with bushed areas as the height can better discriminate the bushes than the vegetation index. A minimum height of 10 m has been set to define the forest areas. Accuracy results are shown in Table 1.
Method Area of
Table 1. Productive area results comparison
A similar approach and comparison has been followed for tree delineation. EO has been subject to the intensity analysis to locate the treetops using the local maxima method and a region-growing algorithm using the spectral and textural information. Despite the low resolution, and low defined trees the detected number was coherent with the background image although some of the tree crowns have been over-segmented. UAV has been based on spectral analysis (NDVI) to locate the tree tops using the local maxima method. The local maxima have been used as seed to delineate the tree crowns using a region growing algorithm. Crowns with less than 1 sqm and local maxima located outside the crown objects were removed with results similar to EO but with significant lower false detections, over-segmented crowns and problems with double canopies. Finally, for UAV-DHM the local maxima algorithm and watershed segmentation have been used with a variable window size based on the canopy height. Since the relationship between crown size and tree height depends on the species and the forest conditions, a local relationship needs to be generated for each forest site. In this case, a relation with a coefficient regression of 0.79 has been determined from a total of 25 samples. Local maxima have been used as seed to delineate the tree crowns using region growing segmentation. Crowns with less than 3 sqm and local maxima located outside the crown objects were removed as too small to be a tree. This method has resulted the most accurate among the three with very low false detection. Visual results and comparison of the detection rates, based on the trees counted on the field are shown in Figure 13 and Table 2 respectively.
Figure 13: EO, UAV, UAV-DTM Tree delineation analysis
Sensor EO UAV UAV-DHM
Table 2. Number of stem detection
5. CONCLUSIONS
The use of UAV image and high-medium resolution Earth Observations (0.5m) can improve significantly the predictions of a field inventory. Although tree detection analysis has been successful for both datasets, UAV and EO, the higher spatial definition of the UAV improves tree crowns identification and accuracy. The use of height information derived from the UAV stereo analysis has resulted decisive to overcome the forest variability and establish a relative good relationship between tree crown delineation, estimated height and tree volume. This fact constitutes an important information for future automated processes. However, there are also a number of limitations in the accuracy to estimate dendrometric parameters, caused by both remote sensing limitations and forest conditions. Regarding remote sensing, the limitation in spatial resolution negatively affects the identification and delineation of the tree crowns and if possible the use of high resolution imageries from UAV (0.1m) should be preferred giving results similar to the manual digitalization (98% of the trees detected). Regarding forest conditions, the use of imagery did not show a high correlation between the crown delineation and the tree volume due to forest conditions with a high variability of tree sizes and ages. The use of height information derived from the UAV stereo analysis has resulted decisive to overcome the forest variability and establish a good relationship between crown delineation, estimated height and volume. The use of UAV/EO information can improve the inventory planning and analysis. The use of remote sensing data in forest inventories is always complementary to sample based field measurements and should be integrated in a sample based terrestrial design. The reasons for integrating remote sensing data into forest inventories are manifold and include among others:
• Short-time full coverage of the area and up-to-date data. • Costs reduction in forest survey, especially in the detection
of windblown and non-productive areas.
• Better optimization of the field measurement due to reduced sampling intensity and focus only on significant areas. • Better estimation of the dendrometric parameters taking in
account the variation of the forest stand at tree level. • Benefit to management and monitoring, by using spatial
criteria to know parameters distribution within the forest stand (e.g. a windblown can have more or less impact in the stand volume depending on the affected trees size).
ACKNOWLEDGEMENTS
It is with the greatest of sadness that GraphiTech has to deliver the heart-breaking news of the death of our colleague and friend, Federico Prandi. On behalf of all of us, here at Fondazione GraphiTech we would like to take the freedom of sending out to his family, our most heartfelt condolences and sympathy. Federico was an extremely valued member of our team since November 2009. Federico always had a smile for everyone and was highly regarded by everyone who ever had the opportunity to meet him. Back in 2009 when Federico joined GraphiTech, he took on the position of Postdoc Researcher. Over the years, he worked his way into the position of Senior Researcher, regardless of the challenges he may have had along the way. Everyone who had the privilege to collaborate with him has been able to feel support, inspiration and a special work pleasure.
Such an extraordinary person Federico was. This is truly a great loss to our organization and to our community as a whole. He will be profoundly missed by everyone whose lives he touched. Nevertheless, let us remember Federico each time, with a smile upon our faces.
Ciao Federico.
The work presented in this paper has received funding from the European Commission through the 7th Framework Programme under the Grant Agreement n. 604129 (project “SLOPE – Integrated processing and Control Systems for Sustainable Production in Farms and Forests”). The authors are solely responsible this work which does not represent the opinion of the EC. The EC is not responsible for any use that might be made of information contained in this paper.
REFERENCES
Baltsavias, E., Gruen, A., Eisenbeiss, H., Zhang, L., Waser, L.T, 2008. High-quality image matching and automated generation of 3D tree models. Int. J. Remote Sensing, 29, pp. 1243–1259.
Bohlin, J., Wallerman, J., Fransson, J.E.S, 2012. Forest variable estimation using photogrammetric matching of digital aerial images in combination with a high-resolution DEM. Scand. J. For. Res. 27, pp. 692–699.
Craglia, M., et al., 2012. Digital Earth 2020: towards the vision for the next decade International Journal of Digital Earth.
Dykstra, D.P., 1997. Information systems in forestry, Unasylva, 189, pp. 10-15.
Europe's ecological backbone: recognizing the true value of our mountains. EEA Report No 6/2010.
GeoBrowser3D interactive WebGL Virtual globe. www.geobrowser3d.com.
Global Forest resource assessment. FAO: Food and Agriculture
Organization of the United States report. 2010.
http://www.fao.org/docrep/013/i1757e/i1757e.pdf
Jakubowski, Mk., Li, W., Guo, Q., Kelly, M., 2013. Delineating Individual Trees from Lidar Data: A Comparison of Vector- and Raster-based Segmentation Approaches. Remote Sensing. 2013.
Koch, B., Heyder, U., Weinacker, H., 2006. Detection of individual tree crowns in airborne LiDAR data. Photogrammetric Engineering and Remote Sensing, 72, pp. 357-63.
Lämås, T., Eriksson, L.O., 2003. Analysis and planning systems for multiresource, sustainable forestry: The Heureka research programme at SLU. Canadian Journal of Forest Research, 33, pp. 500-08.
Magliocchetti, D., Prandi, F., Panizzoni, G., Lotto, D., De Amicis, R., 2015. "SLOPE: A 3D forest virtual system to support harvesting operation in mountain areas". FORMEC 2015. Linz, Austria.
Prandi, F., Panizzoni, G., Magliocchetti, D., Devigili, F., De Amicis, R., 2015. "WebGL virtual globe for efficient forest production planning in mountainous area". Proceedings of the 20th International Conference on 3D Web Technology, pp. 143-151. ACM, New York, NY, USA, 2015.