MODELLING FINE SCALE MOVEMENT CORRIDORS FOR THE TRICARINATE
HILL TURTLE
I. Mondal a, *, R.S. Kumar b, B. Habib a, G.Talukdar a
a Wildlife Institute of India, Dehradun, India - (indro.gis, bilalhabib1, gautamtalukdar)@gmail.com b Wildlife Institute of India, Dehradun, India – [email protected]
KEY WORDS: Habitat connectivity, Fine Scale, Tricarinate Hill-turtle, Circuit theory, Geographical Information Systems, India
ABSTRACT:
Habitat loss and the destruction of habitat connectivity can lead to species extinction by isolation of population. Identifying important habitat corridors to enhance habitat connectivity is imperative for species conservation by preserving dispersal pattern to maintain genetic diversity. Circuit theory is a novel tool to model habitat connectivity as it considers habitat as an electronic circuit board and species movement as a certain amount of current moving around through different resistors in the circuit. Most studies involving circuit theory have been carried out at small scales on large ranging animals like wolves or pumas, and more recently on tigers. This calls for a study that tests circuit theory at a large scale to model micro-scale habitat connectivity. The present study on a small South-Asian geoemydid, the Tricarinate Hill-turtle (Melanochelys tricarinata), focuses on habitat connectivity at a very fine scale. The Tricarinate has a small body size (carapace length: 127–175 mm) and home range (8000 – 15000 m2), with very specific habitat requirements and movement patterns. We used very high resolution Worldview satellite data and extensive field observations to derive a model of landscape permeability at 1:2,000 scale to suit the target species. Circuit theory was applied to model potential corridors between core habitat patches for the Tricarinate Hill-turtle. The modelled corridors were validated by extensive ground tracking data collected using thread spool technique and found to be functional. Therefore, circuit theory is a promising tool for accurately identifying corridors, to aid in habitat studies of small species.
* Corresponding author
1. INTRODUCTION 1.1 Effect of fragmentation and habitat loss
Fragmentation and habitat loss are severe threats to the conservation of global biodiversity and considered the primary cause of rapid species extinction (Wilox and Murphy, 1985). Habitat loss can reduce habitat quality and result in reduced biodiversity especially for small forest dwelling species (Barnes et al., 1998). Due to these threats, changes in the habitat quality, such as the loss of forest cover contiguity, can influence a species life history traits, including changes in spatial patterns of species movement, habitat use, nest site selection, and home range (citation). These changes in a species life history traits caused by habitat loss and fragmentation can negatively affect species, resulting in declining population sizes and thereby increasing the chances of extinction by some stochastic environmental or demographic events (Groombridge 1992) and (Burkey 1989). Species decline caused of fragmentation has been widely documented for many species from a wide range of taxa, and the USDA Forest Service estimates that over 80% of all mammals, reptile, bird, and amphibian species found in forest habitat are affected by such disturbances (USDA Forest Service, 1987).
Depending on habitat requirements and life-history attributes, species respond quite differently to habitat loss. The amount of available habitat and its spatial pattern in a landscape is perceived differently by species depending on their habitat requirements (Pearson et al., 1996), (Pearson, 2002) and (Wiens, 1989). In reptile species like turtles and tortoises, effects of habitat loss and fragmentation are very severe (Aponte et al., 2003) to the habitat of the common aquatic turtle
(Chrysemys picta) reduced recruitment rates, potentially reducing or eliminating local populations (Marchand and Litvaitis, 2004). Even more so, human interventions in animal habitats, such as roads or highways, caused road deaths of nesting migrant female freshwater turtles, which has the potential to alter their population structure and skew their sex ratios (Steen and Gibbs, 2004).
1.2 The Tricarinate Hill-turtle
The Tricarinate Hill-turtle Melanochelys tricarinata is a small terrestrial geoemydid turtle, attaining 180 mm in length (Das, 2009; Kumar et al., 2010), and generally reported from the Himalayan foothills and riverine grasslands along the river Ganga and Bramhaputra (Boulenger, 1890), (Das, 1991), (Das, 2009), (Ernst and Barbour, 1989), (Pritchard, 1979) and (Smith, 1931). This species has also been recorded at a considerable distance away from the Himalayan ranges in the Shorea robusta
their life history negative effects on their population size and increase their extinction. The current study utilizes circuit theory to model habitat connectivity for the Tricarinate Hill-turtle at a very fine scale.
1.3 Circuit theory
Circuit theory considers the landscape as an electronic circuit, wherein the landscape is made up of many small cells, on a raster map, each having some resistance or conductance value, and the movement of electric current through this circuit is analogous to the movement of an animal in the landscape (Figure 1). Each raster cell is considered as a node in the electric circuit which is joined to its adjacent neighbours in all the eight directions with a resistor having a resistance value equal to the difference in resistance/conductance between itself and its neighbour (McRae, 2006), (McRae and Beier, 2007), (McRae et al., 2008) and (Shah and McRae, 2008).
Figure 1. Terms and concepts in Circuit Theory (Adapted from Minor and Urban, 2007).
1.4 The study
From 2002 to 2012, approximately 120 individuals of Tricarinate Hill-turtles were captured and recaptured on the campus of the Wildlife Institute of India, Dehradun (Kumar et al., 2010). During this capture recapture study, the turtles were mostly found across the same stretches of trails and paths. This apriori information was used to capture the turtles for thread spool tracking and validating the potential corridors for Tricarinate Hill-turtle.
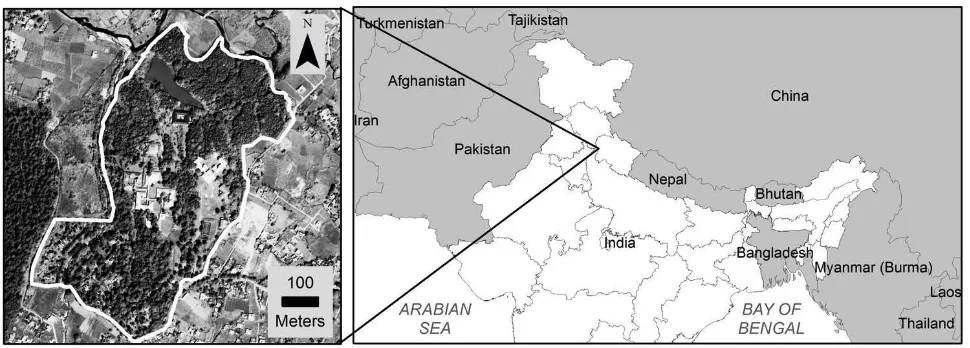
1.5 Study area
This study was conducted on the campus of the Wildlife Institute of India (WII; Area~325,000 m2), Dehradun (77°58’26.8”E, 30°16’59.9”N), India. Dehradun valley is surrounded by the Himalayas in the north, Shivalik hills in the south, the river Ganga in the east and the river Yamuna in the west. The climate of the region is sub-tropical, with hot summers (34 °C) in April and May and cold winters (4 °C) from December to February, with a mean annual temperature of 20 °C. On average the region receives an annual rainfall of 2000 mm, much of which falls during the monsoons (June to September). The WII campus, located near the Shivalik hills along the southern end of Dehradun valley (Figure 2), serves as a refuge for native floral and faunal species. The terrain within the campus is undulating and its vegetation consists of a luxuriant growth of Sal forest with a dense understory dominated by bushes of Lantana camara, Maclura cochinchinensis, Carrisa opaca and Jasminum multiflorum, interspersed with perennial water sources and an artificial lake. Inside the campus contiguous patches of S. robusta are criss-crossed by various trails and paths, which dissect the Sal coppice inside the study area and separate each patch from the other. The surrounding areas of the campus are largely agricultural fields and human settlements.
Figure 2. Study Area, Wildlife Institute of India campus.
2. MATERIALS AND METHODS
2.1 Generation of Landuse Landcover map and delineation of core habitat patches
Satellite data in the form of WorldView 2 imagery from DigitalGlobe acquired on 10th April 2010 was used. Individual
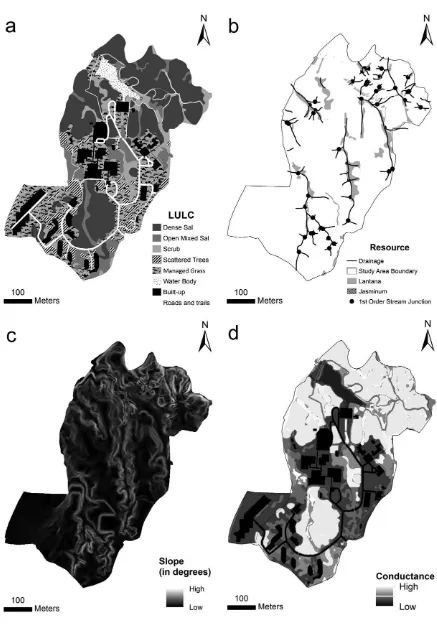
different Landuse/ Landcover (LULC) classes at a scale of 1:2,000. The classes were Dense Sal, Open Mixed Sal, Shrubs, Scattered trees, Managed Grass, Water bodies and Built-up (Figure 3a). Based on extensive field observations of nesting behaviour and habitat use, the dense Sal patches were identified as the core habitat patches for the Tricarinate Hill-turtle. 21 such patches were marked from the LULC map. The inter-patch matrix between the core habitat patches consists of classes like the Open Mixed Sal, Shrubs, Scattered trees, Water bodies, Built-up and the Managed Grass. Trails and pathways further dissect the inter-patch matrix.
2.2 Mapping of resource and other habitat features
Besides the LULC map, Road, Drainage, Slope and Resource maps were also generated. The roads were mapped by GPS survey of the study area, which was later imported into GIS and edited. The drains, streams, bridges and culverts were also mapped and later integrated into the LULC map. Bridges and culverts are important for connectivity as they serve as tunnels across the wide metaled roads, which virtually act as barriers for the movement of the turtle. A digital elevation model (DEM) of the study area was generated from contours, at 1 m interval. The Slope map was derived from the DEM (Figure 3c). We mapped the availability of food resources (resource map) which included earthworms, edible berries etc. Occurrence of earthworms in the ground, whether bare or covered by vegetation, was assumed to be uniform, but availability of wet soft soil at first order stream junctions ensured that earthworms were available at these sites in high densities. Besides this, in the rainy season, earthworms washed up and accumulated at these sites, and the turtles were seen feeding on them. Buffers of 3 meters were generated around these points to demarcate areas with high availability of earthworms. The study area was surveyed in detail for occurrence of Lantana and Jasminum plants, which contributed to the food resources in the form of edible berries. Locations of Lantana spp. and Jasminum spp. bushes were mapped. The information of all available food resources was integrated into a single raster layer (Figure 3b).
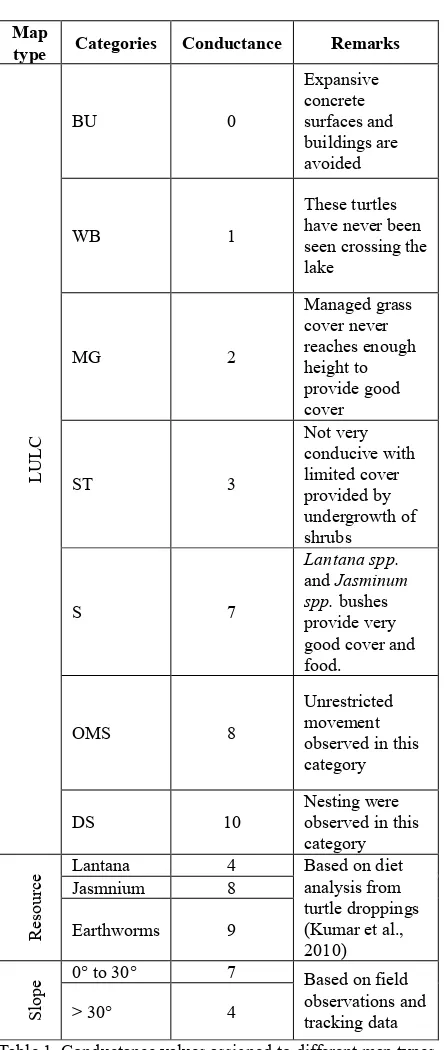
2.3 Assignment of conductance values
The LULC, slope and resource maps were used to prepare conductance (permeability) map. These conductance values were scaled from 0 (very high resistance to movement) to 10 (highest degree of permeability). The values were based on expert opinion (Spear et al. 2010; Store 2001) and field observations of preferences shown by the turtles to different categories of LULC, Slope and Resource maps (Table 1).
2.4 Generation of Current (Connectivity) Map
The final conductance layer (Figure 3d) represents the whole study area as a function of all the factors affecting the movement of the turtles. This conductance surface acts as an electronic circuit and each patch in the focal region (Circuitscape term for “core habitat patch”) map is considered as a node. Each node is treated either as a source or sink depending on whether the current is flowing from or to the node. In the model, current is passed between the nodes following all possible pathways across the landscape, analogous to the random movement of the turtle in the study area. This was done using Circuitscape 3.5.8 (Shah and McRae, 2008), which subjected a current of one ampere from each of the source nodes to the destination nodes, along all the possible pathways made up by combining different landscape circuit
linkages between the source and sink nodes. This operation assigns a current value to each landscape raster cell equivalent to the amount of current flowing through it, which yields a current map depicting the distribution of current values across the landscape. Places with high current values depict areas favoured by the species for movement between habitat patches as compared to the low values (McRae, 2006), (McRae and Beier, 2007), (McRae et al., 2008) and (Shah and McRae, 2008). This current map was then used to delineate potential corridors. Further, these sites were validated using turtle movement data obtained from thread-spool tracking technique (Breder, 1927).
Map
type Categories Conductance Remarks
L
Table 1. Conductance values assigned to different map types. BU = Built-up, WB = Waterbody, MG = Managed Grass, ST =
3. RESULTS
3.1 Landuse Landcover Map and Core Habitat Patches Based on visual interpretation, 7 LULC classes were identified within the study area (Table 2, Figure 3a). The overall accuracy of the LULC map was 92%. Dense Sal covers most of the area in the campus (35.83%), which forms the core habitat of the Tricarinate Hill-turtle. It is characterized by a canopy cover of above 75% and dominated by trees like Shorea robusta and
Xylosma longifolium. Other associated tree species are
Syzygium cumini, Celtis australis, Pyrus pashia etc. In this LULC class average shrub cover of 23% is offered by species like Carissa opaca, Murraya koenigii and Jasminium multiflorum. The ground is mostly covered by sal leaf litter (average 80% cover). Due to the little amount of disturbance and ample leaf litter for torpor, the Tricarinate turtle primarily prefers the dense Sal habitat.
Table 2. Area statistics of Landuse Landcover classes.
The inter-patch matrix consists of classes like Open Mixed Sal, Shrub, Scattered trees, Managed Grass, Water body and Built-up, and covers 64.17% of the study area. Open mixed sal provides a canopy cover of over 50% and are mainly constituted of trees like Sapium sebiferum, Salix tetrasperma, Shorea robusta etc. Undergrowth of shrubs like Solanum verbascifolium L., Carissa opaca and Jasminium multiflorum
provide an average cover of 55%. Areas where the shrub category occurs, a cover of more than 80% is provided by species like Lantana camara, Jasminium multiflorum, Woodfordia fruticosa etc. There is a grass cover of 60% on the ground, the rest is covered by leaf litter.
Scattered trees occur near roads, or in fringe areas of Open Mixed Sal patches where the undergrowth has been cleared. It is characterized by an average canopy cover of 35%. There is an undergrowth of Lantana camara, Ichnocarpus frutescens, Jasminium multiflorum and Carissa opaca, providing an average cover of 25%. Herb and grass cover amounts to 75% on the ground. Dominant grass species are Dactyloctenium aegypticum and Oplismenus burmannii, whereas herbs like
Alternanthera sessilis, Synedrella vialis, Nelsonia canescens, Bidens pilosa and Ageratum conyzoides are abundant.
Managed Grass occur frequently, interspersed between forested and built-up areas; some of them are managed regularly.
Dactyloctenium aegypticum, Bothriochloa pertusa and
Imperata cylindrical are the dominant species in this category, and they reach an average height of 60 cm. Herb species like
Synedrella vialis, Oxalis corniculata, Bidens pilosa, Urena lobata, Alternanthera sessilis, Centella asiatica are also associated with this class.
Water bodies in the study area are in the form of perennial streams and an artificial lake of 7,476.22 m2. The built-up class consists of buildings, roads, car parks and playgrounds.
3.2 Current (Connectivity) Map
Circuitscape 3.5.8 (Shah and McRae, 2008) was conducted on the final input data (Figure 3d) in pairwise mode with 21 focal regions. The final conductance map was used as Raster habitat map and data type was chosen as conductance. Cell connection scheme was chosen as eight neighbours and average conductance was calculated to produce cumulative current maps. Pairwise mode was used to identify probable movement corridors between any number of patches, as opposed to the all-to-one mode, which approximates the pairwise results when computation time is limited and the one-to-all mode which shows where dispersers leaving each patch go until they hit another patch. There were in total 253 pairs of habitat nodes present in the analysis.
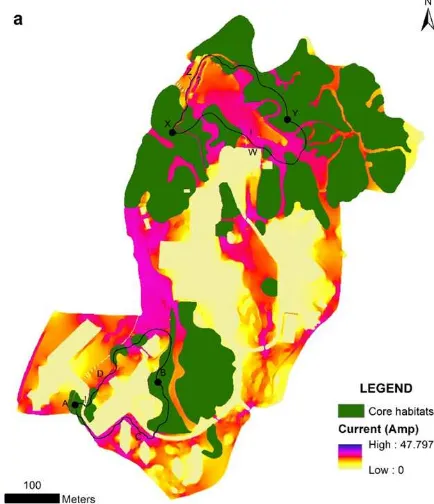
The current map (Figure 4a) shows the distribution of current values across the whole landscape. The distribution of current values show a pattern, which represents linear corridors like features, where the current values are higher than the surrounding areas and follow the path of least resistance. Since movement of current is analogous to the movement of a turtle over the landscape, the presence of corridor like features in the resultant current map indicates areas on a landscape which are favoured by the turtles for their movement. So when these kind corridors appear between concerned habitat patches, they may be considered as potential corridors between two habitat patches
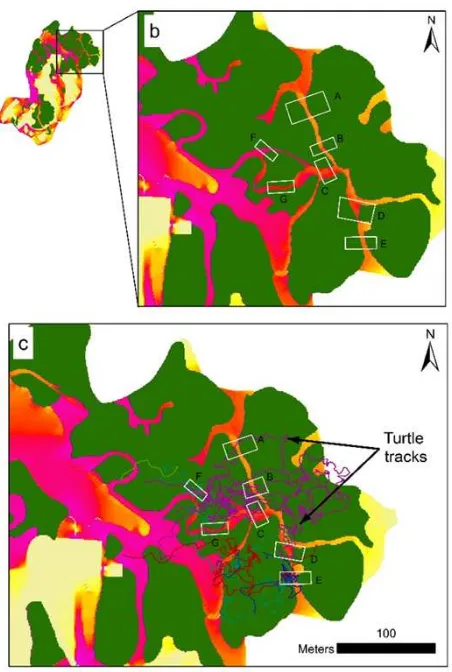
Figure 4. a) Current map of the study area indicating corridors for restoration efforts. XY and AB are core patches that are
connected following the paths delineated, along which restoration is suggested.
Landuse / Landcover Area (m2) % Area
Dense Sal 116,495.10 35.83
Open Sal 30,772.01 9.47
Shrub 20,794.86 6.40
Scattered Trees 21,104.68 6.49
Managed Grass 76,909.46 23.66
Water bodies 7,476.22 2.30
Built-up 51,551.39 15.86
Figure 4. b) Shows location of corridors visually identified (white boxes) from figure 4a. c) Turtle tracks validating the
predicted corridors in figure 4b
4. DISCUSSION
About 85,000 m2 (26.15%) of the study area was sampled for intensive turtle movements (Figure 4b). Turtles were observed crossing over from one core patch to the other. In the output current map corresponding to the above intensive study area, we could visually identify corridors (A, B, C, D, E, F and G) with high current values, as indicated by the colour index. They are assumed to be potential corridors for the Tricarinate Hill-turtle. For the purpose of validation, we overlaid turtle tracking data over the map. It was observed that all the predicted sites were being used by the turtles for inter-patch movement.
The study reveals that in the northern part of the study area, which corresponds with the intensive study area, the connectivity among the habitat patches is the best. Patches in the rest of the study are mostly disconnected with some exception in the west and the central region. Connectivity in the west and central parts of the study area are provided by a continuous cover of open mixed sal patches and lantana shrubs. This kind of a study is very useful for prioritizing areas for restoring habitat connectivity (McRae et al. 2012), as evident from the sites A-B and X-Y (Figure 4a). Points A and B can be connected through two pathways ACB and AEDB. Path ACB shows high current values indicating that this path is highly preferred by the turtle, but there is an underpass below a culvert. In the absence of an underpass (critical for connectivity) the road would act as a barrier. Along the path AEDB, the gap in the vegetation cover near E could be restored
to connect the otherwise disconnected pathway between A and B. In the northern part of the study area the points X-Y are separated by an artificial lake which acts as a barrier to the movement of the turtle from one patch to another. Here we assume two pathways, XZY and XWY. Path XWY passes through an area with high current values, whereas XZY has a gap of about 84 metres in the vegetation cover, as well as two concrete overflow channels for the water to drain out during the monsoon season. Thus, if the grass cover is not managed i.e., grass is allowed to grow to a height of few feet during the rainy season (season when they are most active) and the overflow channels are covered along XZY we can improve connectivity for the turtles.
Circuitscape has stood out to be a good tool in delineating the corridors of Tricarinate Hill-turtle. The conductance model used here can also be improved upon by considering different landscape features, ecological processes and genetic responses of animal to future environmental change.
5. CONCLUSION
The current map was not classified to quantitatively delineate potential corridors, but that is beyond the scope of this paper and needs more detailed studies so as to ecologically justify any such hard classification. We were unable to model biased or unidirectional movement of the turtles, since Circuit Theory uses the concept of bidirectional resisters. Incorporation of non-linear circuit elements, like diodes, in the circuit theory may help overcome this (Ghosh et al., 2008) and (McRae and Beier, 2007).
The study has demonstrated that Circuit theory can be used to model corridors for small and slow moving animals at a very fine resolution of 1:2,000. Preliminary studies on the identification of “pinch points” (bottle necks), which are very critical components of habitat connectivity for animals, are promising and how well these pinch points can be identified at various scales of study through circuit theory has to be tested.
ACKNOWLEDGEMENT
The authors wish to thank the Director, Dean and Research Coordinator of Wildlife Institute of India for facilitating the study. We also thank Brad McRae, from the Nature Conservancy and Viral B. Shah from Interactive Supercomputing for clearing doubts with Circuit Theory in the initial stages. The authors acknowledge WorldView for providing us with the satellite data free of cost. We thank Malemleima Ningombi, Debabrat Gogoi, Ravikant Mahato, and Kishen for assistance during field work.
REFERENCES
Aponte, C., Barreto, G.R., Terborgh, J., 2003. Consequences of Habitat Fragmentation on Age Structure and Life History in a Tortoise Population. Biotropica 35, 550-555.
Barnes, B.V., Zak, D.R., Denton, S.R., Spurr, S.H., 1998.
Forest Ecology, 4 ed. John Wiley & Sons, Inc.
Breder, R.B., 1927. Turtle trailing: a new technique for studying the life habits of certain Testudinata. Zoologica, 9, pp. 231-243.
Burkey, T.V., 1989. Extinction in nature reserves: the effect of fragmentation and the importance of migration between reserve fragments. Oikos, 55(1), pp. 75-81.
Das, I., 1988. Turtles of Manas Tiger Reserve. Hamadryad 13, pp. 27-28.
Das, I., 1991. Colour Guide to the Turtles and Tortoises of the Indian Subcontinent. Portishead: R & A Publishing Limited.
Das, I., 2009. Melanochelys tricarinata (Blyth 1856)–tricarinate hill turtle, three-keeled land turtle. Conservation Biology of Freshwater Turtles and Tortoises: A Compilation Project of the IUCN/SSC Tortoise and Freshwater Turtle Specialist Group.
Rhodin, AGJ, Pritchard, PCH, van Dijk, PP, Saumure, RA, Buhlmann, KA, Iverson, JB and Mittermeier, RA (Eds).
Chelonian Research Monographs, pp. 025.021-025.025.
Ernst, C.H., Barbour, R.W., 1989. Turtles of the World. Washington: Smithsonian Institution Press.
Ghosh, A., Boyd, S., Saberi, A., 2008. Minimizing effective resistance of a graph. SIAM review, 50, pp. 37.
Groombridge, B., 1992. Global biodiversity: state of the earth's living resources. Chapman and Hall, New York, New York.
Holdt, B.M., Civco, D.L., Hurd, J.D., 2004. Forest fragmentation due to land parcelization and subdivision: a remote sensing and GIS analysis, Proceedings of the 2004 ASPRS Annual Convention, Denver, Colorado.
Howard, J.A., 1991. Visual image interpretation, Remote sensing of forest resources: theory and application, vol. 621. Chapman & Hall London, pp. 126-150.
Kumar, R., Harihar, A., Pandav, B., 2010. Population characteristics of a terrestrial geoemydid, Melanochelys tricarinata, from the Doon Valley, northern India. The Herpetological Journal, 20, pp. 139-146.
Marchand, M.N., Litvaitis, J.A., 2004. Effects of habitat features and landscape composition on the population structure of a common aquatic turtle in a region undergoing rapid development. Conservation Biology, 18, pp. 758-767.
McRae, B.H., 2006. Isolation by Resistance. Evolution, 60, pp. 1551-1561.
McRae, B.H., Beier, P., 2007. Circuit Theory Predicts Gene Flow in Plant and Animal Populations. Proceedings of the National Academy of Sciences of the United States of America
104, pp. 19885-19890.
McRae, B.H., Dickson, B.G., Keitt, T.H., Shah, V.B., 2008. Using circuit theory to model connectivity in ecology, evolution and conservation. Ecology, 89, pp. 2712-2724.
McRae, B.H., Hall, S.A., Beier, P., Theobald, D.M., 2012. Where to restore ecological connectivity? Detecting barriers and quantifying restoration benefits. PloS one, 7, pp. e52604.
Minor, E.S., Urban, D.L., 2007. Graph theory as a proxy for spatially explicit population models in conservation planning.
Ecological Applications, 17, pp. 1771-1782.
Mitchell, J.C., Rhodin, A.G., 1996. Observations on the natural history and exploitation of the turtles of Nepal, with life history notes on Melanochelys trijuga. Chelonian Conservation and Biology, 2, pp. 66-72.
Pearson, S., Turner, M., Gardner, R., O'neill, R., 1996. An organism-based perspective of habitat fragmentation.
Biodiversity in managed landscapes: theory and practice. Oxford University Press, New York, pp. 77-95.
Pearson, S.M., 2002. Interpreting landscape patterns from organism-based perspectives in: Gergel, S.E., Turner, M.G. (eds.), Learning Landscape Ecology: A Practical Guide to Concepts and Techniques Springer-Verlag, New York.
Pritchard, P.C.H., 1979. Encyclopedia of Turtles. T.F.H. Publications Inc, Neptune, New Jersey.
Shah, V.B., McRae, B., 2008. Circuitscape: A Tool for Landscape Ecology, in: Varoquaux, G., Vaught, T., Millman, J. (Eds.), Python in Science, pp. 62-66.
Sharma, R., Tikader, B., 1985. Handbook Indian Testudines. Zoological Survey of India.
Smith, M.A., 1931. The Fauna of British India, including Ceylon and Burma. Reptilia and Amphibia. Vol. I. Loricata, Testudines. Taylor and Francis, London.
Spear, S.F., Balkenhol, N., Fortin, M.-J., McRae, B.H., Scribner, K.I.M., 2010. Use of resistance surfaces for landscape genetic studies: considerations for parameterization and analysis. Molecular Ecology, 19, pp. 3576-3591.
Steen, D.A., Gibbs, J.P., 2004. Effects of Roads on the Structure of Freshwater Turtle Populations. Conservation Biology, 18, pp. 1143-1148.
Store, R., Kangas, J., 2001. Integrating spatial multi-criteria evaluation and expert knowledge for GIS-based habitat suitability modelling. Landscape and urban planning, 55, pp. 79-93.
USDA Forest Service, 1987. Report of the United States on the Criteria and Indicators for the Sustainable Management of Temperate and Boreal Forests, in: US Department of Agriculture (Ed.), Washington, DC.
Valentin, P., Gemel, R., 1999. Zur Fortpflanzungsbiologie der Dreikiel-Erdschildkröte Melanochelys tricarinata (Blyth, 1856). Herpetozoa, 12, pp. 99-118.
Wiens, J.A., 1989. Spatial Scaling in Ecology. Functional
Ecology, 3, pp. 385-397.