TOWARDS A 3D BASED PLATFORM FOR CULTURAL HERITAGE SITE SURVEY
AND VIRTUAL EXPLORATION
Julien Seinturier a, Christophe Riedinger a, Amine Mahiddine a, Daniela Peloso a, Jean-Marc Boï a, Djamel Merad a, Pierre Drap a
a LSIS umr CNRS 7296, Centre National de la Recherche Scientifique, Marseille, France
Commission VI, WG VI/4
KEY WORDS: Graphics, Platforms, Software, Point Cloud, Photogrammetry, Knowledge, Cultural Heritage
ABSTRACT:
This paper present a 3D platform that enables to make both cultural heritage site survey and its virtual exploration. It provides a single and easy way to use framework for merging multi scaled 3D measurements based on photogrammetry, documentation produced by experts and the knowledge of involved domains leaving the experts able to extract and choose the relevant information to produce the final survey. Taking into account the interpretation of the real world during the process of archaeological surveys is in fact the main goal of a survey. New advances in photogrammetry and the capability to produce dense 3D point clouds do not solve the problem of surveys. New opportunities for 3D representation are now available and we must to use them and find new ways to link geometry and knowledge.
The new platform is able to efficiently manage and process large 3D data (points set, meshes) thanks to the implementation of space partition methods coming from the state of the art such as octrees and kd-trees and thus can interact with dense point clouds (thousands to millions of points) in real time. The semantisation of raw 3D data relies on geometric algorithms such as geodetic path computation, surface extraction from dense points cloud and geometrical primitive optimization. The platform provide an interface that enables expert to describe geometric representations of interesting objects like ashlar blocs, stratigraphic units or generic items (contour, lines, …) directly onto the 3D representation of the site and without explicit links to underlying algorithms. The platform provide two ways for describing geometric representation. If oriented photographs are available, the expert can draw geometry on a photograph and the system computes its 3D representation by projection on the underlying mesh or the points cloud. If photographs are not available or if the expert wants to only use the 3D representation then he can simply draw objects shape on it. When 3D representations of objects of a surveyed site are extracted from the mesh, the link with domain related documentation is done by means of a set of forms designed by experts. Information from these forms are linked with geometry such that documentation can be attached to the viewed objects. Additional semantisation methods related to specific domains have been added to the platform. Beyond realistic rendering of surveyed site, the platform embeds non photorealistic rendering (NPR) algorithms. These algorithms enable to dynamically illustrate objects of interest that are related to knowledge with specific styles. The whole platform is implemented with a Java framework and relies on an actual and effective 3D engine that make available latest rendering methods. We illustrate this work on various photogrammetric survey, in medieval archaeology with the Shawbak castle in Jordan and in underwater archaeology on different marine sites.
1. INTRODUCTION
In recent years, 3D reconstruction methods have been enhanced. It is now common to quickly generate dense sites representations for example from photogrammetry or laser-scanning. However, densifying and increasing the size of raw 3D data is not a direct advantage for expert driven measurement, indeed, the detection and the extraction of interesting objects from such a representation involve the use of more complex processes that are not part of the expert's domain (as geometric optimisation, shape detection, …). On the other hand, a full automated process for detecting interesting objects cannot be applied without integrating the domain knowledge that are only available during expert intervention. The aim of presented work is to provide a single and easy way to use framework for merging multi scaled 3D measurements based on photogrammetry, documentation produced by experts and the knowledge of involved domains leaving the experts able to extract and choose the relevant information to produce the final survey.
Indeed mapping, archaeological surveys, and more generally, surveys dedicated to cultural heritage are an interpretation of the
real world and not a simple exercise in data acquisition that is more or less metric.
Taking into account the interpretation of the real world during the process of archaeological surveys is in fact the main goal of a survey. New advances in photogrammetry and the capability to produce dense 3D point clouds do not solve the problem of surveys. New opportunities for 3D representation are now available and we must to use them and find new ways to link geometry and knowledge.
The new platform is able to efficiently manage and process large 3D data (points set, meshes) thanks to the implementation of space partition methods coming from the state of the art such as octrees and kd-trees and thus can interact with dense point clouds (thousands to millions of points) in real time. The semantisation of raw 3D data relies on geometric algorithms such as geodetic path computation, surface extraction from dense points cloud and geometrical primitive optimization. The geodesic path computation is performed using an algorithm that optimizes the geodesic curvature. This method is independent from the mesh size but relies on precision of sampling. It is, then, possible to compute geodesic path on very dense mesh with a relatively moderated execution time. The extraction of surface takes as an
input a contour made of a set of geodesic lines drawn onto the mesh. The part of the mesh that is enclosed within this contour is extracted from the mesh. For that, the algorithm retrieves the faces that are enclosed in the contour and cuts the boundary faces to ensure a smooth boundary. The plane extraction algorithm extracts plane from a set of points that are filtered by a polygonal region marked on the screen. All the points that are inside this region are considered to compute the best plane avoiding that the outliers modify the orientation of the plane. The platform provide an interface that enables expert to describe geometric representations of interesting objects like ashlar blocs, stratigraphic units or generic items (contour, lines, …) directly onto the 3D representation of the site and without explicit links to underlying algorithms. The platform provide two ways for describing geometric representation. If oriented photographs are available, the expert can draw geometry on a photograph and the system computes its 3D representation by projection on the underlying mesh or the points cloud. If photographs are not available or if the expert wants to only use the 3D representation then he can simply draw objects shape on it. When 3D representations of objects of a surveyed site are extracted from the mesh, the link with domain related documentation is done by means of a set of forms designed by experts. Information from these forms are linked with geometry such that documentation can be attached to the viewed objects.
Additional semantisation methods related to specific domains have been added to the platform. The automatic object profile detection enables to extract a 2D profile of selected object (usefull for example for archaeological ceramics study). The computation of level curves from points cloud have been also integrated for topological study purpose. Finally, orthophoto production based on dense cloud of 3D point and oriented photographs enable to generate visual overview of a site. Beyond realistic rendering of surveyed site, the platform embeds non photorealistic rendering (NPR) algorithms. These algorithms enable to dynamically illustrate objects of interest that are related to knowledge with specific styles.
The whole platform is implemented with a Java framework and relies on an actual and effective 3D engine that make available latest rendering methods.
We illustrate this work on various photogrammetric survey, in medieval archaeology with the Shawbak castle in Jordan and in underwater archaeology on different marine sites.
2. 3D DENSE DATA MANAGEMENT
Methods and algorithms that we use rely on common operations on 3D point clouds or meshes such as the computation of the intersection between a ray and a mesh or the computation of the neighbourhood of a point within a cloud. We’ve implemented two methods dedicated to space partitioning in order to make these operations as effective as possible.
2.1 Octree space partitioning
Octree space partitioning (Meagher, 1980) relies on recursive partitioning of a cube within eight same sized sub-cubes. Formally, an octree is a tree data structure in which each internal node, denoted octant, has exactly eight children. An octree is characterized by its depth that describes the number of division from the original cube to the last octants. Each octant, is attached to a box and to a set of objects from the 3D space that lie within the box. The root of the tree is the octant attached to the whole space bounding box and to all the represented objects. The leaves of the tree are octants attached to minimal bounding boxes and have no child. Regarding the depth of an octree contains exactely 8depth leaves.
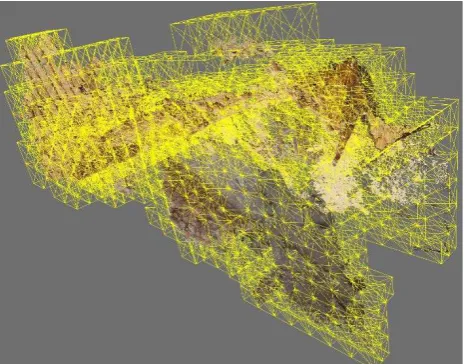
The construction of an octree is obtained by recursively partitioning space from an original bounding box. The root node of the octree is associated to this original bounding box and references all objects of the scene. For each octant, its eight child are attached to a sub box and to all spatial object that are contained by it. The leaves octants contains reduced list of spatial objects attached to a sub-space as we can see in Figure 1.
Figure 1 Octree leaves for a 3D model (Shawbak castle, Jordan)
The octrees are easy to use for the partitioning of point clouds, however, it is possible to extend their use to 3D meshes. The method for computing an octree on a 3D mesh differs from the points cloud approach because mesh faces can be stretched on multiple octants. This case can be processed by replacing the criteria of content by a criteria of intersection within the construction algorithm: a mesh face is attached to an octant if it is intersecting the octant box. An octree can be used on a dynamic 3D scene if the global scene bounds are not modified by adding / removing objects. In this case, the new object is just dispatched among the octants as it is done during the initial construction of the octree. If the new object is outside the initial scene bounds, or if the removed object was part of the initial scene bounds, the octree has to be reconstructed with the new bounds. When a 3D scene is partitioned using an octree, the intersection between primitives and the object of the scene can be optimized. Instead of testing the intersection with all the objects, the algorithm parses the octree and checks if the primitive intersects the bounds of the current octant. If so, the checking is repeated recursively for the eight sub octants. When a leaf is reached, the intersection is computed with all the object attached to it. This method enable to minimize the number of intersection checking. The intersection between scene components and primitive can be used for picking (intersection with ray) or convex shape based selection (box, sphere, ...). Even if they are adapted to 3D computation optimizations, octree have some limitations. One of them is the computation of neighbours within a 3D scene.
2.2 K-D Tree space partitioning
A k-d tree (Bentley, 1975) is a space-partitioning data structure for organizing points in a k-dimensional space. k-d trees are a useful data structure for several applications, such as searches involving a multidimensional search key (for example. range searches and nearest neighbour searches). The k-d tree is a binary tree data structure in which every node is denoted k-dimensional point. Every non-leaf node divides the space into two half-spaces. The points to the left of the current node are represented by the left subtree of that node. The points to the right are represented
by the right subtree. For example, within a 3D Cartesian space where x, y and z are selected as k-dimensions, all points in the subtree with a smaller x value than the current node will appear in the left subtree and all points with larger x value will be in the right subtree.
The k-d tree construction relies on k-dimension cycles along the tree depth (For example, in a 3-dimensional tree, the root has an x-aligned plane, the root's children have y-aligned planes, the root's grandchildren have z-aligned planes, the root's great-grandchildren would all have x-aligned planes, and so on.). Points are inserted by selecting the median of the points being put into the subtree, with respect to their coordinates in the axis being used to create the splitting plane. This method leads to a balanced k-d tree, in which each leaf node is about the same distance from the root.
The k-d trees are suitable to find nearest neighbours within large points clouds because the underlying tree properties enable to quickly eliminate large portions of the search space. Searching for a nearest neighbour in a k-d tree proceeds as follows: 1. The tree is parsed recursively, choosing left or right node depending on whether the point is lesser than or greater than the current node along the split k-dimension.
2. When a leaf node is reached, the point attached to the node is saved as the best candidate.
3. The algorithm unwinds the recursion of the tree, If the current node is closer than the best candidate, then it becomes the best candidate. Else, it is checked whether there could be any points on the other side of the current node that are closer to the search point than the best candidate.
The search stop when the root node is reached again.
This structure enables to quickly find nearest neighbours against specific dimension. For example, a k-d tree of dimension 6 can represents a coloured points cloud. The coordinates x, y and z form the first 3 dimension and the red, green and blue colour components form the last 3. Searching neighbours with such a tree will enable to mix space and colour proximity and so to refine pure space based computations.
With octrees and k-d trees, the processing of large point clouds and of dense meshes is efficient and the use of advanced methods of geometry processing becomes available.
3. EXTRACTION OF GEOMETRIES
The link between knowledge of domains and 3D representations based on points clouds or meshes relies on the ability to express objects representation (like walls, ashlar blocs, amphorae) directly on the 3D representation. We present two methods for representing planes and geodesic paths respectively on a points cloud and on a triangle mesh as they are suitable in various domains for representing pre-cited objects.
3.1 Extraction of planes from a points cloud
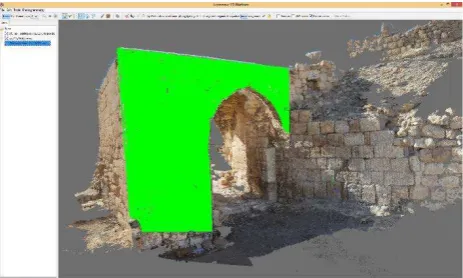
The architectural restitution relies on the modelisation of buildings that are often made of intersecting planes (the walls and the roof of a building). As most of the restitution methods (photogrammetry, laser-scanning) produce points cloud, the capacity to extract planes directly from these data is a true need. The method proposed here relies on expert interaction. The extraction of plane is done after that the expert has selected a polygonal region on the 3D representation that bounds the plane and a point that lies within as we can see in Figure 2.
Figure 2 Bounding polygon (purple) and inner point (green), Castle of Shawbak, Jordan
The underlying algorithm computes the plane that best matches to the points cloud within the polygonal region and that contains the reference point. Only those points which are in the polygonal region and in the plane are extracted: for example, if the expert choose to extract a plane representing a wall that contains a window, the points that compose the wall are extracted but not the points that are visible through the window.
The method works as follows:
Method 1 – extract with reference: Let C be the points cloud to process
Let P be the polygonal bounds pointed by expert Let a be an angular step
Let b be an angular step Let plane be a 3D plane
1. E ← the points of C that can be projected within P 2. initialize plane with default values
3. while plane is not optimal 4. for each point p of E
5. p vote for turning plane with the angle +a or –a among each axe such as +a if turning +a decrease the distance of p to the plane and –a otherwise.
6. if the sum of the votes among an axis are positive, turn +b else turn –b
7. check if plane is optimal for E
Variable plane can be initialized with medium plane for the points cloud E. The values of a and b are arbitrary and such that small values increase precision as higher values increase computation speed. Figure 3 shows the points that lies on the plane that has been plotted by the expert. As we can see, lower bounds of the polygonal selection dot not lie within the plane.
Figure 3 points that lie on the selected plane (green), Castle of Shawbak, Jordan
These algorithms can be optimized by filtering the set of points E. This can be done by reducing the resolution of the polygonal region and take the visible points from E so that there is only one point visible for a square neighborhood of 5*5 pixels as an example. This is done to make work the algorithm faster. On the other hand, in order that the algorithm achieve good performances there must be substantially more points of E in the desired plane than outside. The point cloud must be dense (One should not be able to see through the points of a wall what is behind the wall). When the point clouds are not dense, a possible solution is to reduce the resolution (as it is recommended to optimize the algorithm).
3.2 Geodesic curve computation from a mesh
In order to make drawings on a mesh, we have implemented a geodesic curve computation algorithm. From a set of selected points on the mesh, the algorithm links these points from the first to the last with a geodesic curve. Several geodesic computation algorithms exist in literature (Surazhsky, 2005), (Kimmel, 1998), (Mitchell, 1987). Their complexity is, in general, linked to the number of faces in the mesh. As we work on meshes that contain millions of vertices, we chose an approach which complexity only depends on the number of sampling points in the geodesic path. The geodesic path is obtained starting with the computation of a Dijkstra path (Dijkstra, 1959) between the selected points and by deforming this original path according to a differential equation. The algorithm works as follows:
1. Computation of the Dijkstra path, denoted L, made of a set of n vertices V = {V(i), 1 ≤ i ≤ n} where each V(i) is a vertex of the underlying mesh and where the normal to V(i) is denoted N(i).
2. Approximation of the geodesic path by t iterations :
2.1. Computation of a sampling of size s from the path L with a curvilinear abscissae by computing spline curves from X Y Z coordinates of the V(i) vertices. The path L is now represented by a set of sampled points denoted LS = {PS(i), 1 ≤ i ≤ s}.
2.2. For each sampled point PS(i), computation of:
•
the normal to the surface NS(i) by interpolating N(q) with a spline function in a similar way as it was done for the vertices.•
the tangent vector to the path TS(i) = (PS(i+1) - PS(i-1)) / 2•
the vectorG
S(i) = N
S(i) x T
S(i)
The geodesic path is the solution of the differential equation (Rongjie, 2011)
���
�� =−����
Where γg is scalar called the geodesic curvature and is computed with the Darboux basis relationships between GS, NS and TS (Darboux, 1887):
� �� �
��
��
��
�=�
0 �� ��
−�� 0 −��
−�� �� 0
� �����
��
�
This is a three unknowns system with six redundant equations. We arrange it in order that γg , γn and τn are the unknowns. The path LS evolves according to the differential equation. To avoid convergence problems we use the following finite difference equation:
���+1 =��� −0.001∗ ����(����)
2.3. After the computation, we ensure that the whole path lies on the mesh by projecting on it the moved vertices. After this step, a new iteration is performed.
3. The resulting geodesic path is a good approximation of the true geodesic path but all its faces are not actually on a continuum. To obtain a continuum, we start from the first face and look among all the incident and adjacent faces which ones cut the geodesic path. We then take the adjacents and incidents to the new faces added until we reach the end of the path.
3.2.1 Smoothing
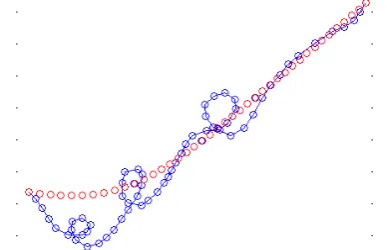
Because of the discretization of the differential equation and of the sampling, it is possible that both original contour and deformed one are not topologically equivalent. Specially, some loops can appear on the geodesic path (blue curve on Figure 4).
Figure 4 A curve with « loops » (blue) and the smoothed curve (red).
We propose a very simple smoothing algorithm to remove the loops from the geodesic path. We take each point P(i) of the curve and its neighbors P(i-1) and P(i+1). The new position of P(i) is computed as the weighted sum of P(i-1) and P(i+1) with the weights W such that W(i-1) is the distance (P(i), P(i+1)) and W(i+1) is the distance between (P(i), P(i-1)). Each weight is divided individually by the sum of the weights as a normalization process. This computation is iterated during an arbitrary number of steps (25 within our implementation). Figure 5 shows an example of a geodesic path computed with our algorithm on a mesh that represents an underwater aircraft wreck (Junker 55) in Marseilles, France.
Figure 5 A geodesic path enclosing an amphora (Junker 55 aircraft underwater wreck, Marseille, France)
3.2.2 Densification
The computation of geodesic curve on a mesh does not guarantee that all faces of the mesh that underlies the curve contains one of its vertex. For example, as we can see in Figure 6, mesh face ABC do not contains any vertex on the geodesic curve (in blue). We first test if the segment defined by the two green points (successive points of the geodesic) cuts ABC. If true, and if the intersection is between the green points, we add the intersection to the geodesic. Then, the faces that don’t intersect the geodesic are tested. P1 P2 and P3 are three planes perpendicular to the plane of the triangle, each point containing an edge. If the geodesic cuts one of the planes, the orthogonal projection of this intersection (red on figure 6) on ABC is kept as the point of the geodesic on the ABC face. The red points are added to the geodesic path.
Figure 6 geodesic curves on the mesh
3.3 Surface Extraction
We compute geodesic paths on meshes to measure lengths but also to extract surfaces. The surface extraction algorithm relies on the availability of a geodesic contour that bounds the surface to extract. We start from a face inside the contour and add it to a set G. While there are new faces, we take all the adjacents to the faces and add them to G if they do not cross the geodesic path. We take one face of G adjacent or incident to the geodesic. If there are not we look for the first face that satisfies this condition, we follow the boundary of G in the direction defined by the list of geodesic points. For each triangle we create a new point Q(n) associated to the point Pt of the triangle which is the closest point of the geodesic from Pt. This point is kept if the condition Q(n) is after Q(n-1) in the direction defined above is true. We then create two new triangles with (P(n) P(n-1) Q(n) Q(n-1)). The Figure 7 illustrate the surface extraction process to highlight an aircraft wreck cockpit within the 3D representation of the junker 55 aircraft underwater wreck.
Figure 7 A surface extracted from a geodesic contour (Junker 55 aircraft underwater wreck, Marseille, France)
4. IMPLEMENTATION
The aims of this work is to provide cultural heritage experts (archaeologists, architects ...) a single platform to perform measurement and documentation of sites. One of the main aspect of this work is the development of components that interface complex geometric computations (like the extraction of planes and surfaces extraction, the computation of geodesic curves) with experts needs (like the representation of a wall, the extraction of specific objects). Several solutions are available to deal with this kind of need like for example Agisoft Photoscan(c), Photo Modeler(c) and visual SFM to generate dense geometries from a set of photographs; Autodesk Mudbox(c) and Blender to draw on 3D models and extract pieces; Geomagic(c) and Meshlab to process dense clouds of points and meshes. However, the needs of the experts are transversal to these tools and do not require the whole functionalities of each tool.
We made the choice to develop a new 3D based platform that provides simple graphical user interface dedicated to functionalities that directly respond to experts need.
4.1 3D engine
We have choosen as 3D engine onto which the platform relies the JMonkey Engine (REF) as it is open source, quite efficient and modular. Moreover, the engine provide a Java API that makes the integration of new functionalities and eases the use its specific 3D modules within an external application. The core of the engine relies on a scene graph for the objects representation and on shaders for 3D real time processing.
4.2 User interface
The platform graphical user interface is simple with few controls. It is articulated around a 3D canvas (as illustrated in Figure 8) that provides a view of the object representations. User can interact with the objects directly from the canvas. Various toolbars enable to active various tools such as plane extraction, geodesic paths computation or surface extraction. The user interface also enable to export survey results within various formats (PLY, XML...) and into specific tools files.
Figure 8 The 3D platform main interface (view of a wall of the Shawbak Castle, Jordan)
In addition to 3D representation, some domain specific tools and forms are available to produce documentation within the same framework. The 3D rendering of a site can be photorealistic but can be also non-realistic.
4.3 Non photorealistic rendering
The 3D platforms can use shaders to provide real time post processed views of scenes. We have developed a specific shader
that enables to render in real time a site representation as it was a hand-made drawing. This functionality give the ability to avoid the interpretation of the site to be perturbed by ambient noise.
Figure 9 NPR rendering of the Junker 55 wreck.
Figure 8 illustrates the activation of NPR rendering on the Junker 55 site representation. We can easily see the aircraft above the seabed. Such a rendering is interesting for archaeologists as it is reminds their sketching methods. However, the provided NPR view is real time and do not need several hours to be completed.
5. CONCLUSION
In this paper we have described a new 3D platform dedicated to the survey of cultural heritage sites. This platform relies on the management of larges sets of 3D data by using optimisation methods, like the octrees and the k-d trees. It also provides efficient geometry processing algorithms such as the guided extraction of planes from dense clouds of points and such as the extraction of surfaces and the geodesic curves computation from 3D meshes. The platform is implemented on a robust 3D engine and keeps its efficiency even when dealing with large data (millions of 3D points). From the user point of view, the platform enables cultural heritage experts (like archaeologists, architects ...) to link specific knowledge and information with the raw 3D data by providing simple interfaces. This approach respond to a need of simplicity because even if it exists several tools to make a complete survey of a site (photogrammetric softwares, 3D modelling tools, databases, ...), there is not at this time a single tool that can manage the whole process of survey from the data acquisition until integration of semantic data.
This new platform will be the base for developing new functionalities in order to satisfy specific needs like the visual representation of stratigraphic and temporal relations between archaeological contexts of a site or the survey of coral growing along time.
6. ACKNOWLEDGEMENTS
This work was partially funded by the European Regional Development Fund (FEDER) and the French Inter-Ministry Fund (FUI) for funding research involving both academic laboratories and industry.
Figure 1, Figure 2 and Figure 3 are coming from the survey of the Shawbak castle, Jordan under the responsibility of the the Dipartimento di Studi Storici e Geografici, Università degli Studi di Firenze. Figure 5, Figure 6 and Figure 8 are coming from the survey of a Junker 55 aicraft underwater wreck. This survey has been performed by COMEX SA, Marseille.
7. REFERENCES:
References from Journals:
Dijkstra, E., 1959. A note on two problems in connexion with graphs. Numerische Mathematik, 1, pp. 269-271.
Bentley, J. L., 1975. Multidimensional binary search trees used for associative searching. Communications of the ACM, 18(9), pp. 509-517.
Mitchell, J. S. B., Mount D. M., Papadimitriou C. H., 1987. The discrete geodesic problem. SIAM Journal on Computing, 16(4), pp. 647-668.
References from Books:
Darboux, G., 1887. Leçons sur la théorie générale des surfaces et ses applications géométriques du calcul infinitésimal. Gauthier-Villars, 1, pp. 1-18.
Meagher, D. J. R, 1980. Octree Encoding: A New Technique for the Representation, Manipulation and Display of Arbitrary 3-D Objects by Computer. Rensselaer Polytechnic Institute, pp 50.
References from Other Literature:
Kimmel, R., Sethian, J. A., T., 1998. Computing geodesic paths on manifolds. In: Proceedings of the National Academy of Sciences of the United States of America, New-York, USA, Vol. 95, Issue 15, pp. 8431 - 8435.
Rongjie, L., Yonggang, S., Sicotte, N., Toga, A. W., 2011. Automated corpus callosum extraction via Laplace-Beltrami nodal parcellation and intrinsic geodesic curvature flows on surfaces. In proceedings of the IEEE International Conference on Computer Vision (ICCV), Los Angeles, USA, pp. 2034-2040.
Surazhsky, V., Surazhsky, T., Kirsanov, D. Gortler, S.J., Hoppe, H., 2005. Fast exact and approximate geodesics on meshes. In: Proceedings of the SIGGRAPH’05 International Conference, New-York, USA, Vol. XXIV, Issue 3, pp. 553 - 560.
References from websites:
JMonkey team, 2013. JMonkey engine website “Modern Java 3D”, Paris, France http://jmonkeyengine.org/ (5 Jul. 2013).