FROM DSM TO 3D BUILDING MODELS: A QUANTITATIVE EVALUATION
J.M. Macay Moreira a,b, F. Nex c, G. Agugiaro c, F. Remondinoc, N.J. Lim a
a
University of Gävle, Sweden ([email protected])
b
University of Extremadura, Spain ([email protected])
c
3D Optical Metrology unit, Bruno Kessler Foundation (FBK), Trento, Italy – (franex, agugiaro, remondino)@fbk.eu
Commission III, WG IV
KEY WORDS : 3D buildings, DSM, Quantitative analyses, Geometry, City Model, LoD
ABS TRACT:
The paper reviews the state-of-the-art in 3D city models and building block generation, with a description of the most common solutions and approaches. Then the digital reconstruction and comparison of LoD1 and LoD2 building models obtained with commercial packages and using different input data are presented. As input data, a DSM at 1m resolution derived from a GeoEye-1 stereo-pair, a DSM from an aerial block at 50 cm GSD and a LiDAR-based DSM at 1m resolution are used. The geometric buildings produced with each dataset are evaluated with respect to some ground-truth measurements but also compared between them. Problems such as the quality of the input DSM , the accuracy of the necessary vector datasets containing the building footprints, the flexibility of the approaches and the potentialities of each dataset will be discussed. As reconstruction of the building models is largely influenced by the quality of the building footprints, which may be out-of-date or slightly shifted with respect to the employed DSM s/DTM s, an in-house method is being developed to derive them starting from the produced DSM s.
1. INTRODUCTION
The way of representing Earth has changed in the last years. Classical two-dimensional (2D) maps have turned into three-dimensional (3D) realistic representations of rural and urban environment. For this reason, the extraction of geometric and semantic information from image and range data is one of the main research topics in the Geomatics community . In particular, 3D city models have shown to be a valid instrument for several applications such as solar radiation potential assessment, urban management and planning, land monitoring, pollutant diffusion, virtual tour, navigation, gaming, etc. Different typologies of building models can be classified according to their level of detail (LoD) (Kolbe et al., 2005; Haala and Brenner, 1999). The higher the level of detail, however, the longer is the time required to produce a 3D model, as the amount of manual editing and checks grows considerably and, as of today, fully automatic (and at the same time reliable) 3D building generation is not possible beyond LoD2 (Tack et al., 2012).
In general, the LoD in 3D building reconstruction depends on the quality of the input data, in terms of density and accuracy. Both 3D and 2D information can be used as input for a city model generation, and 3D information can be provided by photogrammetric Digital Surface M odels (DSM ) or LiDAR data, while planimetric information can be provided by orthophotos and vector building footprints, often provided by cadastral or topographic maps. In particular, LoD1 and LoD2 can be obtained using LiDAR data or DSM from airborne and satellite images.
The interest for automated solutions able to speed up and reduce the costs for 3D model generation has greatly increased (Haala and Kada, 2011). Several approaches have been developed to ease and speed up the creation of 3D building
models, from the early semi-automated approach like in (Gruen and Wang, 1998) to the more recent fully automated production of realistic 3D city models by Apple/C3. Automation is of course crucial when it comes to large cities with thousands (or more) buildings, but this should not be in conflict with the quality of the final product, in particular for national mapping agencies tasks.
This paper deals with the digital reconstruction of LoD1 and LoD2 building models obtained with commercial packages and different input data in order to assess the achieved geometric accuracy of the 3D building models. Several papers concerning the geometric accuracy for specific algorithms (Sirmacek et al., 2012; Oude Elberink and Vosselmann, 2011; Acka et al., 2010) or the comparison of different algorithms over the same benchmark (Rottensteiner et al., 2012; Kaartinen et al., 2005) have been already presented. The goal of most of these papers is to assess the algorithms in very specific conditions, often using accurate data as input. In this paper, a user-oriented investigation is conducted instead, evaluating the performance of commercial solutions and several typologies of data. In particular, data acquired at conventional (e.g. 1 m resolution) resolutions and provided by public administrations are used to assess the geometric accuracy in the building extraction and to associate the model quality to the input data. For this purpose, combinations of 2D and 3D data have been considered. Both satellite and airborne images for DSM extraction and medium resolution LiDAR data have been used. Building footprints digitised with different accuracies have been used, too. The 3D building geometric models produced with each dataset have been evaluated with respect to some ground-truth measurements, but also compared among them. Among the available packages, the Feature M anipulation Engine (FM E) and Building Reconstruction (BREC) were used. Problems such as the quality
of the input DSM and DTM , influence of the necessary cadastral maps, flexibility of the approaches and the potentialities of each dataset will be discussed.
In the following Section 2 the state of the art on building reconstruction is summarised. Then, in Section 3, the available datasets and the generated building models are described in order to introduce the comparison with the ground-truth (Section 4). Finally, in Section 5 the conclusions and the future developments are presented.
2. S TATE OF THE ART IN 3D CITY MODELLING
In literature, a huge number of algorithms for 3D building model generation has been presented, proposing very different approaches. Each of these works presents different peculiarities and is conceived for diverse applications that are often related to particular backgrounds or to deal with specific architectonic context: flat roofs for the U.S., pitched roof for the north Europe, data-driven approaches for historical city centres, etc. (please note: this list is just an intentional oversimplified classification for better understanding only!). Due to the high number of contributions, different criteria have been adopted to classify these algorithms (Brenner, 2005; Haala and Kada, 2010): the degree of automation, the use of parametric models to define the building geometries, and the typology of input and output data.
In general, the 3D model extraction can be manual, semi-automated or fully semi-automated. The manual systems consist in manual plotting, hence they don’t actually need specific algorithms. Regarding the semi-automated methods, the geometries of the building are automatically reconstructed after the manual identification of some salient roof corners (Gruen and Wang, 1998). Nowadays, the great p art of the algorithms proposed in literature is represented by the automated algorithms that extract a model using the input data without user intervention (Lafarge and M allet, 2012; Rottensteiner et al., 2007). However, in most of the cases, a post-processing editing is required to correct and improve the automatically achieved results.
The building generation can be further sub-divided into model-based and data-driven approaches (Brenner, 2005) according to the constraints that are used in the building model reconstruction. The model-based methods usually try to fit a parametric roof model to the input data (Henn, et al., 2013; Duruct and Taillandier, 2006; Kada, 2009; Avrahami et al., 2008), while, on the other hand, the data-driven approach reconstructs the roof model according to the input data: the roof is usually segmented and these approaches try to regularize the surveyed information to a roof model (Rottensteiner et al., 2002; Abo Akel et al., 2009; Dorninger and Northegger, 2007). Algorithms can be categorized also according to the input data. In practice, two main typologies can be defined: single-technique and multiple-technique algorithms. The formers exploit a single dataset as input: most of these approaches use LiDAR (Sohn et al., 2008; Sampath and Shan, 2009), but the number of scientific papers considering photogrammetric DSM s is quickly increasing (Nex and Remondino, 2012; Sirmacek et al., 2012; M eixner et al., 2011), as and the improvement of automated image matching
methods (Gehrke et al., 2010; Hirshmüller, 2008; Paparoditis et al., 2006) allows the generation of 3D point clouds which in the past were only achievable by LiDAR techniques. M ultiple-technique approaches use both 3D and 2D data to extract building geometries: 2D data consist generally of cadastral maps to provide the footprint of each building. The building footprint can otherwise be generated directly from DSM s (Lafarge et al., 2008; Vallet et al., 2011; Awrangjeb et al., 2010) or can be provided as already existing data. Additional information can be provided by RGB (Kim et al. 2009) or multispectral images (Guo et al., 2011; Sohn and Dowman, 2007; Habib et al., 2010) exploiting the complementary nature between range and image data. As a result, most methods deliver simple prismatic models (Lafarge et al., 2008; AboAker et al., 2009), while other methods deal with the generation of reliable meshes, in that a decimated version of the original point cloud is presented (Kuschk, 2013). This kind of applications are suitable for visualization purposes on the web (i.e. Apple/C3); nevertheless, any direct parameters about the dimensions of the building could be also achieved. In recent years, several private companies have produced commercial software for building extraction (e.g. BREC by VirtualCitySystem, TerraScan by TerraSolid, VRM esh by Virtual Grid, etc.). These products mainly use LiDAR point clouds as input to better classify the data and take advantage of the multi-echo information. In addition, other datasets such as building footprints and orthophotos are generally used to perform the generation of the 3D building geometries. According to the quality of the 3D and 2D data, good models can be achieved, but a post-processing editing is usually performed in order to correct and improve the quality of the automatically generated models. De facto, this check a poster ior i implies that a really fully automatic procedure for 3D building generation has not been delivered, yet. For this reason, several private companies are involved in the production of 3D city models over entire cities, with dedicated software and manual editing, providing services instead of reselling packages. images acquired in 2009, and one from VHR satellite stereo-pair images acquired in 2010. The different periods of acquisition does not affect the 3D reconstruction as the area of interest is characterized by new constructions or changes.
The LiDAR-based DSM consists of rasters (2x2 km tiles) at 1 m resolution. The other two DSM s are the result of photogrammetric procedures. The DSM from airborne images at 12 cm GSD was generated using the M icM ac software (Paparoditis et al., 2006), it has a grid resolution of ca. 50 cm over an area of approximately 1 km2 (i.e. ca. 4.5 million points). The DSM from satellite imagery was generated from a GeoEye
stereo-pair using the SAT-PP software. It has a grid resolution of 1 m, spans over an area of 1 km2 and consist of ca. 1 million points. All DSM s, in ASCII format, are in the WGS84-UTM 32 reference system. A more detailed explanation of the available data over Trento area is given in (Agugiaro et al., 2012).
(a) (b) (c)
Figure 1. Example of DSM data extracted from Geoeye stereo-pair (a), airborne images (b) and LIDAR data (c).
For each DSM , the free software ALDPAT (http://lidar.ihrc.fiu.edu/lidartool.html) was used to separate the nDSM and the DTM from the DSM s point clouds. Several tests were performed using this software in order to improve the quality of the output datasets, as they were successively used as input for the next steps.
3.2 2D data
When it comes to 2D datasets, two sources were used as input for the building footprints. Both are topographic maps, however at different nominal scales.
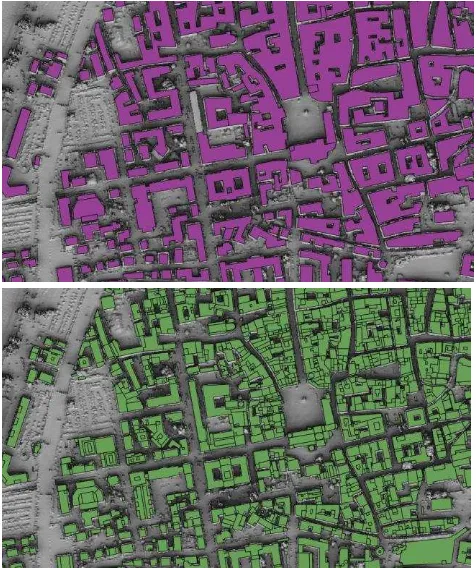
Figure 2. Example of used 1:10,000 map (top) and 1:1,000 (bottom) topographic maps.
The first, at nominal scale 1:10,000, covers the whole province of Trento and contains ca. 140,000 building footprints, and a rough classification of the building types (residential, religious, commercial/industrial, etc.). The building footprints are given for the single building or, sometimes, as a generalized group of adjacent buildings. The second one is a topographic map at nominal scale 1:1,000 and covers only the city of Trento. Unlike the previous ones, buildings are represented individually or, sometimes, they are segmented into sub-footprints, each one representing a specific building part. The different geometric characteristics can be best seen in Figure 2.
For each dataset, only those polygons falling inside the study area were extracted and used. For visual inspection, an orthophoto covering the study area was also used.
4. GENERATED BUILDING MODELS
The building models were generated using FM E and BREC software. Building REConstruction (BREC) is a software that generates 3D buildings models in LoD1 and LoD2 starting from a DTM and a DSM (e.g. from airborne LIDAR) and 2D building (e.g. cadastral footprints) as input data. This software was used for the city model generation of several large cities (i.e. Berlin). The outputs of the software are for example CityGM L and Esri (3D multipatch) shapefile and can be visualized in any software that supports such formats.
According to the software specifications, the LIDAR data needs to have a resolution of at least 1 m but a 2 m resolution is also sufficient for extracting building models at LoD1. The reconstruction results can be edited and refined using the DSM point cloud or orthophotos adapting the model to this data. M ore information about the software can be found in virtualcitySYSTEM S website.
FM E (Feature M anipulation Engine) is mainly a ETL (Extract, Transform, Load) software that translates spatial and non-spatial data to different formats. In addition, FM E offers a variety of tools to perform spatial analysis, data exploration and geo-processing activities. FM E 2013 includes 400 different transformers to carry out different types of operations. A mask of approximately 500x500 m was created in ArgGIS and all the data was clipped outside this mask region. Thus, the final data for this study consisted of three DSM s (at the original grid resolution), but having a dimension of 500x500m and, as a consequence, different numbers of points. The FM E and BREC models were exported in shp format. ArcScene was used to visualize the 3D models as well as query the building height data for later comparisons. The area of interest for the tests includes buildings of different shapes and heights.
4.1 LoD1
The LoD1 models were created using both the BREC and FM E software: the medium height of each building was defined by BREC and the models were generated in FM E using footprints and height information. In Figure 3, the results achieved with each of the three DSM s and the 1:10,000 map are presented. The results achieved with the different DSM s are very similar,
a) b) c)
Figure 3. LoD1 prismatic building models generated using the 1:10,000 topographic map with GeoEye DSM (a), airborne images DSM (b) and LiDAR DSM (c).
a) b) c)
Figure 4. LoD2 building models generated using the 1:1,000 topographic map with GeoEye DSM (a), airborne images DSM (b) and LiDAR DSM (c).
as the planimetry is defined by the topographic map. The height differences can be detected from a simple visual inspection. In particular the GeoEye model tends to overestimate the height value of little buildings close to higher ones.
This problem can be explained considering the DSM shape that is unable to define sharp edges and mutual occlusions in proximity of high and nearby buildings.
4.2 LoD2
The 3D building models obtained using the 1:1,000 topographic map are shown in Figure 4. Even from a simple visual inspection it can be observed that the roof reconstruction is very different according to the input data: the results achieved using the airborne and the LiDAR data and airborne images look better than the results achieved using the GeoEye DSM . This is mainly due to the higher level of noise of the satellite DSM .
5. COMPARIS ONS
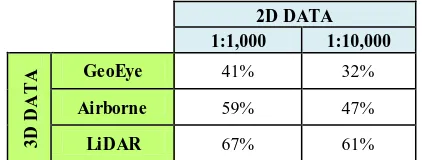
Selected building models were finally compared with the real dimension of actually surveyed buildings to assess the quality of the generated building models. A topographical survey was performed in order to determine the dimensions of some buildings on the test area. This survey was only compared with LoD2 models as LoD1 is just an oversimplified version of reality and a mean roof height value from real survey cannot be easily defined. A first comparison was performed by visual inspection aided by the orthophoto, considering the percentage of correctly reconstructed buildings according to their input data. In Table 1 the results achieved for the three datasets and both the topographic maps are presented.
The percentage of correctly reconstructed models is very similar for airborne and LiDAR data, while it is sensibly lower for GeoEye data. In general, the wrong reconstruction are more frequently in correspondence of complex buildings with different height discontinuities and irregular shapes.
Several buildings (17) of different shapes and dimensions were then considered on the test area, in order to define a reliable dataset of measures. In Figure 5 the surveyed buildings are shown in red. These test buildings were considered as they were representative of the building classes in the testfield and they did not have any accessibility problem.
2D DATA 1:1,000 1:10,000
3D
D
A
TA GeoEye 41% 32%
Airborne 59% 47%
LiDAR 67% 61%
Table 1. Percentage of correctly reconstructed building in the test area.
The tests considered all the model generated combining the 3D data (GeoEye, airborne and LiDAR) and the 2D data (1:10,000 and 1:1,000 topographic maps). The comparison was focused on both planimetric and height information in order to evaluate in a complete way the achieved results. As it can be guessed, the planimetric error was directly connected to the accuracy of the cadastral map used during the building model generation. In additions, from the comparisons, differences of up to 1 m were detected using the 1:10,000 map, while these values were reduced to 30 cm using the 1:1,000 map.
Figure 5. Test area and surveyed buildings for 3D model-ground truth comparison.
The height component comparison lead instead to very different results according to the used DSM as well as the topographic map. The results of this comparison are shown in Table 2 where the mean of the residual values are reported. From this table it emerges that that the higher level of accuracy in the topographic map influences the height accuracy of the resulting 3D building model: results in the first column are generally better than those in the second one.
2D DATA 1:1,000 1:10,000
3D
D
A
TA
GeoEye 1.94 m 2.06 m
Airborne 1.82 m 1.98 m
LiDAR 0.64 m 0.51 m
Table 2. M ean of the residual values for the different data.
This aspect can be confirmed also by the simple visual comparison. An example is proposed in Figure 6, where the 3D building models generated from the same 3D data (i.e. LiDAR), but using different planimetric maps, are shown: a higher level of detail in the 2D data allows, obviously, for a better model reconstruction.
Another important aspect shown in Table 2 is the lower accuracy of the height values achieved using the 3D data generated by photogrammetric processes. The problem of these data is mainly due to the DTM data than the DSM itself. The
Figure 6. Visual comparison between LoD2 models generated using LiDAR data and different cartographic maps: on the left
using 1:1,000 map and on the right using 1:10,000 map .
DTM automatically obtained by photogrammetric DSM is usually noise-affected and it has several discrepancies with
regards to the LiDAR-generated DTM . The photogrammetric DSM quality is influenced by several occlusions on narrow roads. As a consequence, the generated DTM presents several artefacts. This problem is particularly relevant when a simple stereo-couple or traditional overlaps between images are adopted (70% along track and 30% across track) as in the airborne acquisitions. Another reason might also be the quality of the filtering algorithms used in the ALDPAT software.
Figure 7. Test area and surveyed buildings for 3D model vs. ground-truth comparison: significant height differences are at the
building base.
Figure 7 shows the superimposed 3D building model generated with airborne DSM and LiDAR data: the red circles highlight regions where differences are concentrated. The roofs have generally the same height, while the building feet have different altitudes.
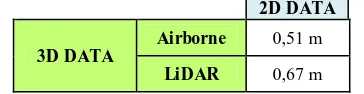
2D DATA
3D DATA
Airborne 0,51 m
LiDAR 0,67 m
Table 3. M ean absolute residual values of the 3D building models generated using LiDAR and airborne images and the
same DTM .
A final comparison was performed considering the building models generated using the airborne DSM and the DTM provided by LiDAR data, as shown in Table 3. The results shows the errors are very similar.
6. CONCLUS IONS AND FUTURE WORKS
The generation of 3D city models is becoming a valid instrument for several applications. Several academic and commercial solutions have been proposed in order to achieve accurate and detailed building models. M ost of these solutions integrate both 2D and 3D information to infer building models.
In this paper, a comparison of different building models, generated using different input data and approaches, has been performed. Topographic maps at different scales have been used. A set of commercial, free and open-source solutions have been used to generate DTM and building models. The performed tests have shown that results with different accuracies and
details can be obtained according to the combination of all input data.
Satellite images provide DSM s that are not ideal for an automated extraction of detailed building models. On the other hand, the modelling of roofs from both airborne and LiDAR data can be accurate and detailed.
Results are strongly influenced by topographic maps and DTM quality too. The scale of the topographic/cadastral datasets and the number of represented details can influence the quality of the 3D reconstruction. Up -to-date topographic maps are always needed in order not to miss complete buildings or parts of them. Secondly, the procedure to produce the DTM from the measured DSM can influence the height of the reconstructed building model. Photogrammetric DSM s are often not able to provide accurate information on narrow streets, in particular if conventional overlaps are adopted and streets are not visible at least in a stereo-pair. Therefore, the generation of DTM s from photogrammetric DSM s can be critical, especially if fully automated solutions are adopted.
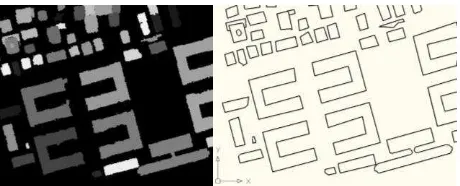
The performed tests has shown the importance of planimetric information in the building reconstruction procedure. Topographic maps affect the quality of building models in all the three dimensions in terms of geometric accuracy and completeness/correctness of the reconstruction. Detailed, updated and accurate topographic maps are not always available, therefore an in-house method is under development to derive cadastral maps starting from a DSM . The method was originally conceived for high resolution data and it is able to extract from a DSM the different building footprints and to define the building outlines as a set of lines or curves. Several improvements are still under progress to achieve a reliable cadastral data. Figure 8 shows an example of DSM and related sub-footprint automatically extracted and generalized.
Figure 8. Original DSM , building footprints and generalized contours.
ACKNOWLEDGEMENTS
This work was partially funded by the “CIEM Project” (co -founded M arie-Curie Actions 7th F.P. - PCOFOUND- GA-2008-226070, acronym “Trentino Project”) and by and the 3M project (co-founded M arie-Curie Actions FP7-PCOFOUND – GA-2008 226070, acronym “Trentino Project”, “Incoming Team 2009”).
REFERENCES
Abo Akel, N., Filin, S., Doytsher, Y., 2009. Reconstruction of complex shape buildings from LiDAR data using free form surfaces.
In: P hotogra mmetric Engineering & Remote Sensing, Vol.75(3). pp. 271-280.
Agugiaro, G., Poli, D., Remondino, F., 2012. T estField T rento: geometric evaluation of very high resolution satellite imagery .
ISP RS Anna ls of the P hotogra mmetry, Remote Sensing a nd Spa tia l Informa tion Sciences, Vol. 39(1), pp. 191-196.
Akca, D., Freeman, M., Sargent I., Gruen, A., 201 0. Quality assessment of 3D building data. In: the photgra mmetric record, Vol.25(132), pp. 339-355, December 2010.
Avrahami, Y., Raizman, Y., Doytsher, Y., A polygonal approach for automation in extraction of serial modular roofs. In:
P hotogra mmetric engin eering & remote sensing, Vol.74, n.11, pp. 1365-1378.
Awrangjeb, M., Ravanbakhsh, M., Fraser, C.S., 2010 : Automatic detection of residential buildings using LiDAR data and multispectral imagery. ISP RS Journa l of P hotogra mmetry a nd Remote Sensing, Vol. 65(5), pp. 457-467.
BREC - Building Reconstruction, www.virtualcitysystems.de
Brenner, C., 2005. Building reconstruction from images and laser scanning. In: Interna tiona l Journa l of Applied Ea rth Observa tion a nd Geoinforma tion. Vol.6, Issues 3-4, pp.187-198, March 2005.
Dorninger, P., Nothegger, C., 2007. 3D segmentation of unstructured point clouds for building modelling. P roc. of: P IA - P hotogra mmetric Ima ge Ana lysis, 2007.
Durupt, M., T aillandier F., 2006. Automatic building
reconstruction from digital elevation model and cadastral maps: an operational approach. In: IAP RS&SIS, Vol.36(Part 3/W24).
FME - Feature Manipulation Engine, http://www.safe.com
Gehrke, S., Morin, K., Downey, M., Boehrer, N., Fuchs, T ., 2010: Semi-global matching: an alternative to LiDAR for DSM generation?, IAP RS&SIS, Vol. 38(1).
Gruen, A., Wang, X., 1998: CC-Modeler: A topology generator for 3-D city models. ISP RS Journa l of P hotogra mmetry a nd Remote Sensing, Vol.53(5), pp.286-295.
Guo, L., Chehata, N., Mallet, C., Boukir, S., 2011. Relevance of airborne lidar and multispectral image data for urban scene classification using Random Forests. In: ISP RS Journa l of P hotogra mmetry a nd Remote Sensing. Vol. 66, pp.56-66.
Haala, N., Kada, M., 2010: An update on automatic 3D building polyhedral building models by integrating stereo aerial imagery and LiDAR data. P E&RS,, Vol. 76(5), pp. 609-623.
Henn, A., Groger, G., Stroh, V., Plümer, L., 2013. In: ISP RS Journa l of P hotogra mmetry a nd Remote Sensing, Vol. 76, pp.17-29.
Hirschmüller, H., 2008: Stereo processing by semi-global matching and mutual information. IEEE Tra ns. on P AMI, Vol. 30(2), pp. 328-341.
Kaartinen, H., Hyyppä, J., 2006. EuroSDR-project Commission 3
“Evaluation of building extraction”. F ina l Report. EuroSDR-Europea n Spa tia l Da ra Resea rch. Official publication 50 pp. 9-77.
Kada, M., 2009. T he 3D Berlin project. In: Fritsch, D., (Ed.),
P hotogra mmetric Week 2009. Wichmann, Verlag, Heidelberg, pp. 331.340.
Kim, C., Zhai, R., Habib, A., 2009. Complex digital building model generation through the integration of photogrammetric and
LiDAR data. P roc. of: ASP RS 2009 Annua l Conference,
Ba ltimore, USA.
Kolbe,T ., Gröger, G., Plümer, L., 2005. CityGML-Interoperable Access to 3D City Models. In Z. F. Oosterom, Geo-informa tion for Disa ster Ma na gement, pp. 883-899, New York: Springer.
Kuschk, G., 2013. Large scale urban reconstruction from remore sensing imagery. In: IAP RS&SIS, Vol.XL-5/W1, 2013.
Lafarge, F., Mallet, C., 2012. Creating large-scale city models from 3D-point clouds: a robust approach with hybrid representation. In:
Interna tiona l Journa l of Computer Vision, Vol. 99(1): pages 69-85.
Lafarge, F., Descombes, X., Zerubia, J., Pierrot -Deseilligny, M., 2008. Automatic building extraction from DEMs using an object approach and application to the 3D –city modelling. In: ISP RS Journa l of P hotogra mmetry a nd Remote Sensing, Vol.63, pp.365-381.
Meixner, P., Leberl, F., Brédif, M., 2011. 3D roof details by 3D aerial vision. P roc. of: IEEE Interna tiona l Conference on Computer Vision Workshops, pp. 212-218.
Nex, F., Remondino, F., 2012: Automatic roof outlines reconstruction from photogrammetric DSM. ISP RS Anna ls of the P hotogra mmetry, Remote Sensing a nd Spa tia l I nforma tion Sciences, Vol. I(3), pp. 257-262.
Oude Elberink, S., Vosselmann, G., 2011: Quality analysis on 3D building models reconstructed from airborne laser scanning data. ISPRS Journa l of P hotogra mmetry a nd Remote Sensing, Vol. 66(2), pp. 157-165.
Paparoditis, N., Souchon, J-P. Martinoty, G., Pierrot -Deseilligny, M., 2006: High-end aerial digital cameras and their impact on the automation and quality of the production workflow. ISP RS Journa l of P hotogra mmetry & Remote Sensing, Vol. 60(6), pp. 400-412.
Rottensteiner, F., Sohn, G., Jung, J., Gerke, M., Baillard, C., Benitez S., Breitkopf, U., T he ISPRS benchmark on Urban object classification and 3D building reconstruction. P roc. of: XXII ISP RS Congress Melbourne 2012.
Rottensteiner, F., T rinder, J., Clode, S., Kubik, K., 2007. Fusing Airborne laser scanner data and aerial imagery for the automatic extraction of buildings in densely built -up areas. IAP RS&SIS, Vol. 35, pp.512-517.
Rottensteiner, F., Briese, F., 2002: A new method for building extraction in urban areas from high-resolution LiDAR data.
IAP RS&SIS, Vol.34(B3-A), Graz, Austria, pp. 295-301.
Sampath, A., J. Shan, 2008: Building Reconstruction from Airborne LiDAR Data Based on Clustering Analysis. IAP RS&SIS, Vol. 37(B3a), Beijing, China.
Sirmacek, B., Taubenbӧck, H., Reinarts, P., Ehlers, M., 2012. Performance evaluation for 3D city model generation of six different DSMs from air- and speceborne seonsors. In: Journa l of
selected topics in a ppled ea rth observa tions a nd remote sensing. Vol. 5, n.1, February 2012.
Sohn, G., Dowman, I., 2007. Data fusion of high -resolution satellite imagery and LiDAR data for automatic building extraction. In: ISP RS Journa l of P hotogra mmetry a nd Remote Sensing, vol.62, pp. 43-63.
T ack, F., Buyuksalih, G., Goossens, R., 20 12. 3D building reconstruction based on given ground plan information and surface models extracted from spaceborne imagery. ISP RS Journa l of P hotogra mmetry a nd Remote Sensing, 67, pp. 52-64.
Vallet, B., Pierrot -Deseilligny, M., Boldo, D., Brédif, M., 2011 : Building footprint database improvement for 3D reconstruction: A split and merge approach and its evaluation. ISP RS Journa l of P hotogra mmetry a nd Remote Sensing, Vol. 66(5), pp. 732-742.