__________________________________________
HIGH RESOLUTION TEMPORAL NORMALIZED DIFFERENCE VEGETATION
INDICES FOR SPECIFIC CROP IDENTIFICATION
P. Upadhyaya,*, S.K. Ghosha, A. Kumarb
a
Indian Institute of Technology, Roorkee, India-(priyadce,
scangfce) @iitr.ernet.in
bIndian Institute of Remote Sensing, Dehradun, [email protected]
Commission WG I/4, III/4, IC IV/VIII, VII/2
KEYWORDS: WorldView-2; Possibilistic c-Means; Entropy; Temporal NDVI, Specific Crop.
ABSTRACT:
In many applications of the remote sensing, an user is often interested in identifying specific land cover only while other classes may be of no interest. In the present study, high resolution WorldView-2 image having spatial resolution of 1.84 meter has been used for identifying wheat crop for a test site located in Roorkee, India. WorldView-2 data consists of a total of eight spectral bands out of which last four spectral bands i.e. Red (630-690 nm), Red edge (705-745 nm), NIR 1 (770-895 nm) and NIR 2 (860-1040 nm) are useful for the vegetation related studies. Since Normalized Difference Vegetation Index (NDVI) which is formulated by the Red and NIR band, is well known for vegetation related studies. Therefore, in the present research the above four bands has been used to generate all the four possible combinations of NDVI viz. Red - NIR1, Red edge – NIR 1, Red – NIR 2 and Red edge – NIR 2. Further to study the temporal behaviour of crops, two date WorldView-2 data was taken to make the temporal NDVI. These temporal NDVI were then classified using fuzzy based Possibilistic c-Means (PCM) soft classification. The weighting exponent (or fuzzifier) m was optimized to get the best PCM soft classification output. Wheat crop is represented as the fraction image output of the PCM soft classification corresponding to each temporal NDVI. To check the accuracy of these fraction images, the entropy method was used. The entropy values were calculated for a total of 150 known pixels in each output. It is found that the outputs corresponding to low entropy values have sufficiently high membership values for wheat class, hence these outputs are more accurate. Further, it is observed that the average entropy values found for the temporal NDVI corresponding to the Red – NIR 1, Red edge – NIR 1, Red – NIR 2 and Red edge – NIR 2 are 0.065, 0.089, 0.075 and 0.055 respectively. Thus, it can be concluded that temporal NDVI generated by using a combination of Red edge and NIR-2 bands yields higher accuracies in comparison to other. It was also observed from the study that the optimized values of weighting exponent m is varies for different spectral indices.
1. INTRODUCTION
For an efficient agricultural resource management and natural vegetation protection, up-to-date information about the location and acreage is required. Traditionally, the information about the area of a particular crop present in the field are collected through manual field surveys which is an expensive and time consuming process. The use of remote sensing techniques in retrieving information about the specific agriculture crop can provide a cheap and faster alternative to conventional data collection methods. With the improvements to the sensor and image processing technology, there is a trend to use the remote-sensing technology for identification and mapping of specific crops grown in the agriculture fields. This crop database can be used for yield estimation as well as the study of yearly basis crop pattern. There remains an overlap between the different classes while working with single date remote sensing image for extracting specific crop (Panigrahy et al., 2009). This overlap can be minimized by using the temporal remote sensing data to account for phenological changes in a crop.
Vegetation indices are used for global monitoring of vegetation conditions and are used to display land cover and land cover changes. These data may be used for characterizing land surface biophysical properties and processes, including primary production and land cover conversion. Thus, the
vegetation indices observed over a period (known as temporal vegetation indices) can help for the further classification of vegetation as a crop or specific vegetation. If this period is corresponds to the phenological cycle of a specific crop, then it further strengthens the identification of the crop.
Earlier, temporal remote sensing vegetation indices data sets have used in many studies in remote sensing. The high spatial resolution temporal multispectral Normalized Difference Vegetation Index (NDVI) was not used so far for the identification of specific crop. In this study the high resolution temporal WorldView-2 NDVI data was used for specific crop identification. Furthermore, a comparative assessment of all possible four NDVI, generated from the Red, Red edge, NIR 1 and NIR 2 band of WorldView-2 has also been carried out.
2. LITERATURE
The NDVI was first introduced byRouse et al., (1973) in order to separate the green vegetaion form its background soil brightness. It was formulated using the Landsat MSS digital data as:
where reflectance at near infra red (NIR) band and is reflectance at red band.The NDVI values ranging from -1 to 1. The negative NDVI represents the non vegetated area while the positive values represent the vegetated areas.
Wang and Tenhunen, 2004 used the multitemporal NDVI data from AVHRR for vegetation mapping. Unsupervised k-means and supervised minimum distance classification methods have been applied on the temporal NDVI and its derived matrices. Classifications based on the NDVI temporal profile matrices have performed better than those the derived matrices. Xiao et al., 2006 mapped paddy rice field of south Asia and south East Asia usingthe multi-temporal MODIS images. They applied the paddy rice mapping algorithm that uses the time series of MODIS derived vegetation indices. The resultant map was compared with the agricultural statistical data at national and sub national level. The output for the MODIS rice algorithm was similar to the database derived from the census statistics.
Alcantara et al., 2012 used the multi-temporal MODIS 250m NDVI data for abandoned agricultural field mapping. The phenological parameters calculated from the TIMESAT were used as input parameter while classifying it through the SVM. Abandoned agricultural field mapped with an overall accuracy of 65% for a growing season. Although the multiple years MODIS NDVI data did not increase the classification accuracy but by using phenology matrices, the classification accuracy increases by 8%.
Upadhyay et al., 2012 used the Class Based Sensor Independent (CBSI) NDVI to study the effect of add on WorldView-2 band for specific crop identification using the temporal two date dataset. It was found in their study that the existing bands five, seven and new bands four, six, eight in WorldView-2 are important for identifying and mapping the crops.
3. SOFT CLASSIFICATION APPROACH
The soft classification approaches can help in quantifying the uncertainties in the areas of transition between different types of land cover (Ibrahim et al., 2005). The Fuzzy c- Means (FCM) introduced by Bezdek et al., (1984) is one of the popular approach for the soft classification. Krishnapuram and Keller, 1993 added a new term to the FCM approach to make the Possibilistic c-Means (PCM) approach. The specificity of this new term is that, it emphasizes the representative point and de-emphasizes the unrepresentative point present in the data. Furthermore, the presence of untrained class does not affect the classification outputs in the PCM (Foody, 2000). Although the FCM and PCM are unsupervised classifier, yet they can be used in the supervised mode by providing the class (or cluster) means directly from the training dataset (Foody, 2000). The objective function for the PCM classifier (Krishnapuram and Keller, 1993) is given by Equation (2)
… (2) between and , is vector denoting spectral response of a pixel , is a collection of vector of cluster centres of class , and are total number of clusters and pixels respectively, is the weight matrix, is weighting exponnent and is the suitable positive number .
In Equation (2), the first term demands that the distances from the feature vectors to the prototypes be as low as possible, whereas the second term forces the to be as large as possible, thus avoiding the trivial solution. By considering the objective function of the PCM from equation the membership value can be calculated by the Equation (4)
… (4) for PCM can be calculated. Thus, it can be concluded here that the PCM classifier can be used for the single land cover Alluvial plains category. Main agricultural crops found in this region are sugarcane, wheat, paddy, oil seed, mustard and maize. The two dates (10 March 2010 and 10 May 2010) WorldView-2 satellite temporal data have been taken for the research work. The details and specification of different sensor of WorldView-2 satellite have been givne in Table 1
.
Table 1: Spectral bands of WorldView-2 data
5. METHODOLOGY
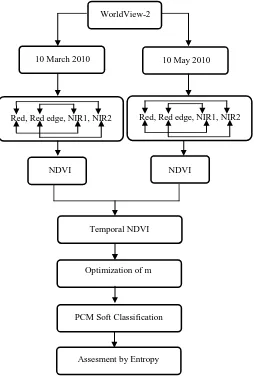
To achieve the desired results, a well structured methodology has been defined (Figure2). In order to identify the wheat fields on the satellite, GPS based GCPs have been collected and used for subsequent registration of satellite data.
Figure 2: Flow chart for the methodology
The raw data of WorldView-2 was first preprocessed for the geometric and atmospheric correction. By using the last four bands of WorldView-2 data, four possible NDVI combinations have been generated for each date. The NDVI generated from the same band combination of different date were then stacked to make the temporal NDVI. These temporal NDVI were then used for the identification of wheat crop for the fuzzy based PCM soft classification using the Automatic Land Cover Mapping (ALCM) module available in Sub-Pixel Multi-Spectral Image Classifier (SMIC) (Kumar et al., 2006). ALCM module has the capability to process temporal multi-spectral images for specific land class identification at sub-pixel level using a supervised approach. In order to have a good identification of a class, the membership of that class should be equal to 0.996, which will be controlled by the parameter weighting exponent m in PCM. So an optimization of m is required. This value of m will then be used subsequently. For the assessment of accuracy of the fraction image generated from the PCM classification, the entropy method has been used. Entropy is a measure of disorder and is an absolute indicator of uncertainty (Dehghan and Ghassemian, 2006). It is expressed as
... (5)
where , for
where denotes the number of classes and is the estimated membership function of class for pixel .
For a good classification entropy values should be close to zero.
6. RESULTS AND DISCUSSION
6.1 Optimization of Weighting Exponent:
PCM soft classifications outputs were generated by varying the weighting exponent m from 1.1 to 10. The output of PCM soft classificaiton is represented in terms of the fraction image corresponding to the wheat crop. The output membership values were ploted against the varying values of weighting exponent m as shown in Figure 3. It was obseved that for initial values of m the output memberships for wheat class were close to 1, leading to over emphasizing the wheat crop. It is observed that at m=1.1, the membership value of the wheat is 1, but as m is increased to 1.3 the membership values is 0.996 and remains constant.
It is found that the optimized value of weighting exponent m for NDVIRed-NIR1, NDVIRed edge-NIR1, NDVIRed - NIR2 and NDVIRed
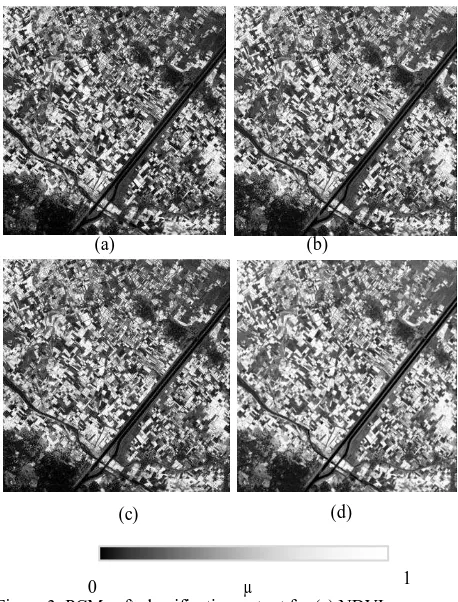
edge – NIR2 were 2.4, 2.0, 2.3 and 1.8 respectively (Table 2). The soft classification outputs corresponding to these m values are shown in Figure 3. In these output the membership value of 1 means that the pixel belongs completely to wheat, while membership value of 0 means that the pixel does not belongs to wheat and any value between 0 and 1 means that the pixel belongs partially to wheat.
Figure 3: PCM soft classification output for (a) NDVIRed - NIR1 (b) NDVIRed edge - NIR1 (c) NDVIRed-NIR2 (d) NDVIRed edge – NIR2
6.2 Assessment using Entropy:
To assess the accuracy of PCM soft classification, entropy values were evaluated for each fraction image output of wheat crop. A total of 150 testing samples were taken to calculate the average entropy values for each spectral indices. These average entropy along with the membership value are represented in Table 2 for each spectral indices.
Table 2: Average membership and entropy values of wheat crop for the optimized m value
From Table 2, it can be observed that the average entropy values of wheat crop are low for all spectral indices. The lowest enropy of value 0.055 was found for the NDVI combination of Red edge and NIR2. It is found that the output corresponding to
low entropy values have sufficiently high membership values for wheat class, hence these outputs are more accurate.
7. CONCLUSION
In this study, the high resolution WorldView-2 temporal NDVI data was used for the identification of wheat crop. Two date WorldView-2 data was used for this purpose. For each date, the last four spectral bands of WorldView-2 were used to make the possible four NDVI. The NDVI from each date were then used to make the temporal NDVI. From this study, it can be concluded that the all temporal NDVI generated from WorlView-2 are able to identify the specific crop (wheat) with sufficiently low entropy value. Furthermore, the temporal NDVI generated from the Red edge- NIR2 have produced the lowest uncertainty followed by Red- NIR1, Red- NIR2 and Red edge- NIR1. It can also be observed from this study that the optimized value of weighting exponent m varies for different spectral indices.
8. REFERENCES
Alcantara, C., Kuemmerle, T., Prishchepov, A.V. and Radeloff, V.C., 2012. Mapping abandoned agriculture with multi-temporal MODIS satellite data. Remote Sensing of Environment, 124, pp. 334–347.
Bezdek, J.C., Ehrlich, R. andFull, W., 1984. FCM: The Fuzzy C-Means Clustering Algorithm.Computers & Geosciences, 10 (2-3), pp 191-203.
Dehghan, H. and Ghassemian, H., 2006. Measurement of uncertainty by the entropy: application to the classification of MSS data. International Journal of Remote Sensing 27, pp 4005 – 4014.
Foody, G.M., 2000. Estimation of sub-pixel land cover composition in the presence of untrained classes. Computers & Geosciences, 26, pp. 469- 478.
Ibrahim, M.A., Arora, M.K. and Ghosh, S.K., 2005. Estimating and accommodating uncertainty through the soft classification of remote sensing data. International Journal of Remote Sensing, 26(14), pp. 2995-3007.
Krishnapuram, R. and Keller, J.M., 1993. A possibilistic approach of clustering. IEEE Transaction on Fuzzy Systems, 1, pp. 429-437.
Kumar, A., Ghosh, S. K. and Dadhwal, V. K., 2006. Sub-pixel land cover mapping: SMIC System. ISPRS International Symposium on "Geospatial Databases for Sustainable Development, Goa, India, September 27- 30.
Panigrahy, R.K., Ray S. S. and Panigrahy, S., 2009. Study on the utility of IRS-P6 AWIFS SWIR band for crop discrimination and classification. Journal of Indian Society of Remote Sensing, 37, pp. 325-333.
Rouse, J.W., Haas, R.H., Schell, J.A. and Deering, D.W., 1973. Monitoring vegetation systems in the Great Plains with ERTS. Third ERTS Symposium. NASA SP-351(1), pp. 309-317.
Spectral Indices m Membership
value
Entropy
NDVIRed - NIR1 2.4 0.953 0.065
NDVIRed edge - NIR1 2.0 0.935 0.089
NDVIRed-NIR2 2.3 0.946 0.075
NDVIRed edge – NIR2 1.8 0.960 0.055
(a) (b)
(c) (d)
Upadhyay, P., Kumar, A., Roy, P.S., Ghosh, S.K., and Gilber, I, 2012. “Effect on specific crop mapping using WorldView-2 multispectral add-on bands: soft classification approach” Journal of Applied Remote Sensing 6, 063524.
Wang, Q. and Tenhunen, J.D., 2004. Vegetation mapping with multi temporal NDVI in North Eastern China Transect (NECT). International Journal of Applied Earth Observation and Geoinformation, 6, pp. 17–31.
Xiao, X., Boles, S., Frolking, S., Li, C., Babu, J.Y., Salas, W., and Moore, B., 2006. Mapping paddy rice agriculture in South and Southeast Asia using multi-temporal MODIS images. Remote Sensing of Environment, 100, pp. 95–113.