A GEOSPATIAL TIME-AWARE WEB INTERFACE TO DELIVER INFORMATION
ABOUT AIR POLLUTION AND EXPOSURE IN A BIG CITY AND ITS SURROUNDINGS
M. P. Bogliolo a, *, G. Contino a
a INAIL, Italian Workers Compensation Authority, Research Division, Via Alessandria 220/A, 00198 Rome, Italy - [email protected], [email protected]
KEY WORDS: GIS, Web Based, Pollution, Multitemporal, Atmosphere, Urban
ABSTRACT:
A GIS-based web-mapping system is presented, aimed at providing specialists, stakeholders and population with a simple, while scientifically rigorous, way to obtain information about people exposure to air pollution in the city of Rome (Italy). It combines a geo-spatial visualization with easy access to time dimension and to quantitative information. The study is part of the EXPAH (Population Exposure to PAHs) LIFE+ EC Project, which goal is to identify and quantify children and elderly people exposure to PM2.5-bound Polycyclic Aromatic Hydrocarbons (PAHs) in the atmosphere of Rome, and to assess the impact on human health. The core of the system is a GIS, which database contains data and results of the project research activity. They include daily indoor and outdoor ground measurements and daily maps from simulation modeling of atmospheric PAHs and PM2.5 concentration for the period June 2011-May 2012, and daily and average exposure maps. Datasets have been published as time-enabled standard OGC Web Map Services (WMS). A set of web mapping applications query the web services to produce a set of interactive and time-aware thematic maps. Finding effective ways to communicate risk for human health, and environmental determinants for it, is a topical and challenging task: the web mapping system presented is a prototype of a possible model to disseminate scientific results on these items, providing a sight into impacts of air pollution on people living and working in a big city, and shipping information about the overall exposure, its spatial pattern and levels at specific locations.
* Corresponding author
1. INTRODUCTION
The EC funded LIFE+ EXPAH (Population Exposure to PAHs) project (http://www.ispesl.it/expah/index.asp) (conclusion June 2014), points towards addressing the environmental and health problems caused by emission, dispersion and transformation of Polycyclic Aromatic Hydrocarbons (PAHs) in the atmosphere. Its overall goal is to identify and quantify exposure among children and elderly people to PAHs content in particulate matter in the city of Rome (Italy), and to assess the impact on human health (Gariazzo et al., 2014). One of the project tasks is the development of a Geographic Information System (GIS) aimed at sharing information among partners and disseminating results to the public.
EXPAH is a multi-disciplinary project, since it deals with the whole path of a pollutant, from the emission sources to effects on human health. Specialists in atmospheric physical and chemical processes, in simulation modeling, in pollution assessment, in exposure mechanisms and in epidemiology are involved.
Studies like EXPAH, aimed at investigating one or more
aspects of the so called “exposome” (Wild, 2012), can greatly benefit of GIS techniques to discover spatial patterns and spatial relationships among several environmental factors and determinants affecting human health. Moreover, achieved results are of great and urgent interest not only for the scientific community but also for entities in charge of implementing regulations and policies, and for the exposed population: difficulties in finding a simple way to present the collection of available information could limit the success in sharing and communicating the overall results and the effectiveness of adopting adequate measures accordingly.
A geographical platform accessible from the web is one possible way to overcome these limits. However, each of the disciplines involved has its own way of storing, displaying data and presenting results: these aspects are determined by the specific approach to data analysis, that is not necessarily referred to a geographic coordinate system. As a consequence, the GIS specialist is required to build a coherent model to manage very different data types, and to emphasize spatial information of data that are often mainly handled by a different point of view, e.g. along the timeline. These aspects were faced and worked out in a GIS-based time-aware web-mapping system devoted to convey information about air pollution and people exposure in the city of Rome and in its outskirts.
2. THE GEOGRAPHIC INFORMATION SYSTEM
The first step towards a web mapping platform aimed at illustrating a multidisciplinary study is to convert data produced by the different activities into a homogeneous, organized, structured and self-describing dataset: in other words to design, create and populate a GIS.
A first attempt to obtain consistent and valid data to be inserted in the GIS was carried out providing the project teams with a
“Geographic data handling baseline Guide”, containing basic
information on geo-spatial concepts, requirements and indications about aspects needing shared choices. Spatial reference, coordinate accuracy, metadata, spatial models, data formats, possible issues and ways to overcome them, warnings about ancillary data already in use, availability of validated ancillary datasets, were the main topics of the guide.
The GIS organization and the web maps design have to fit the needs and interests of potential users, and the actual data they will contain. For this reason, in the first phase of the project development, a questionnaire was also distributed to the project teams, to collect information about data owned, needed, expected to be produced, and about their formats, metadata, and possible geo-processing and display strategies of interest.
The usefulness of the guide was very poor, and nobody filled the questionnaire. The lesson learned is that a guideline cannot substitute a geographic culture that requires time and experience to be acquired, even among disciplines that could take advantage of it. Most work towards interoperability has still to be done on the data after they have been produced, to format the datasets and to add, check, fix and validate both geospatial information and metadata.
The GIS was then developed step by step, following the development of the project. It collects and handles the time-varying data produced by EXPAH, enhancing the geospatial point of view of information that could take advantage of it, and includes a set of ancillary data coming from open/public sources to provide the actual geographic context to the project results.
2.1 Input datasets and data pre-processing monitoring sites: they include data from continuously monitoring air quality network stations, data sampled during experimental campaigns at different microenvironments (schools, offices, private houses, bus/car tracks) (Gatto et al., 2013), and personal exposure data from samplers worn by volunteers (Gatto et al., 2013, Gherardi et al., 2013). These data were acquired on different time windows between April 2011 and October 2012, with different time steps (daily and weekly averages) and were provided in spreadsheet tables, grouped by pollutant, without georeferencing information. Characteristics of the meteorological stations which data were used to feed the air pollution simulation model. Also in this case both continuously acquiring stations and stations set up for the project have been used.
Daily concentrations of PAHs, Benzo[a]Pyrene (B[a]P) and PM2.5 in the first layer of the atmosphere, calculated by simulation modeling at the nodes of a horizontal grid, 1 km resolution, on a 60x60 km2 domain centered on the city of Rome (Gariazzo et al., 2013, Silibello et al., 2014). Data refer to one year of simulations (June 2011 – May 2012) and were provided in netCDF datasets, an archive data format widely used in the atmospheric science community (Rew and Davis, 1990). Km units were used for coordinates; no georeference metadata were included. Annual averages were also provided.
Gridded emission data for year 2009 and for various pollutants obtained by disaggregation/integration of emission inventory data (Radice et al., 2012). These data served as input to the simulation model; they were provided in a netCDF file including both geographic and projected coordinates, but incomplete georeference
metadata. Diffuse, point and linear emission inventory data used to calculate the emission maps were also provided as shapefiles.
Daily PAHs, B[a]P and PM2.5 individual exposure values for two target subjects (young/elders) and daily total PAHs toxicity equivalent concentrations (TTECs). Exposure was calculated starting from the modeled concentration fields using exposure models and mean time activity schemes developed during the project (Gariazzo et al., 2014). PAHs TTEC expresses the PAHs concentration as the sum of the concentrations of the provided on the same grid and in the same format. Annual and seasonal averages were also provided.
Data have been organized according to a logical model that groups them by theme, identifying 4 thematic sections. The Atmosphere Properties section is devoted to data acquired by direct measurements: it includes location and description of the chemical and meteorological stations and data acquired at the various microenvironments and with the personal samplers. The Cartography section contains reference and ancillary cartographic data coming from public/open sources (e.g. administrative boundaries, road network, digital elevation models). The Emissions section includes the average emission maps for year 2009 and the point, diffuse and traffic emission inventory data used to produce them. The Modeling section groups the simulation modeling results. The Health Risk section collects the exposure maps, the TTEC PAHs maps and other ancillary data specifically included to help interpretation of the exposure maps (e.g. population distribution and density, schools, hospitals).
A vector representation model was used for all the ground sites, and for most ancillary data, while a raster model was used to represent parameters continuously varying across the domain, i.e. the concentration, emission and exposure fields. A common projected coordinate reference system (CRS) was used, converting the coordinates when necessary. All data are projected in the UTM system, zone 32N, on the WGS84 datum: this latter is considered to be coincident with the INSPIRE (European Union, 2007) mandatory reference datum, ETRS89, at the scales of representation used in the study (less than 1:10000).
Most datasets underwent a processing to make them suitable for GIS and web mapping. When the spatial information was not available, it was created (e.g. car/bus tracks were traced and then extracted from the road network dataset having traffic information that was transferred as attributes of the tracks; the point monitoring sites were first geocoded from the address and then further positioned using Google Earth and Google maps images; coordinates of the air quality network stations were downloaded from the owner government entity websites); measurements were linked to geometry through a code identifying the site and attributed with one or two (for time-intervals) time fields, where a timestamp temporally locates each feature and its attributes. Attribute tables containing general information and pictures about the measurement sites were built starting from descriptive information sheets prepared by the teams responsible for data acquisition. Personal exposure The International Archives of the Photogrammetry, Remote Sensing and Spatial Information Sciences, Volume XL-2, 2014
measurements were georeferenced through the living house of the volunteers, assumed to be the “center of gravity” of their activities in consideration of their age (elders and children).
Suitable ancillary information was extracted from public/open datasets: for example, population density maps for total population and for two age ranges (0-15y and >65y) were calculated from demographic data per census tract (ISTAT, 2013); suitable land-use classes were obtained by selecting and remapping classes of the CORINE2006 land cover map (EEA, 2007).
GDAL (OSG Foundation, 2013) libraries enable opensource GIS software to open and interpret netCDF datasets. However our experience, confirmed by literature (see for example UNIDATA, 2011) demonstrated that the various types of netCDF formats (the quite old COARDS convention was used in the project), and the lack of tight standards for georeference metadata, still prevent a full interoperability of this format in GIS tools. So, while desktop platforms were able to load the files, after a pre-processing to integrate missing georeference metadata and to convert coordinate units from km to m, the GIS server (GeoServer, see next paragraph) did not. To get around the problem, we exported the netCDF datasets in GeoTiff. Some files contained a single grid dataset, that was simply exported in a single GeoTiff file; the multi-temporal model simulations were contained in 366 layers (one year of daily simulations) netCDF files: each simulation was exported first in a multiband GeoTiff and then in a set of 366 GeoTiff files. These latter were named with a timestamp to make them ready to be published as a web service (see next paragraph).
2.2 EXPAH-GIS architecture
The HW/SW architecture of the EXPAH GIS is shown in Figure 1.
Figure 1. EXPAH-GIS Client/Server architecture
It is based on open-source software. Data are pre-processed on desktop platforms using mainly QGIS software (QGIS Development Team, 2013). The ToolsUI-4.3 Java application from UCAR/UNIDATA was used to explore the netCDF
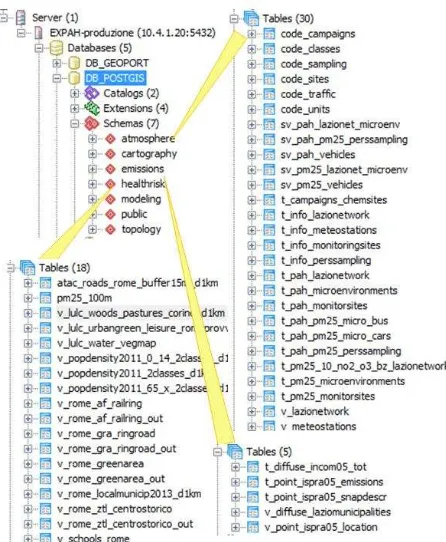
datasets and edit their metadata. Vector and table data are stored in a geographic database using the PostgreSQL/PostGIS DBMS: the logical model of the dataset is replicated in the database using different schemas for each theme (Figure 2). The raster Geotiff datasets are stored directly in the file system.
Vector and raster datasets have been published as standard OGC (Open Geospatial Consortium) Web Services (WMS 1.3.0, WFS 2.0.0, WCS 1.1.1) using GeoServer 2.4.0 (GeoServer, 2014) under Apache Tomcat 7 as the GIS server. Every service containing varying information was time-enabled. The “netCDF” extension of GeoServer enables direct publishing of multitemporal netCDF data. However, as stated in the previous paragraph, the netCDF files in output from the simulation models could not be read by Geoserver even after pre-processing. Consequently, the GeoServer “ImageMosaic” extension was used to publish the multitemporal GeoTiff datasets as time-enabled Web services.
An internet server hosts a set of Javascript web applications, using OpenLayers, jQuery and ExtJS/GeoExt libraries, that exploit the services to produce the web maps.
Figure 2. Organization of the PostgreSQL/PostGIS geodatabase.
3. THE WEB MAPS
3.1 Web maps planning
To grant easy access to- and readability of the EXPAH results, a careful planning of the web maps was required. Contents, arrangement, display scales, rendering symbology and strategies, layer names, labels, functionalities were all defined in a planning phase on desktop GIS platforms.
Layer names, labels and symbology were then transposed in GeoServer as features of the WMS services. Raster and vector layers were styled using the Style Layer Descriptor (SLD) The International Archives of the Photogrammetry, Remote Sensing and Spatial Information Sciences, Volume XL-2, 2014
XML-based markup language. To enable users to compare the data both spatially and temporally, a consistent symbology was applied across datasets and for each dataset across time. Consequently, a single color scale characterizes each pollutant, marking its concentration at ground sites and at simulation modeling cells, at every time step. The number of scale intervals and the corresponding concentration values were set so as to optimize the spatial mapping at most dates, using statistics of the whole datasets. To enhance little differences, double-hue scales (e.g. blue – white/white – red) were used. Since in these color ramps the threshold color (e.g. white) can be perceived as a warning level, its position in the scale was carefully selected, assigning it to concentrations corresponding to Italian regulatory values if available, or to threshold values taken from international literature.
OpenStreetMap (OSM) (Haklay and Weber, 2008) was used as the basemap. Directly using the OSM raster tiles, that are projected onto the Web Mercator CRS, involves all the published Web Map Services to be projected onto the same CRS when the web map is created. This is well accomplished by GeoServer, but returned bad results for the simulation modeling grids due their low (1km) resolution, causing mis-alignments with the vector layers, which geometric transformation was instead accurate. The problem could be overcome by resampling the raster files to a higher resolution: however this would led to a huge increase of the dimension of the multi-temporal datasets (366 grids of 60x60km2 for each pollutant) that are queried in almost real-time by the multi-temporal functionality of the web maps (described below). Therefore, we prepared a suitable version of the OSM map, downloading the OSM vector data for our geographic domain: these were stored in the Postgres DB and projected to the UTM32N/WGS84 CRS. The new version was SLD-styled and served as tiled WMS through GeoServer.
3.2 Web mapping applications
A set of Javascript web applications, mainly based on the Openlayers library, employs the Web Map Services exposed by GeoServer to create web maps that allow the user to navigate into the results of the project. Maps have been designed to be interactive, with functions like zoom, pan, layer selection, query, pop-ups, and time-aware, that is queryable by date. Maps are also conceived to be used and interpreted at two levels: the main approach is very simple and intuitive, to make maps accessible to non-specialists, like people living in the study area: no GIS knowledge, neither specific software or plug-ins are required to access the maps, a short user guide is available on each web map page; the availability of quantitative data, through labels, boxes and pop-up tables, is targeted to the scientific community and to the technical staff of government authorities responsible for pollution reduction policies.
Information shown in the web maps is a subset of the EXPAH dataset included in the GIS: even if maps also carry quantitative information, the main approach to their interpretation is visual, i.e. qualitative: showing datasets that are highly spatially correlated each other is of little use: this is the case, for example, of the one-year daily exposure values to the various pollutants: these datasets are closely correlated with the daily concentration values, and hardly distinguishable from them at a visual inspection.
Three types of maps have been designed to present results of the EXPAH project: opened in sequence, they lead the user through
the study carried out, providing a sight into the air pollution outline of the city of Rome, its relationships with emission sources, its dependence on seasons, allowing to explore the level of agreement between models and measures, the impact on people living and working in the city and its surroundings, its spatial pattern and levels at specific locations. Maps can be accessed from the EXPAH-GIS web page at http://www.ispesl.it/expah/expahwebgis.asp.
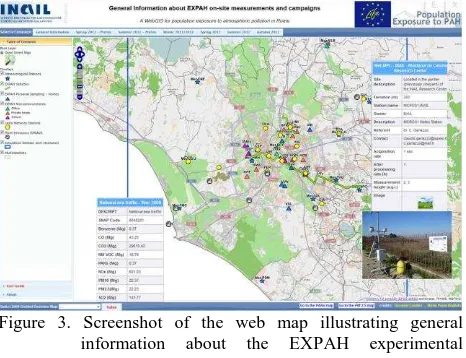
A General information map (Figure 3) conveys information about the experimental campaigns performed to collect meteorological and chemical measurements. The measurement sites can be queried by location to display site features, images, web-links. The map also outlines the emission context of the area through interactive display of emission maps for various pollutants and of the main point emission sources, both with quantitative data. The map can be browsed by experimental campaign: for each campaign, only sites acquiring data in that campaign are displayed. Details on measured pollutants and actual time span of measurements at the site are shown in pop-up tables.
Figure 3. Screenshot of the web map illustrating general information about the EXPAH experimental campaigns.
Two Pollution maps present the results of the air pollution characterization (Figure 4). They illustrate the spatial and temporal distribution of total PAHs, B[a]P and PM2.5 in the first layers of atmosphere over the city of Rome during one year (June 2011 – May 2012), through the concentration maps obtained by simulation modeling. Relationships between modeled concentrations and values measured at the ground sites can be explored both qualitatively (by color) and quantitatively, through labels and pop-ups for ground measurements and through a mouse-hover updating value box for simulations.
The relationship between indoor and outdoor concentration at different microenvironments is important to evaluate people exposure during their permanence indoor, e.g. at home, school, work, and during transfers (bus, car, metro etc.). The map communicates this information enabling symbolization of sampled microenvironments by outdoor values, indoor values, and by an indoor-outdoor bar-diagram that provides a prompt glance to the indoor/outdoor ratio and so to the infiltration coefficient. A set of temporal tabs provides the user with two ways of time selection: calendars for every experimental campaign, and a date box to enter a date, with two arrows to go forward or backward continuously. These tools allow temporal navigation of the map. For each date, the web application sends an AJAX request to GeoServer, that returns data for the The International Archives of the Photogrammetry, Remote Sensing and Spatial Information Sciences, Volume XL-2, 2014
correspondent time step/interval. Raster and Vector resources are retrieved together as WMSs and a new map is produced depicting the situation at the selected date.
Figure 4. Screenshot of the multi-temporal web map illustrating results of PM2.5 assessment and modeling.
The last map concerns Health risk, and is aimed to provide a sight into impacts that air pollution illustrated by the previous maps can have on people in Rome (Figure 5). Individual exposure levels to PAHs, B[a]P and PM2.5 for two target subjects (elders and children) and Total PAHs Toxicity Equivalent Concentrations (see paragraph 2.1) are shown in these maps as yearly averages and as averages of heating (November 1st –March 31st) and non-heating (April 1st – October 31st) periods. The grid map of interest is interactively selected and displayed on a set of ancillary information layers about the urban context: these latter help the user to draw considerations about the overall health risk and impacts on Rome citizens. While exposure and TTEC maps answer the
question“ how much?”, expressing a “potential” exposure at each cell, contextual geographic information helps answering
the question “where?”. The following examples explain this concept. Elderly people spend most time at home; children at home and at school. So, resident population density maps (total population, and young and elderly population) allow to locate areas in Rome where the potential impact of air pollution on the two targets is higher. Places where these areas overlap high individual exposure levels, are high impact areas, i.e. areas of Rome at higher risk, where more cases concerning acute or long term effects could be expected. Similarly, schools are places where potential impact on Roman children is high. If the schools overlap areas of high individual exposure levels, there the impact of air pollution on Roman children is higher, and higher is the overall risk.
Figure 5. Screenshot of the web map illustrating elders and children exposure to PAHs and PM2.5.
On the contrary, as long as risk for human health is considered, wild natural areas (forests, woods, pastures, sea, lakes) are very low potential impact areas, since people is not expected to spend time there. In these areas the individual exposure levels
remain “potential” and do not result in any risk for human
health. The map also includes urban parks, open air leisure and sport places: at these places actual exposure is outdoor exposure of people spending free time there, and non-heating period exposure can be more important than heating period exposure. , Traffic restriction zones have been also included in the map to allow users to qualitatively examine relationships of air pollution concentration and consequent exposure levels with present traffic policies.
A geolocation box was added to the map, to allow the user to know exposure levels at specific locations of interest.
4. CONCLUSIONS
Finding effective ways to communicate risk for human health, and environmental determinants for it, is a topical and challenging task (WHO, 2013). In this field, it is especially important that research results find a fast and simple path from the scientific community to stakeholders: these latter include both authorities in charge of environmental quality policies and regulations, and people exposed to risk agents.
Maps are a very efficient means to transfer information, providing an intuitive way to interpret complex, multi-thematic data; the possibility to interact with maps catches the attention and invites one to go deeper into information.
The web mapping system developed for the EXPAH project is a prototype of a possible model to disseminate scientific results in this field, providing a sight into impacts of air pollution on people living and working in a big city, and shipping information about the overall exposure, its spatial pattern and levels at specific locations.
The effort was focused on developing a very simple interface to access information in three dimensions (2D spatial and temporal), at two levels of complexity: maps convey scientific, quantitative content to scientists and regulation authorities and provide an intuitive communication medium for other stakeholders, mainly to the public. The upper reading level revealed its advantages during the development of the project, for data checking and evaluation tasks: each team could analyse the quantitative, temporal and geometric relationships of its own results with those of the others, and with the actual geographic context, highlighting features worthy of further analysis, or artefacts to be fixed. A feedback from stakeholders requires longer time: however, very soon during development of the map applications, important issues arose about how information disseminated is perceived by the user. Just choosing a different colour threshold in a pollutant concentration map, drastically changes the message delivered. Some of these aspects were faced and taken into account, e.g. choosing threshold levels coinciding with regulation policy levels when available. Going deeper into these aspects was beyond the goal of the project, but they are a possible, future further objective of
the next “GIS for health” study.
ACKNOWLEDGEMENTS
The LIFE+ EU financial program (EC 614/2007) is acknowledged for the provision of funding for EXPAH project (LIFE09 ENV/IT/082).
REFERENCES
E.E.A., 2007. Technical Report n. 17/2007 “CLC2006 technical guidelines” http://www.eea.europa.eu/publications/technical_ report_2007_17 (29 Apr. 2014).
European Union, 2007. Directive 2007/2/EC of the European Parliament and of the Council of 14 March 2007 establishing an Infrastructure for Spatial Information in the European Community (INSPIRE). Official Journal of the European Union, L 108/1.
Gariazzo C., Silibello C., Finardi S., Radice P., D’Allura A., Gherardi M., Cecinato A., 2013. PAHs modeling over urban area of Rome: integration of models results with experimental data. Proc. 33rd
International Technical Meeting (ITM) on air pollution modeling and its application, Miami, Florida, U.S.A.
Gariazzo C., Lamberti M., Silibello C., Finardi S., Radice P.,
D’Allura A., Gherardi M., Cecinato A., Porta D., Sacco F.,
Hanninen O., Pelliccioni A., 2014. An integrated BaP (PAHs) approach to estimate children and elderly exposure in the city of Rome, Italy. Proc. 9th
International Conference on air quality science and application, Garmish-Partenkirchen, Germany.
Gatto M.P., Gariazzo C., Gordiani A., L’episcopo N., Gherardi M., 2013. Children and elders exposure assessment to particle-bound polycyclic aromatic hydrocarbons (PAHs) in the city of Rome, Italy. Environ. Sci. Pollut. Res. DOI: 10.1007/s11356-013-2442-y
Gatto M.P., Gordiani A., Romagnoli P., Balducci C., Perilli M., Cecinato A., Gherardi M., 2013. Seasonal behaviour of indoor and outdoor PAHs in different microenvironments of Rome, Italy. Proc. 2013 European Aerosol Conference (EAC 2013), Prague, Czech Republic.
GeoServer, 2014. The Geoserver project – the open internet gateway for geographic data http://geoserver.org/display/GEOS /Welcome (29 apr. 2014).
Gherardi M., Gatto M.P., Gariazzo C., Gordiani A., 2013. Urban air pollution in Rome: children and elders exposure to PAHs in fine particulate matter (PM2.5). Toxicology Letters, 221(S), p. S251.
Haklay M., Weber P., 2008. OpenStreetMap: user-generated street maps. Pervasive Computing, IEEE, 7 (4).
ISTAT, 2013. 15o Censimento popolazione e abitazioni 2011. http://www.istat.it/it/censimento-popolazione/popolazione-2011 (29 Apr. 2014).
O.S.G. Foundation, 2013. GDAL, Geospatial Data Abstraction Library. http://www.gdal.org/ (29 Apr. 2014).
QGIS Development Team, 2013. QGIS Geographic Information System. Open Source Geospatial Foundation Project. http://qgis.osgeo.org (29 Apr. 2014).
Radice P., Smith P., Costa M.P., D’Allura A., Pozzi C.M., Nanni A., Finardi S., 2012. EXPAH Technical Report.
“EXPAH-Actions 4.3-4.4: Calculation and integration of traffic emissions with the updated Lazio region inventory. Spatial, temporal and chemical disaggregation of the emission inventory”. http://www.ispesl.it/expah/documenti/R2012-05_ ARIANET_EXPAH_A4.3-4_final.pdf (29 Apr. 2014).
Rew R., Davis G., 1990. NetCDF: An interface for scientific data access. IEEE Computer Graphics and Applications, 10(4), pp. 72-82.
Silibello C., Bolignano A., Sozzi R., Gariazzo C, 2014. Application of a chemical transport model and optimized data assimilation methods to improve air quality assessment. Air Quality, Atmosphere & Health DOI: 10.1007/s11869-014-0235-1
UNIDATA, 2001. The netCDF users’ guide – Limitations. http://www.unidata.ucar.edu/software/netcdf/docs/netcdf/Limita tions.html#Limitations (29 Apr. 2014).
W.H.O. Regional Office for Europe, 2013. Health and environment: communicating the risks. F. Theakston Ed. http://www.euro.who.int/__data/assets/pdf_file/0011/233759/e9 6930.pdf?ua=1 (29 Apr. 2014).
Wild C.P., 2012. The exposome: from concept to utility. International Journal of Epidemiology, 41(1), pp 24–32. The International Archives of the Photogrammetry, Remote Sensing and Spatial Information Sciences, Volume XL-2, 2014