SINGLE SPACE BORN IMAGE BASED ANAGLYPH GENERATION
M. Malini Deepikaa, ,N.R.Raajanb, A.Kamalaselvanc
aSchool of Electrical and Electronics Engineering, SASTRA University, Tamilnadu,India, [email protected] b
School of Electrical and Electronics Engineering, SASTRA University, Tamilnadu,India, [email protected] c
School of Electrical and Electronics Engineering, SASTRA University, Tamilnadu,India, [email protected]
KEY WORDS:Cartosat-I, Anaglyph, Stereo pair, Panchromatic image (PAN), Multispectral (MS).
ABSTRACT:
In remote sensing applications depth and width of the features in the captured image are necessitate for reclamation estimate and to gather morphological information. This work, aims at demonstrating the potential of stereo pair based anaglyph picture generation by eliminating two cameras carried by Cartosat-I stereo Earth observing satellite. The study is conducted in Trichy Srirangam a part of Tamilnadu. The presented approach involves generating the stereo pair from single cartosat image (Panchromating (PAN), Multispectral (MS)). The depth information is estimated by angular deviation from the stereo pair. The generated anaglyph depth map information can be used in categorizing ravines and depth.
1. INTRODUCTION
The information gathered by earth observers are not sufficient for geo-engineers to gather information and analyse the terrestrial land like ravination measurement and depth information. The image based morphometric measurement and feature depth es-timation requires domain expert knowledge and database of in-formation about the region of study. Accordingly reclamation measures can be taken by planting the plants, avoiding the ero-sion in the valley region. Drastic spifflication of gullies cause biological in balance of carbon dioxide. The third dimensional resolution in the Earth observed images helps in ravine analysis by the categorizing and compare the ravine data depth and width change to the previous database (Bets,1999). The belittled and average gullies are reclaimed for cultivation and the abstruse and narrow gullies are encouraged to permanent vegetation of grasses (Pande V.C,2012) (Bali, J. S, 1969). These degraded lands can afford to economic production of the country and called for with conservation of natural resource (Sreenivas Kandrika, 2013).
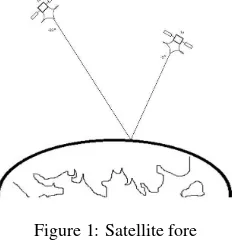
Indian Space Research Organization (ISRO) launched a missile to target of observing Stereoview of Earth’s surface in 2005 May. The Cartosat-I carry two panchromatic cameras fore looking cam-era and Aft looking camcam-eras with a tilted angle of +26 deg and -5 deg the stereo pair acquisition in two modes forward and reverse initially it is set in forward operation as shown in fig. (1). From October 2010 onwards it is set in reverse mode with an angle of +5 degree and -26 degree and with resolution of 2.5m (Giribabu D,2013).
Figure 1: Satellite fore
The acquisition time differences between the two PAN cameras
is 52 seconds, which may lead to difference in pixel and object position in the stereo pair and result in occlusion in the generated anaglyph image. In case of remote sensing it is a tough job to place two cameras in the orbit at the exact angle i.e for the gen-eration of Anaglyph images the two cameras used and should be aligned at the appropriate angle. The space is a region where the light distribution is not even throughout the both camera coverage area the intensity variation and the improper alignment also leads to ghosting in the generated depth map. It is also a cost consum-ing process for develop a depth camera for capturconsum-ing space born images.
The proposed method implies mathematical modeling based stere-oscope from a pair of images three spatial coordinates (3D-Position) of corresponding points measure the 3D point clouds into distinct objects. Stereo based Anaglyph image is considered for the pur-pose because of easy implementation and less hardware (Raajan, 2012). The proposed work uses only a single image from any res-olution camera and it generates the stereo pair and reconstructs the anaglyph image based on the algorithm discussed.
1.1 Literature Survey on Computer Aided Stereography The stereo pair can be generated in two methods, dual camera based and single camera based. The dual camera process is same as the procedure followed in Cartosat-I stereo Earth observer. Two cameras the Fore and Aft looking cameras are fixed at the considerable distance. Image matching is done between the stereo pair corresponding matching points are collected from the images from the matching points the anaglyph with depth perception is constructed.
The anaglyph image can be generated by a single view by con-sidering the consecutive frame image as a stereo pair, it causes jitters and requires stabilization of frame which is the additional overhead and tends to lose consistency. To alleviate these effects stabilization is done to the selected sequence of frames. In both the cases, acquiring the depth map and recovering the disparity acts the major role (Matsuura F, 2008).
Feature Extraction, Image rectification methods including image translation, hompgraphy. The correspondence between the pair is calculated from the spatial property of the pixel around the each central pixel described by Modulation Transfer Function (MTF) Lens. Based on the sharpness obtained from different angles of MFT a graph is drawn as sagittal and meridional (or) radial, axial and tangential. This different parameters are found based on the variation in the sharpness either running axially from the center or circle around the image. The pair of images with close line is chosen for further processing. The images with lines far apart are smeared, the objective of the correspondence matching is to collect the disparity values with maximum similarity between the reference and the target image of the stereo pair (Hae-Yeoun Lee, 2003). If the reference is left image and target is right image it is termed as direct matching, the inverse matching is considered as reverse matching.
The features in the stereo pair can be detected by applying corner detectors like Harrs, because it is proven to be invariant to objects in rotation, scale, noise and illumination. This methods works on the basis of local auto correlation function, the auto correlation function measures the local variation in signal with the patches of pixel shift in the direction of both the compared frames.
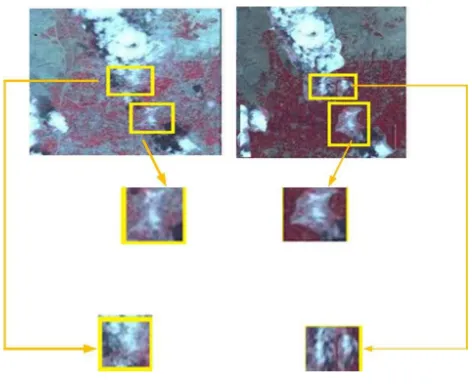
Figure 2: Synthetic image
In the figure (2) two synthetic stereo pair is shown in which right image is brighter than the left image due to improper angular deviation and the delay in capturing time cause changes in the position of the clouds in the images are rectangle and circled. From this it can be stated that the acquisition time delay between the cameras in Cartosat-I can lead some space born objects like clouds can enter in the field of coverage of any of the cameras. It is also found Geographical distortion in the Himalayan terrain from the distortion due to improper alignment of camera angle (Giribabu D, 2013). The poor angular deviation leads to camera parameter calibration to avoid translation and rotation between the stereo pair.
The above discussed factors lead to reconstruction of anaglyph image with minimal matching points which degrade the visual quality of the reconstructed image. This will cause delay in the reconstructed anaglyph video.
This work figures out a mathematical model uses the human vi-sual model. To generate anaglyph video sequence the proposed work visualizes the intended scene as a stereo pair with small gular difference between them as the human eyes calculate the an-gular difference as depth information (MaliniDeepika M, 2014).
2. TEST REGION
The test area is bounded between the region10o
46′6.25”N to
12o
17′22.20”Npart of Trichy district, Tamilnadu state,
South-ern part of India. , the region mainly comprises of charnock-ites, gneisses and granites of Early Proterozoic age. Petrologicaly nearly 93678 hect of soil are affected with Alkalinity and Salin-ity. Major part of the total region of about 29 percent, approxi-mately 1,31,785 hectare area is prone to soil erosion (Annammal, 1989). Along the river Cauvery and Ayacuts are distributed with black soil this occupy 14 percent of the total land coverage area (Palanisamy Priyadharsini,2013). The topology of the region is almost flat and the elevation is about 88 meters (289 ft) and the slope of the area is 1 to 2 degree (very gentle). Trichy is located on Deccan plateau the day time shows the extremely warm and dry weather. The wind from southeast makes the evening colder. Rarely fog occurs during the winter season. The average rain fall rate 945 mm. The rain fall is got from North-east monsoon the heavy rain fall is during the month of October and December. The months from June to September express a pleasant climate tem-pered with heavy rain and thunder. During December to February the weather is cool and moist.
3. TEST DATASET
4. FEASIBILITY STUDY ON CARTOSAT DATA The remote sensing camera uses different films capable of record-ing objects electromagnetic energy which is reflected from the source object. Some kinds of such films include panchromatic film (black and white), color film, color infrared film, etc.
It has single band information displaying a grayscale image and observes the information in visible spectrum. Panchromatic im-ages are sensitive to all wavelengths of light and observed from wide wavelength. The aim of the study is collecting the visual pattern and elevation model of the region so color information is not necessary. Since it has high spectral resolution it can possess the defined object boundary. This property helps in filtering out the atmospheric haze like cloud covers.
In contradiction to pan image the multrispectal image can posses high spatial property, but less spectral property, it can give the color property of the objects in the image but it can clearly de-fine the object contour. The multispectral image composed of eight bands includes four traditional spectral bands blue, green, red and near infrared bands for providing color information in the observed region. The four additional bands are observed includes shorter wavelength blue band, approximately 605 nm and a red band approximately 725 nm for reflection of vegetation region in the resulting image, the atmospheric water vapor region can be observed by approximately 950 nm.
5. METHODOLOGY Step 1 The image is acquired from the source.
Figure 3: Schematic Model of proposed Method
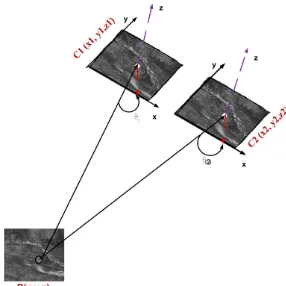
Figure 4: stereo pair coordinate formation
Step 3 The angular deviation between the stereo pair can be ob-tained by,
Z= bf
xw−xw′
(3)
step 4 The color component of the stereo pair C1 and C2 are changed as red and cyan as shown in fig()
step 5 The color component converted cloned frame are super-imposed to form the projection on the single frame. The triangulation is obtained by Euclidean geometry.
x1=
x1+
b 2
f z1
(4)
x2=
x2+
b 2
f
z2
(5)
Step 6 The decoding is shown in the fig. The anaglyph image is decoded by two differentially color filter each image for one eye. The brain combines this deviated image and perceives the depth information.
Figure 5: Decoding of proposed Method
Note: The algorithm is discussed for a single image if a video stream is considered the video sequence is divided in to se-quence of frame and the algorithm is applied to each frame and the processed frame are reconstructed as Anglyph video or with depth map based on the requirement. The same pro-cess can also applied to the each incoming frame and the result can be obtained in close real time.
6. RESULT AND DISCUSSION The result is shown for the Geo coordinates, lat10o
49′27.42”N
and long78o
41′30.67”E to 10o
53′18.34”N. The region
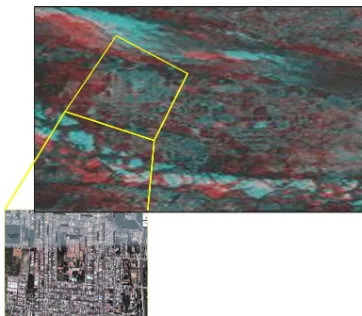
be-tween Thennur to Mannachanallur. Eighteen kilometers west of Tiruchirapalli town, the river Cuavery rip into two branches, of which northern division called Coleroon while the southern divi-sion remains the name Cauvery. It falls within the Tiruchirpalli Taluk and the separated part shows the Srirangam Island houses the temple with a tallest gopuram in the country of 243 ft the two spllited rivers has seen both sides of the island in fig.(3).
The fig.(6) shows the anaglyph applied by the proposed method to the multispectral image
of covered geographical area lat10o
51′6.25′′Nto12o
13′18.48”
in the image it is seen that the original color is preserved and it objects in the image are distinguishable.
In fig (8) there is blue and yellow cross is marked for features in left and right and connected by blue line it shows that there is each feature in one image is match to a unique feature in the other image it shows the ordering in the generated anaglyph image.
Figure 6: Anaglyph image of Proposed method over part of the study area representing river Cavury (cyan-red ) anaglyph image.
Figure 7: Anaglyph of multispectral image
Figure 8: Stereo Correspondence
Figure 9: Tie Points
appear in the same row this proves the epipolar geometry between the stereo pair, since it can also conclude that there is no occlusion in the stereo pair.
The fig (10) shows Thammampatti hills situated between Pachamalai and the Kolli Hills.
Figure 10: mountain elevation
The fig (12) shows the apparent pixel difference between the stereo pair from. The difference the value produces disparity es-timation of the objects in the image and depth of the objects can be retrived from the disparity map.
Figure 11: Disparity of river
Figure 12: Disparity of mountain elevation
avoids the need of image rectification process for the alignment of the two frames.
The obtained plot shows the actual distance of different objects present in the image.
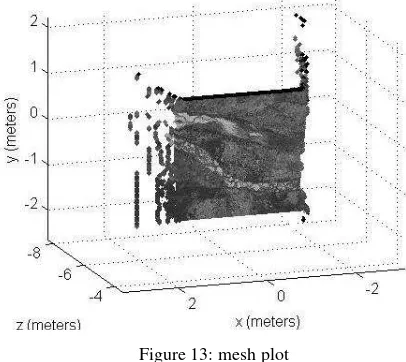
Figure 13: mesh plot
The fig. (13) shows the mesh grid plot from the stereo pair gen-erated from a single source image. The obtained plot shows the actual distance of different objects present in the image from the distance ravination can be differentiated as small, medium, deep.
Table 1: Chi-Square test on Contrast in unprocessed PAN Image
Distortion GN Motion SN
Chi Value 0.295 0.4193 0.3987
p 0.001 0.009 0.007
Table 2: Chi-Square test on Contrast in Anaglyph PAN Image
Distortion GN Motion SN
Chi Value 0.2677 0.422 0.3498
p 0.008 0.004 0.003
The binocular suppression plays a vital role in the perception of stereoscopically viewed 3D distortions Table.1 to Table 4 shows the result of chi-square analysis of PAN and MS images of each distortion type. Whereas binocular suppression appears to have played a significant role in affecting Motion blur in both the cases (unprocessed and Anaglyph). The influence of distortion in the multispectral stereo pass on to the anaglyph image (p=0.011) compared to the PAN anaglyph image. By comparing the results the proposed algorithm can significant in the Anaglyph genera-tion of space born images since the methods are not affected by Gaussian and Salt noise. The Motion blur does not have much influence on space born data since they are dynamic noise caused by motion in capturing device or object, but the space born im-ages are static imim-ages captured at a particular time instant.
7. CONCLUSION
This work evidence about anaglyph picture generation by space born image in real time. Over the years space crafts carried two cameras for the purpose and face problems like placing them in correct angle in the orbit. The algorithms used for anaglyph gen-eration uses two cameras which is also suffering from camera alignment, the depth cue bases method are prone to local defor-mations due to fairish density in the depth map. the proposed method uses human vision based approach (single view) in the
Table 3: Chi-Square test on Contrast in source Mutispectral Im-age
Distortion GN Motion SN
Chi Value 0.3294 0.4219 0.3948
p 0.002 0.008 0.002
Table 4: Chi-Square test on Contrast in Anaglyph MS Image
Distortion GN Motion SN
Chi Value 0.2850 0.4439 0.3690
p 0.000 0.011 0.009
generation of stereo pair. this method is also pay a way for gen-eration of anaglyph picture even after lefting the IRS-P5.
Annammal 1989 Environmental Management in Tiruchirapalli Municipal Area seminar on the state of Tiruchy Environment, Bharathidasan University, Trichirapalli - 23., pp. 25 -51.
Bali, J. S., Kamphrost, A., Miejerink, A. M. J., Hilwig, F. W. 1969. Methods and the legend for the use of aerial photographs in the survey, stabilization and reclamation of ravines, Central Ravine Reclamation Board, Ministry of Agriculture and Co-operation, New Delhi.
Bets, H. D.,Ronald, C. D. 1999. Digital elevation models as a tool for monitoring and measuring gully erosion, J.A.G, 1 (2), pp.91101.
Giribabu D., Pramod Kumar, John Mathew, K.P. Sharma and Y.V.N. Krishna Murthy,2013. DEM generation using Cartosat-1 stereo data issues and complexities in Himalayan terrain in European Journal of Remote Sensing ,46,pp. 431-443.
Hae-Yeoun Lee, Taejung Kim, Wonkyu Park, Heung Kyu Lee ,2003. Extraction of digital elevation models from satellite stereo images through stereo matching based on epipolarity and scene geometry in Image and Vision Computing, 21,pp. 789-796.
Matsuura F, and Fujisawa N., 2008. Anaglyph Stereo Visualiza-tion by the Use of a Single Image and Depth InformaVisualiza-tion, The-Visualization Society of Japan Journal of The-Visualization, Vol. 11, No. 1 2008,pp.79-86.
MaliniDeepika M., Raajan N.R., 2014. Real Time 2D to 3D Image Conversion Using Special Filters, International Journal of Imaging and Robotics, vol.14.3, pp.112-120.
Raajan N.R., Ramkumar M., Monisha B., Jaiseeli C., 2012, Dis-parity Estimation from Stereo Images, International conference on Modelling Optimization and Computing, Volume 38, pp. 462-472.
Palanisamy Priyadharsini, Dharmadurai Dhanasekaran , 2013. Di-versity of soil Allelopathic Actinobacteria in Tiruchirappalli dis-trict, Tamilnadu, India in Journal of the Saudi Society of Agri-cultural Sciences , Article in Press.
Pande V.C.,. Kurothe R.S., Rao, Gopal Kumar B.K., Parandiyal A.K., Singh and Ashok Kumar A.K. ,2012. Economic Analysis of Bamboo Plantation in Three Major Ravine Systems of India in Agricultural Economics Research Review , 25 (1),pp. 49-59.