GEOMETRIC ACCURACY ANALYSIS OF WORLDDEM IN RELATION TO AW3D30,
SRTM AND ASTER GDEM2
S. Bayburta, A.B. Kurtaka, G. Büyüksalih a, K. Jacobsen b a
BIMTAS, Istanbul, Turkey – [email protected] , [email protected], [email protected] b Institute of Photogrammetry and GeoInformation, Leibniz University Hannover, Germany – [email protected]
HRIGI – High-Resolution Earth Imaging for Geospatial Information, ISPRS WG I/4
KEY WORDS: height model, WorldDEM, SRTM, ASTER GDEM2, aerial LiDAR
ABSTRACT:
In a project area close to Istanbul the quality of WorldDEM, AW3D30, SRTM DSM and ASTER GDEM2 have been analyzed in relation to a reference aerial LiDAR DEM and to each other. The random and the systematic height errors have been separated. The absolute offset for all height models in X, Y and Z is within the expectation. The shifts have been respected in advance for a satisfying estimation of the random error component. All height models are influenced by some tilts, different in size. In addition systematic deformations can be seen not influencing the standard deviation too much. The delivery of WorldDEM includes information about the height error map which is based on the interferometric phase errors, and the number and location of coverage’s from different orbits. A dependency of the height accuracy from the height error map information and the number of coverage’s can be seen, but it is smaller as expected. WorldDEM is more accurate as the other investigated height models and with 10m point spacing it includes more morphologic details, visible at contour lines. The morphologic details are close to the details based on the LiDAR digital surface model (DSM). As usual a dependency of the accuracy from the terrain slope can be seen. In forest areas the canopy definition of InSAR X- and C-band height models as well as for the height models based on optical satellite images is not the same as the height definition by LiDAR. In addition the interferometric phase uncertainty over forest areas is larger. Both effects lead to lower height accuracy in forest areas, also visible in the height error map.
1. INTRODUCTION
The quality of the commercial “WorldDEM core” height model, based on TanDEM-X data, which is nearly the same as the “Global TanDEM-X height model”, has been analyzed in relation to aerial LiDAR and to the free of charge available digital surface models SRTM, AW3D30 and ASTER GDEM 2. WorldDEM is specified with an absolute height accuracy of LE90 < 4m (LE90 = linear error with 90% probability). In case of normal distributed height discrepancies the standard deviation of the height (SZ) is identical to LE90 / 1.6449, corresponding to SZ=2.4m. The relative vertical accuracy within a cell of 1° x 1° is specified for terrain with slope up to 20% with LE90 = 2m, corresponding to SZ=1.22m and for slope exceeding 20% with LE90=4m corresponding to SZ=2.44m. The absolute horizontal accuracy is specified with a circular error of 90% probability (CE90) of 6m, corresponding to a standard deviation for X or Y (SX, SY) of 2.8m. Recent publications are mentioning a higher accuracy. Wecklich et al. 2015 determined the absolute accuracy of validation points with 1.07m LE90, corresponding to SZ=0.65m due to improved calibration of TanDEM-X. Of course validation points do not fully present the DSM accuracy, but the vast majority of over 3000 geo-cells are reported to have an absolute height accuracy of less than 2 m LE90, 247 geo-cells are between 2 and 5 m corresponding to SZ=0.53m, excluding highly vegetated and snow-/ice-covered regions. The footprint of ICESat with a diameter of 66m is not leading to the DSM accuracy, but it shows that the absolute accuracy is nearly the same as the relative accuracy. With such a footprint the morphologic details cannot be presented and also the slope depending accuracy is
not respected due to the limitation of ICESat heights to nearly flat terrain.
A verification of the WorldDEM core accuracy for mountainous areas, with larger forest coverage in Turkey has been made. In addition the dependency upon the number of coverage’s and the height error map as well as systematic errors are important for the quality of the height model. WorldDEM core has a point spacing of 10m, this is better as for AW3D30, SRTM and ASTER GDEM having 1 arcsec point spacing corresponding to approximately 28m. Of course this cannot lead to the same morphologic quality as with 10m point spacing. Some investigations of these free available height models have been made before (Jacobsen 2016a and 2016b).
ALOS World 3D (AW3D30) is based on all available height models from ALOS PRISM, having 2.5m GSD and taken from 2006 up to 2011, while the radar interferometric synthetic aperture radar (InSAR) of SRTM was active only during 11 days in February 2000. In the project area AW3D30 in the average is based on 2.7 stacks (image combinations) with up to 10 stacks and 0.4% gaps. ASTER GDEM2 is based on ASTER stereo pairs with 15m GSD, taken from 1999 up to now. WorldDEM is based on TanDEM-X InSAR taken since 2010 (http://www.intelligence-airbusds.com/worlddem/). With 10m point spacing it has a clearly higher resolution as the free of charge available height models.
All analyzed height models are related to EGM96 or EGM2008 geoid, not requiring a geoid height correction.
2. USED DATA SETS
As shown in figures 1, 3 and 4 the center part of the project area is mountainous, covered by forest. Only the southern and north east part is a non-forest area and the south east part is urban with small buildings. As reference a LiDAR Digital Surface Model (DSM) is available, taken by Riegl Q680i laser scanner from approximately 600m flying elevation in 2016. Of course The International Archives of the Photogrammetry, Remote Sensing and Spatial Information Sciences, Volume XLII-1/W1, 2017
the definition of the canopy height in InSAR is not the same as for LiDAR, so the expectation of the DSM discrepancies between the LiDAR reference DSM and WorldDEM core DSM in forest areas is not the same as in non-forest areas. Even LiDAR strips taken from neighbored flight lines show larger differences in vegetated areas (Büyüksalih, Jacobsen 2014). Larger discrepancies for forest areas also have to be expected for the height models AW3D30, SRTM and ASTER GDEM. This requires a masking of the forest areas for separate investigation.
Fig. 1: Google Earth image of the project area
Fig. 2: Frequency distribution of terrain slope
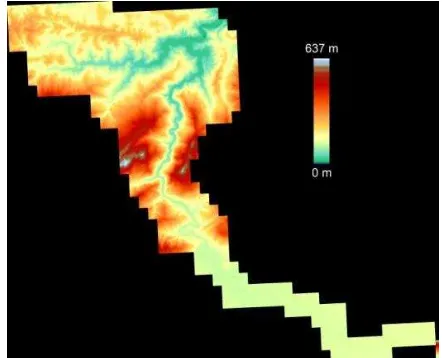
Fig. 3: Color coded reference LiDAR DSM, range: 23.7 km x
21.4 km
Figures 1 up to 4 demonstrate the rough terrain, requiring the analysis of the accuracy as function of terrain slope.
Due to mountainous parts this area belongs to the difficult InSAR areas, so in the average WorldDEM has been imaged 7.6 times from ascending and descending orbits (Fig. 5). In the difficult project area 0.7% voids exist, but they are not concentrated to some special areas, so they can be bridged by interpolation.
Fig. 4: Aspects of the project area
Fig. 5: Color coded multiple coverage of WorldDEM core DSM
by TanDEM-X – up to 10 times; range: 33.5 km x 31 km
The WorldDEM delivery includes the information of the height error map (Fig. 6). This is an estimation of the absolute accuracy, including the random and systematic errors. It has to be respected, that the terrain is mountainous with steep terrain with high percentage covered by forest, where any height model is not as accurate as for flat terrain being obvious in the height error map.
Fig. 6: Height error map (HEM-file) [LE90]
LE90 5.0 6.0 7.0 8.0 9.0 10.0 % 4.2% 36.1% 31.3% 13.4% 8.3% 6.6%
SZ 3.0 3.65 4.26 4.86 5.47 6.08
Tab. 1: Frequency distribution of HEM-file as LE90 and SZ [m]
Fig. 7: Average accuracy of SRTM DSM, AW3D30 and
ASTER GDEM2 in 5 test areas, using the whole areas, for areas with slope up to 10% and for slope exceeding 10%
SRTM, AW3D30 and ASTER GDEM2 have been analyzed in 5 worldwide distributed test areas. In all test areas the same trend exists – AW3D30 has a higher accuracy as SRTM and SRTM again is more accurate as ASTER GDEM2. As usual the height model accuracy depends upon the terrain inclination. If the height model accuracy shall be compared for different test sites, this has to be done in the not so inclined area as shown in figure 7 especially in the area with inclination below 10%. The percent and size of higher terrain inclination is different from area to area and does not allow any comparison between different areas. In figure 7 the accuracy is shown as standard deviation for the height (SZ) and as Normalized Median Absolute Deviation (NMAD) (Höhle and Höhle 2009). In case of normal distributed discrepancies both are identical, but in reality a higher percentage of larger discrepancies exist, influencing SZ more as NMAD (Fig. 17 and 18). The normal distribution based on NMAD fits better to the frequency distribution of the height differences as the normal distribution based on SZ.
3. ANALYSIS OF HEIGHT MODELS
As preparation for the height model analysis the horizontal relation to the reference LiDAR DSM has been determined by the Hannover program DEMSHIFT. It computes and respects the horizontal shifts based on the height differences together with the terrain slope and aspect. model tilts. Due to the high number of points the inner accuracy of the shifts is in the range of 0.10m. Nevertheless the large forest areas have an influence especially to the height shifts. A
shift of the WorldDEM height model based on the non-forest area only changed the shift by 1m up to 2m, but due to the correlation of horizontal to vertical shifts, the analyzed height model gave nearly identical accuracy values. The determined horizontal shifts are influenced by the uncertainty of the local geodetic datum used for the LiDAR reference height model and do not present the absolute shift of the used height models. The improvement of SZ in table 2 is related to the whole project area; the accuracy in the non-forest area by simple theory should be higher. In reality the terrain inclination in the non-forest area is smaller, so for WorldDEM the improvement by shift in the non-forest area is just 1%, but for ASTER GDEM 2 it is 38%. For a better separation of the random from systematic effects, all height models have been improved by the determined shifts, even if this was not really required for WorldDEM.
All height models are tilted against the reference height model. Even if this has a remarkable size for ASTER GDEM2, it influences the accuracy numbers (table 3) only by nearly negligible size. Nevertheless such systematic effects should not be accepted.
The standard deviation of the WorldDEM heights in relation to the LiDAR reference DSM is shown as function of the values of the height error map (HEM) and as function of the multiple coverage in figure 8 (see also figures 5 and 6). The weighted linear regression between SZ and the height error map is: SZ = 2.02m+0.14mHEM for the whole area and for the non-forest area SZ = 0.32m+0.24mHEM. The linear regression of SZ in relation to the multiple coverage is computed with: SZ=6.0m – 0.40 number of coverage for the whole area and SZ=6.6m –
standard deviation of height for whole and non-forest area
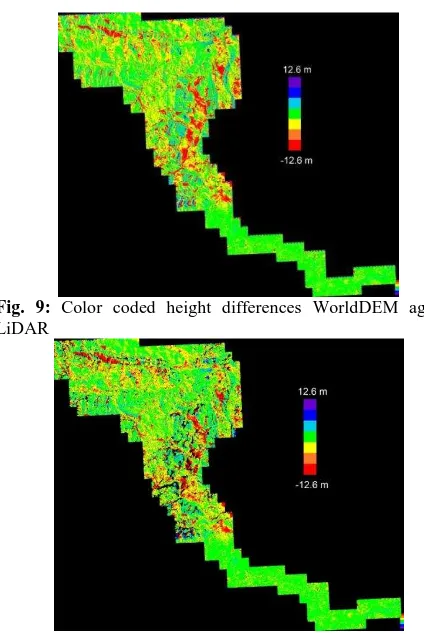
The influence of the mountainous area, covered by forest, to the accuracy is obvious in figures 9 and 10. In general LiDAR describes the height of the canopy not in the same manner as InSAR – usually the canopy height of LiDAR is below the canopy height determined by InSAR, even if the canopy height of C- and also X-band radar is a little below the top of the trees. By filtering of the DSM to a DTM with Hannover program RASCOR (Passini et al. 2002) especially points located at the forest boundaries are excluded (black areas in figure 11), but in areas without points located on the bare ground a filtering to a DSM is not possible without additional information about tree height. The filtering improves the accuracy numbers for The International Archives of the Photogrammetry, Remote Sensing and Spatial Information Sciences, Volume XLII-1/W1, 2017
WorldDEM including forest areas against LiDAR reference by 15% up to 30% (Table 3). For non-forest areas the advantage of filtering is not important.
Fig. 9: Color coded height differences WorldDEM against
LiDAR
Fig. 10: Color coded height differences of filtered WorldDEM
against LiDAR, black in project area = deleted by filtering
Fig. 11: Filtered WorldDEM – black = no data
The height discrepancies have been analyzed for systematic errors by averaging height discrepancies in 30 groups as function of the X- and Y-ground coordinates (figures 15 – 16) and as raster with 30 groups in X-direction and also Y-direction (figure 13). For an improvement of the height models by the systematic errors it is necessary to filter the systematic errors due to possible influence by changed vegetation (red lines in figures 14 – 16).
Fig. 12: Color coded height differences AW3D30 against
LiDAR
Fig. 13: Color coded systematic errors of WorldDEM against
LiDAR reference
Usually the largest improvement of the correction by systematic errors of the height models will be reached by leveling. The leveling of the height models improves the accuracy only by approximately 1% up to 2% (Tab. 3). A further improvement by the not linear systematic errors is also limited to 1% up to 2%.
Fig. 14: Systematic height errors of WorldDEM as function of
X and Y shown as mean for each distance group in blue, smoothened function in red and as linear function in green for the whole area
Fig. 15: Systematic height errors of WorldDEM as function of
X and Y shown as mean for each distance group in blue, smoothened function in red and as linear function in green, only for non-forest area
Fig. 16: Systematic errors of WorldDEM against AW3D30 as
function of X (left) and Y (right) for whole (above) and non-forest area (below)
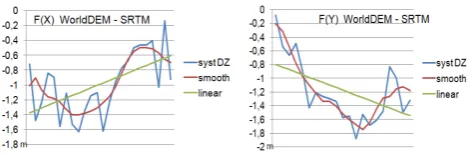
Fig. 17: Systematic errors of WorldDEM against SRTM as
function of X (left) and Y (right) for whole area
The systematic errors as function of the correction raster (Fig. 13) shows directly the influence of the forest (in blue and black). That means, in forest areas the LIDAR heights are below WorldDEM heights. This requires a separation of the accuracy analysis for forest and non-forest areas. In table 3 accuracy numbers are shown for the whole area and for the non-forest area. 76.7% of the project area is covered by forest.
The systematic errors of WorldDEM against the LiDAR reference for the whole area (Fig. 14) and only the non-forest area (Fig. 15) have only a limited similarity, raising doubts about the meaning of higher frequency discrepancies. Only the linear trend (green lines in Fig. 14 and 15) is nearly the same. The linear trend with 1.2m over the whole range for the X- and the Y-direction for the whole project area is slightly smaller as for non-forest areas with approximately 1.5m. Of course a tilt is also possible for the LiDAR height model, but such a size is very unlikely. The investigation of LiDAR flights showed only tilts of LiDAR strips up to 20cm over the whole length of the LiDAR strips (Büyüksalih, Jacobsen 2014). Nevertheless, the tilt of the height models against each other may be caused also by an influence of buildings in the southern part and remaining influence of not masked forest in the northern part.
The comparison of WorldDEM with AW3D30 (Fig. 16) shows an opposite tilt, but it has to be respected that in figures 14 and 15 LiDAR is used as reference, while in figure 16 WorldDEM is the reference, changing the sign of the tilt. That means that
The frequency distributions of the WorldDEM height differences against LiDAR for the whole area (Fig. 18) and only for the non-forest area (Fig. 19) have a similar character. Of course SZ and NMAD are larger for the whole area as for the non-forest area (Tab. 3), causing a larger width, but as usual the normal distribution based on NMAD fits better to the frequency distribution as the normal distribution based on SZ. The positive skewness (center of frequency distribution larger as the normal
distribution) indicates a remaining effect of forest or buildings - this is also indicated by skewness. The same tendency exists for the comparison of WorldDEM with AW3D30, SRTM and ASTER GDEM.
Fig. 18: Frequency distribution of WorldDEM against LiDAR
reference – whole project area
Fig. 19: Frequency distribution of WorldDEM against LiDAR –
limited to non-forest area
The specification of WorldDEM separates the terrain for slopes below and exceeding 20% inclination. In the investigated The International Archives of the Photogrammetry, Remote Sensing and Spatial Information Sciences, Volume XLII-1/W1, 2017
project area the accuracy difference for areas with slope up to 10% against slope up to 20% for the whole project area is between 8% for WorldDEM up to 20% for SRTM and for the non-forest area 4% for WorldDEM and 10% for SRTM. 20% inclination usually is only reached in mountainous areas, so the specification with 20% slope depends upon the area and cannot be extrapolated to other areas. The slope limit of 10% is less dependent upon the terrain roughness why it is used here. Table 3 in any case shows smaller values for NMAD as for SZ. Also in any case the accuracy for terrain with slope <10% is smaller as for the whole area. This is common for all areas and all sensors, also for sensors which have not been used here. The accuracy of WorldDEM against LiDAR reference is smaller as in relation to the other used DSM. The most important value of the analysis is NMAD for WorldDEM against LiDAR for the non-forest area with slope <10% with 1.03m. This presents the WorldDEM accuracy for this rough terrain – it is a satisfying result.
SRTM DSM with a point spacing of 1 arcsec and 3 arcsec have been analyzed. The accuracy numbers are nearly the same, so only the results based on 1 arcsec are shown. The major difference between both height models is the morphologic detail which cannot be as good with a larger point spacing.
The accuracy numbers (table 3) are estimations. They are depending upon the frame conditions, as specification of the mask for forest areas which cannot be 100% sharp. They are also influenced by the small buildings in south-east part of the test area which have not been masked out. In addition a threshold for accepting height discrepancies as not being blunders (large, not accepted discrepancies). This starts with blunders in the LiDAR reference. A threshold of 25m for ASTER GDEM2 and 15m for the other data sets has been used. The threshold depends upon the frequency distribution of the discrepancies (fig. 18 and 19) and has to include also a satisfying range outside the range of the nearly normal distribution of the differences, where a higher number of discrepancies are located. Between 1% and 2% of the height values exceed the used thresholds.
As expected and as usual, AW3D30 is more accurate as SRTM and this again is more accurate as ASTER GDEM2. The leveling in most cases improves the accuracy, but the effect to the accuracy numbers is limited. The filtering improves especially the whole area, which means the forest, but a closed forest area cannot be changed by filtering from a DSM to a DTM.
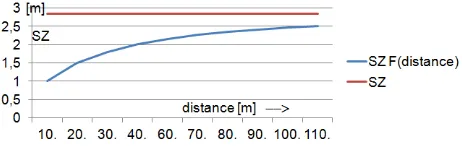
For WorldDEM the accuracy of one point in relation to the neighbored is reaching the standard deviation for the whole data set at a distance of approximately 200m (Fig. 20). This is similar for the other height models. The relative accuracy, corresponding to the relative precision, is important for the morphologic details, visible at contour lines.
Fig. 20: Standard deviation of neighbored points as function of
point distance for WorldDEM – relative accuracy
Usually it is better for height models with smaller point spacing. This must not be the case as comparisons of ASTER GDEM 1 and ASTER GDEM 2 showed (Jacobsen 2013).
Fig.21: contour lines based on LiDAR, contour interval 50m
Fig.22: contour lines based on WorldDEM, contour interval
50m, covered area ~ 6km x 5km
Fig.23: contour lines based on AW3D30, contour interval 50m
Fig. 24: Contour lines based on ASTER GDEM2, contour
interval 50m, covered area ~ 6km x 5km
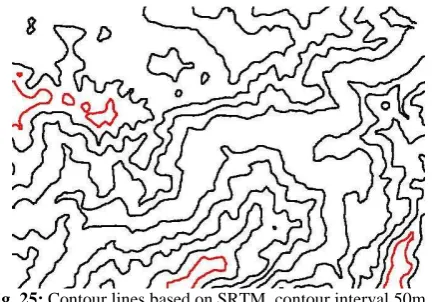
Fig. 25: Contour lines based on SRTM, contour interval 50m
The shown contour lines of a small sub-area, of approximately 6km x 5km, based on LiDAR (Fig. 21) are using a reduced LiDAR grid of 10m point spacing. It is nearly identical to the contour lines based on WorldDEM (Fig. 22), having also 10m point spacing. The accuracy of the LiDAR heights, estimated with 20cm, is clearly better as for WorldDEM, determined with NMAD=1.03m, but for the shown scale and the contour interval of 50m the lines are nearly identical.
The contour lines based on AW3D30 (Fig. 23) shows the influence of lower point spacing being in the average 28m as well as for ASTER GDEM 2 (Fig. 24) and SRTM (Fig. 25). ASTER GDEM 2 is not as accurate as AW3D30 and SRTM; this can be seen at small differences. Even based on same point spacing, the contour lines of AW3D30 show slightly more details as for SRTM and ASTER GDEM2 and SRTM again more as ASTER GDEM2. Nevertheless the WorldDEM contour lines are still better due to higher accuracy and smaller point spacing.
4. CONCLUSION AND OUTLOOK
The analyzed WorldDEM core digital surface model shows with an accuracy of SZ=1.63m and NMAD = 1.03m in non-forest areas with terrain inclination below 10% a satisfying result - even under the difficult condition of rough terrain in the project area. For terrain inclination up to 20% the standard deviation with SZ=1.77m is 9% larger, but a terrain inclination of 20% or 11° mainly is available in mountains, making the comparison of height models difficult. For a terrain inclination of 30% the standard deviation is even reaching 4.4m, showing the strong dependency of the accuracy from terrain inclination. In the difficult project area 5.7% of the points are located in terrain with inclination of 30% and larger. In forest areas with terrain inclination below 10% SZ with 2.54m and NMAD with 1.84m are larger as in non-forest area due to different canopy definition by InSAR against LiDAR.
With 10m point spacing and the achieved accuracy, contour lines with a contour interval of three times 1.03m, corresponding to 3.1m, or the next usual contour interval of 5m, can be generated.
The weighted linear regression of SZ in relation to the height error map is: SZ = 0.32m+0.24mHEM and the linear regression of SZ in relation to the multiple coverage is computed with: SZ=6.6m – 0.53 number of coverage for the non-forest area. This demonstrates the important use of a higher number of coverage’s in the difficult project areas and also the meaning of the height error map belonging to a data delivery. The accuracy analysis cannot be made with ICESat profile points having 66m footprint diameter, this does not respect the required morphologic details. In addition ICESat points are only
reliable in flat and open terrain. They allow the determination of the absolute height model orientation, but not the determination of the height model accuracy.
The most important disadvantage of the free of charge available height models AW3D30, SRTM and ASTER GDEM 2 is the point spacing, not allowing the determination of morphologic details as with WorldDEM. With a NMAD of 1.46m for AW3D30, for terrain inclination up to 10% and in non-forest area, in relation to the LiDAR reference instead of NMAD=1.03m for WorldDEM, AW3D30 is still good, but not as good as WorldDEM. In forest areas with terrain inclination up to 10% NMAD of AW3D30 is reaching 2.61m instead of 1.84m for WorldDEM. The SRTM height model in non-forest areas with inclination up to 10% has with NMAD = 1.39m and in forest areas NMAD = 3.02m even a lower accuracy. ASTER GDEM2 with NMAD of 5.45m clearly is not as accurate; in addition it has larger systematic errors.
The absolute orientation of the height models is also important (table 2). Especially some problems exist for ASTER GDEM2. For the other height models the shifts and tilts do not influence so much the accuracy numbers.
The difficult project area is not representative for the whole world, requiring additional test areas with different characteristics. In addition digital surface models have been analysed, often digital terrain models are required. In forest areas a filtering to digital terrain models is very difficult. As alternative InSAR using L-band is possible, penetrating vegetation, here the projected TanDEM-L would be helpful.
5. REFERENCES
Büyüksalih, G., Jacobsen, K., 2014: Large Area Covering LiDAR Height Models – Problems and Solutions, EARSeL Symposium Warsaw 2014
Fritz, T., Eineder, M., 2013. TerraSAR-X ground segment basic product specification document. Technical Note 1.9, German Aerospace Center, DLR, http://elib.dlr.de/43958/1/
Höhle, J & M Höhle, 2009. Accuracy Assessment of Digital Elevation Models by means of Robust Statistical Methods, ISPRS Journal of Photogrammetry and Remote Sensing, 64, pp. 398-406
Jacobsen, K., 2013. Characteristics and accuracy of large area covering height models, ISPRS Hannover Workshop 2013, ISPRS Archives – Volume XL-1/W1, 2013
Jacobsen, K., 2016a. Analysis and Correction of Systematic Height Model Errors, ISPRS Archives - Volume XLII-B1, 2016 Jacobsen, K., 2016b. Ersatz des SRTM Oberflächenmodells durch AW3D30?, Drei-Länder-Tagung Bern 2016
Passini, R., Betzner, D., Jacobsen, K., 2002. Filtering of Digital Elevation Models, ASPRS annual convention, Washington 2002
Rizzoli, P. et al. 2017. Generation and Performance Assessment of the Global TanDEM-X Digital Elevation Model, ISPRS Journal of Photogrammetry and Remote Sensing, in preparation Wecklich, C., Gonzalez, C., Bräutigam, B., 2015. Height Accuracy for the First Part of the Global TanDEM-X DEM Data,http://geomorphometry.org/system/files/Wecklich2015geo morphometry.pdf
Wessel, B., Aug. 2016. TanDEM-X Ground Segment DEM Products Specification Document. Technical Note 3.1, German Aerospace Center, DLR. http://elib.dlr.de/108014/