Atherosclerosis 150 (2000) 437 – 438
Letter to the Editor
www.elsevier.com/locate/atherosclerosis
The anti-atheroslerotic effect of Allium sati7um:
Statis-tics re-evaluated
The authors responsible for the statistics have reeval-uated the study ‘The antiatherosclerotic effect ofAllium sati6um’ published in Atherosclerosis [144 (1999) 237 –
249] with different statistical methods other than ap-plied in the original presentation. Regretfully, we have to inform you that in part deviating findings resulted which we would like to specify here.
The statistical problem in the calculation ofP-values in Table 8 (original publication) lies in the neglect of the dependence between the four measurements of plaque volumes over time per probationer. Therefore, the columns ofP- and SEM-values in Table 8 are not correct. Based on fixed follow-up times, the application of the Mann – WhitneyU-test (with respect to the quo-tient of measurement 4/measurement 1) as originally intended in its one-tailed form in the study design, would have been a simple solution of this problem. The difference between the final examination (measurement 4) and the baseline examination (measurement 1) is calculated and compared between the groups. This has also the advantage that the difference could correct individual influences from the probationer himself. Be-cause only two-tailed tests are recommended since 5th February 1998 ([1], Section 5.5), two-sided tests throughout are collected in Table 1.
On the other hand, the authors wanted to compare the time course of the plaque volume in the placebo and verum group over the four examinations in the follow-up. In view of the interdependence of the four investigations in each participant as well as the inhomo-geneity in axis intercept and slope of the individual regression lines, so-called ‘linear mixed effects models’ are recommended in the statistics to treat these problems.
Retrospectively, within the frame of such models the statistical procedure is a modified split-plot analysis of variance, where the blocks are regarded as being chosen at random from a population of blocks and the plots within the blocks give the repeated measurements within the primary sampled unit [2]. The existence of a modification of the regression line under garlic treat-ment is depicted in Table 1.
The linear mixed effects model is a generalization of the classical covariance analysis. Usually, in covariance analysis the influence of a continuous covariable is adjusted through a regression model. On the other hand, one can diminish the error in estimating the regression coefficients by estimation of a specific regres-sion line for each level of the factor ‘treatment’ (ad-justed regression [3,4]). Through separation of variance components, this leads to F-test statistics.F-test results were also included in Table 1.
TheP-values of the age-dependent evaluation proce-dure in Table 8 did not reach significance by the methodological approaches utilized here.
We used the same linear mixed effects model for ‘intention to treat’ analysis to study whether a model with treatment effect explains the observed data better than a model without treatment effect. The likelihood ratio test gave the results as indicated in Table 1. Again, for females a significant effect is shown.
The difference in age between placebo and verum group is more marked in women than in men (Mann – Whitney U-test, women:P=0.0073, men: P=0.0678). The missing correlation, however, between age and change in plaque volume over 4 years in women (Spear-man rank correlation; difference: r= −0.20, P= 0.1707, quotient: r= −0.18, P=0.2158) can be used as an argument that a distortion through age is not likely in this subgroup, and thus a significant result Table 1
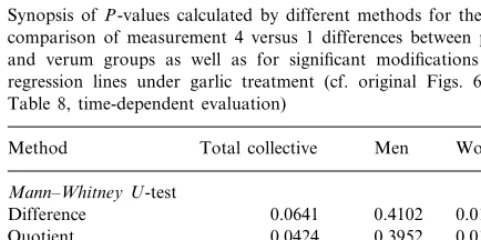
Synopsis ofP-values calculated by different methods for the simple comparison of measurement 4 versus 1 differences between placebo and verum groups as well as for significant modifications of the regression lines under garlic treatment (cf. original Figs. 6–8 and Table 8, time-dependent evaluation)
Women Method Total collective Men
Mann–Whitney U-test
0.0641
Difference 0.4102 0.0124
Quotient 0.0424 0.3952 0.0107
Linear mixed effects model
0.0391 0.7271
0.1427 Per protocol
0.0218 Intention to treat 0.3122 0.3443
F-test
0.0140 0.9296
Combination 0.1127
Letter to the Editor 438
Table 2
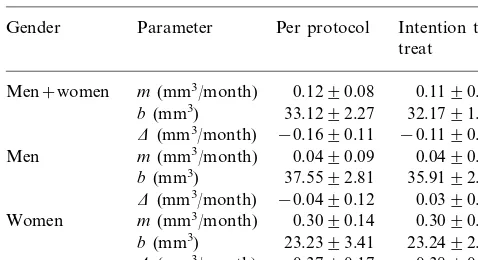
Slopes (m) and axis intercepts (b) of the regression linesy=mx+b for placebo derived from a linear mixed effects modela
Gender Parameter Per protocol Intention to treat
Men+women m(mm3/month) 0.1290.08 0.1190.07 33.1292.27 32.1791.72 b(mm3)
−0.1690.11
D(mm3/month) −0.1190.10
m(mm3/month)
Men 0.0490.09 0.0490.08
37.5592.81 35.9192.10 b(mm3)
−0.0490.12
D(mm3/month) 0.0390.13
m(mm3/month)
Women 0.3090.14 0.3090.14
23.2393.41 23.2492.67 b(mm3)
−0.3790.17 −0.3890.18 D(mm3/month)
aValues are given with standard error. Per protocol probationers:
105 men, 47 women; per protocol observations: 420 men, 188 women; intention to treat: 198 men, 82 women; intention to treat observa-tions: 546 men, 237 women. The change in slope under treatment is indicated byD. ‘Per protocol’ values are compared with ‘intention to treat’ values.
years had been too short to be able to detect a signifi-cant garlic effect and/or that it would have been more appropriate to include male probationers between 20 and 60 years of age into the study.
Conclusions
Utilizing different statistical methods as well as con-sidering the per protocol and the ‘intention to treat’ analysis, one arrives in principle at similar conclusions. Significant effects of garlic were confirmed in women and there was a clear trend in the total collective of men+women, the effect in men, however, turned out to be non-significant.
Acknowledgements
The authors are deeply indebted to Dr U. Mansmann and Prof. Dr Th. Tolxdorff (Free University of Berlin) and Prof. Dr K.-D. Wernecke (Humboldt University, Charite´) for supporting the reanalysis of the data and for encouraging help during the elaboration of this letter to the editor.
References
[1] ICH Expert Working Group. ICH harmonised tripartite guide-line. Statistical principles for clinical trials. Stat Med 1999;18:1905 – 42.
[2] Laird NM, Ware JH. Random-effects models for longitudinal data. Biometrics 1982;38:963 – 74.
[3] Wernecke K-D. Angewandte Statistik fu¨r die Praxis. Bonn, Paris, Reading, Menlo Park: Addison-Wesley, 1995.
[4] Wernecke K-D, Ulrich WD. Application of covariance analysis to ophthalmologic research. Biomed J 1978;20:107 – 14.
8 February 2000 G. Siegel, D. Klu¨ßendorf
Institute of Physiology,
Biophysical Research Group,
Uni6ersity Clinic Benjamin Franklin
of the Free Uni6ersity of Berlin,
Arnimallee 22, D-14195 Berlin,
Germany
E-mail: [email protected] between placebo and verum group can be ascribed to
the garlic treatment. An average increase of 0.30 mm3 per month in plaque volume is estimated (Table 2). This is a population value. For the single individual a value resulted that is normally distributed, with a mean value of 0.30 and a standard deviation of 0.51. This increase is undone by garlic treatment. The reduction of plaque volume is estimated to be 0.37 mm3 per month (Table 2) or 74.9% after 4 years (PV0=23.7 mm
3, cf.
original publication). Furthermore, under garlic treat-ment an effective regression of plaque volume by 0.07 mm3/month, or 14.2% related to the observation time of 4 years, has been found.
Comparing the slopesmof regression lines calculated according to the linear mixed effects model (Table 2) with those originally published (Table 8), almost identi-cal values ensued. The reduction in plaque volume over a 4-year period was estimated to be 23.1% in the total collective (−0.16 mm3
/month) and 5.1% in men (−0.04 mm3
/month), respectively. While this effect in men+women varied between significant, borderline and trend, the reduction in plaque volume was non-sig-nificant in men, signon-sig-nificant, however, in women (cf. Table 1). Having noticed practically no changes of plaque volume in men after the age of sixty, the conclu-sion is obvious that the observation period of four
.