REPORT EMERGY: CASE STUDY IN PROVINSI
DAERAH ISTIMEWA YOGYAKARTA
Jatiningrum
Magister Sains of Accounting of Gadjah MadaUniversity Indra Bastian
Gadjah Mada University e-mail: [email protected]
Abstract
This study is an effort to preparing the emergy balance sheet and the emergy surplus-deficit port and also presenting the results of emergy indices analysis to accommodate all the natural re-sources that produce energy that is owned and controlled by the Provincial Government of Provinsi Daerah Istimewa Yogyakarta in the period 2006-2010. Further development of the anal-ysis method presented in this report will enable policy-makers, in this case the Provincial Gov-ernment of Provinsi Daerah Istimewa Yogyakarta (DIY), as the first complete and worth exami-nation between economic and environmental accounting data before making a decision regarding the policy on natural resources, energy, and the environment.
Keywords: emergy, the emergy balance sheet and the emergy surplus-deficit report, emergy in-dex, natural resources.
Abstrak
Penelitian ini adalah sebuah usaha untuk menyiapkan neraca emergi dan laporan surplus-defisit emergi dan juga untuk menyajikan hasil analisis indeks emergi untuk mengakomodasi semua sumber daya alam yang menghasilkan energi yang dimiliki dan dikendalikan oleh Pemerintah Provinsi Daerah Istimewa Yogyakarta (DIY) periode 2006-2010. Pengembangan metode analisis berikutnya yang disajikan dalam laporan tersebut akan membantu pengambil kebijakan, dalam kasus ini adalah Pemerintah Provinsi Daerah Istimewa Yogyakarta, sebagai pengujian pertama yang lengkap dan berharga antara data akuntansi lingkungan dan ekonomi sebelum mengambil keputusan yang berkaitan dengan kebijakan sumber daya alam, energi, dan lingkungan.
Kata kunci: Emergi, neraca emergi dan laporan surplus-defisit emergi, indeks emergi, sumber daya alam.
INTRODUCTION
The financial statements of a public sector that is so far in Indonesia, never include natural re-sources as a source of energy but a wealth of natural resources to be reckoned with.The bal-ance sheet produced by the Government only to dwell on the assets of the country and never talk about natural resources and energy are controlled by the Government. The balance sheet should include natural resources as a source of energy, so that The balance sheet can actually be used as a basis for decision making. Provide an important point to the existence of
natural resources and energy in the financial statements of a public sector are expected to be helpful to do a more definite plan in the man-agement of natural resources and energy. Natu-ral resources as a source of energy should be reckoned with in the financial statements of public sector, this is due to the natural re-sources and energy is the source of income or principal assets for the Government.
This study has two objectives: (1) an effort to prepare the emergy balance sheet and the emergy surplus-deficit report to accom-modate all the natural resources that produce
energy that is owned and controlled by the Provincial Government of Provinsi Daerah Istimewa Yogyakarta (DIY) in the period 2006-2010, and (2) an effort presenting the results of emergy indices analysis in Provinsi Daerah Istimewa Yogyakarta within the peri-od 2006-2010, as a basis for policy in utiliza-tion of natural resource that produce energy and its impact on the environment and the sys-tem as a whole.
In this study, the authors apply it to analyze Provinsi Daerah Istimewa Yogyakar-ta. Besides practical reasons, this is also due to Yogyakarta, including areas that do not recog-nize the natural resources and energy as part of regional development assets.
Further development of the analysis method presented in this report will enable policy- makers in this case the Provincial Gov-ernment of Provinsi Daerah Istimewa Yogya-karta for the first time examine complete and worth between economic and environmental accounting data before making a decision re-garding the policy on natural resources, ener-gy, and the environment. And this is the first step to implement the emergy basis of the fi-nancial statements in other areas in Indonesia, especially in Indonesia itself.
LITERATURE REVIEW AND HYPOTH-ESES DEVELOPMENT
Emergy Reports
Emergy report referred to in this study in the form of the emergy balance sheet and the emergy surplus-deficit report. the emergy bal-ance sheet and the emergy surplus-deficit re-port that this refers to the explanation given Campbell and Meisch (2005) in Environmental Accounting Using Emergy: Evaluation of the State of West Virginia. In their study, Camp-bell and Meisch (2005) mentions the emergy surplus-deficit report as a report that provides information regarding the increase or decrease in total emergy flow generated and used by en-tities in each year. This report is available by comparing the total emergy flow is generated and used in the current year with a total emergy flow is generated and used in the previous year. The emergy balance sheet according to Camp-bell and Meisch (2005) is a table that contains the current value of emergy that is an asset of
the system. The depiction of an entity's finan-cial position on Finanfinan-cial Assets, Non-Financial Assets, Non-Financial Liabilities and Eq-uity, and Non-Financial Liabilities & Equity on a certain date. Where the available emergy for use in the category of Non-Financial Assets, while natural resources and energy used to pro-duce emergy into the Non-Financial Liabilities & Equity. The purpose of this report is to pro-vide information related to emergy use of ener-gy from natural resources are used in an effort to advance the Government's economic growth in their area. The emergy surplus-deficit report makes the local government will find infor-mation about the increase or decrease in total emergy flow is generated and used in each year, which can later be used as a basis for sus-tainable use and management policies in an ef-ficient and effective energy of natural re-sources, the future to support the sustainability of economic development.
Emergy
According to Campbell and Meisch (2005), earlier economists often have difficulty under-standing the concept of emergy and had to face so much trouble to document the economic and ecological flows and storage in these terms. The practical answer is that accounts for envi-ronmental systems can not be stored in units of currency, because the system is based on the work of both men are paid for by the current count in the currency, and the nature or ecosys-tem, where there is no money to be paid.
Odum et al. (2000) in Handbook of Emergy Evaluation, Introduction and Global Budget translate emergy (spelled with a "m") as available energy (exergy) of a type that is needed in the transformation process, both di-rectly and indidi-rectly to produce goods or ser-vices. Further Odum et al. (2000) said, emergy is a statement of all energy used in the process of the work to produce products or services within a unit of energy type. Emergy using thermodynamic basis of all forms of energy, resource and human services, and turn it into the equivalent of one form of energy, usually solar emergy. Thermodynamic in Wikipedia (Greek: thermos = 'hot' and dynamic = 'change') is the physics of energy, heat, work, entropy and the spontaneity of processes.
Figure 1: Emergy Transformation Process (University of Florida, 2012a)
Odum et al. (2000) calls transformity as a kind of measure of efficiency, as it relates to all of the input to the output. The lower transformity, the conversion more efficient. It follows from the thermodynamicsecond law that there is some minimal transformity con-sistent with the maximum power operation. According to Odum et al. (2000), although we have no way to calculate it, but we can use the lowest transformity found in the operating sys-tem as a long-term approach. If transformity used to estimate the theoretical potential of some systems, it is appropriate to use trans-formity (lowest) best known.
Emergy with Money Relationship
EmRupiah Value (abbreviated emRp) of a product or service is part of the total purchas-ing power in the system caused by a product or service from the economy or nature. This
ratio means that the average amount of emer-gy purchased by spending a dollar. In other words, the ratio of emergy/rupiah tell us the purchasing power of dollars in real wealth (emergy) that can be purchased. The money is used to purchase products such as food, fuel, clothing, housing, electricity, information, etc. according to their market price. EmRp ob-tained by dividing the total emergy with gross regional domestic product (GRDP). Thus, GRDP is an indicator to regulate the extent to which the success of the government in utiliz-ing existutiliz-ing resources and can be used as a planning and decision- making. There are 2 types of GRDP used in this study, the GRDP at current prices that can be used to see the shift in economic structure, whereas the GRDP at constant prices in 2000, which can be used to determine the economic growth from year to year.
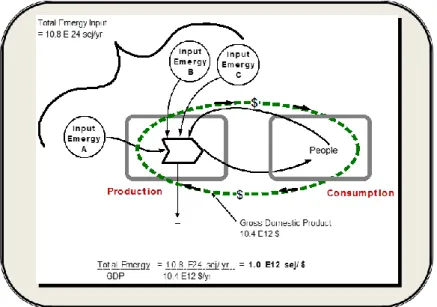
Figure 2: Sample Forms Relationship between Emergyand Money (University of Florida, 2012a)
In p u t Em e r g y
A Out put Emergy = A + B + C
T r a n sf o r m a t io n Pr o c e s s In p u t Em e r g y B In p u t Em e r g y C
RESEARCH METHOD The Data
Secondary data used in this study covers the objects of natural resources in Provinsi Daerah Istimewa Yogyakarta, such as agriculture, plantation, forestry, animal husbandry, fishery, fuels for industrial, minerals group C, water resources, water for consumption, sunlight, wind, rain, and air humidity and pressure. Da-ta Da-taken in the form of relevant information on the total amount of output of each object and the amount of production that the consumption of the population in the range of 2006-2010. For most of the data needed research, authors get through catalogues DIY in Figures pub-lished by the Central Statistics Agency (BPS) in each year. But there are few research data that must be the author via e-mail get from central ministries directly, such as the Minis-try of ForesMinis-try, MinisMinis-try of Public Works, the Ministry of Energy and Mineral Resources, Ministry of Environment, the Ministry of In-dustry and Trade, Office of Water, and the Company National Electricity (PLN). For data on wind, rain, and air humidity and pressure, the authors get it through the help of the Me-teorology, Climatology, and Geophysics. As for the data on intensity of sunlight, the au-thors obtain it through Florida University website (see University of Florida 2012b). Emergy Accounting Cycle
Common methodology in the emergy account-ing cycle as reported in University of Florida (2012a) is a "top-down" systems approach and includes 2 steps that are described in the fol-lowing sections:
1. Making Left-right Energy Systems Dia-gram.
This is done to put the system out of the fo-cus of attention in perspective, arranging idea and relationship between components and exchange lines and flow of resources occurs. A diagram such as this is a useful tool to determine the needs of the data, in which the relationship between the system and systems outside and among the parts themselves have been translated in the form
of energy and material flows. So it can be said that the purpose of the diagram system to perform critical inventory of the process, storage and flow are important as a driver of the system (all cross-border inflows sys-tem). This in turn points to the exact factors that need to be measured when the field work required.
2. Making of the emergy flow table, the emergy balance sheet and the emergy sur-plus-deficit report.
Flow paths that cross the boundaries of the system and the relevant pathways within the boundaries of the system put in currents emergy tables and calculations developed to evaluate the path of energy flow. The raw data and conversion factors were col-lected to complete the table. Conversion factors, such as energy content and trans-formity required to transform raw data into emergy units, the next step is to determine the overall value emRupiah for later to con-tribute value on each resource item. The end product of this phase are the emergy flow table, the emergy balance sheet and the emergy surplus-deficit report.
The Emergy Balance Sheet and The Emergy Surplus-Deficit Report Analysis
Emergy Index Calculation
The final step is emergy evaluation is the cal-culation of emergy index by first classifying the existing resource, a renewable resource (R), non-renewable resources (N), imported resources (F), and calculate the total emergy (U). Here is a description of emergy indices used in this study.
1. Environmental Loading Ratio
It’s the ratio of emergy used from non-renewable resources and the resources of goods and services imported into renewable resources. Where it shows is the number of input emergy that are not renewable or lo-cally available to the economy and shows the pressure on local ecosystems from im-ported energy and materials. The higher proportion of renewable emergy used by an economy, the lower the Environmental Loading Ratio. On the other hand, the
economy is highly dependent on external sources of emergy have high Environmen-tal Loading Ratio. In general, is a measure of ecosystem stress due to economic activi-ty (Haden in Skuladottir, 2005).ELR = ( non-renewable resources + imported re-sources) / renewable resources.
Or: (N + F) / R.
2. Emergy Investment Ratio.
The ratio of emergy purchased from out-side the system to emergy supplied by re-newable energy sources and non-rere-newable of the system is called Emergy Investment Ratio because the ratio of emergy invested for residents. It shows the proportion of in-vestment to economic resources native to the area and reflects the intensity of devel-opment (Campbell & Meisch, 2005). EIR = imported resources / (non-renewable re-source + renewable rere-source). Or: F / (N + R).
3. Empower Density.
Empower Density is the number of emergy flow for a certain time. Urban with indus-trial systems, commercial business and housing construction development of high-density has high entry emergy flow and this means high Empower Densitycompared to
rural areas. Empower Density Ratio is the amount of emergy used in the economy of a region's total land area.ED = total emergy / area. Or: U / area.
4. Emergy per person (EPP).
The ratio of total emergy by population. It shows how the consumption related to population and, in a sense, this index is the responsibility of every resident in the use of resources.EPP = total emergy / population. Or: U / population.
RESULTS AND DISCUSSION Left-right Energy Systems Diagram
The first step in this phase is to determine there source points and main activity in the system. The process of a major transformation are the agriculture, plantation, forestry, animal husbandry, fishery and aquatic ecosystems. The process ofa secondary transformation are manufacturing industrial, mining, services and trade, transportation and disposal. Subsystems such as people and household, government, and tourists are described as consumers (hexa-gons), which works as an attract orf or the flux through the existing transportation system in the region.
The second step is to give the relation-ship between the components through the ex-change and flow of resources going on, both inside and outside the system, as shown in Figure 3, a large square to define the bounda-ries of the system under study, Provinsi Dae-rah Istimewa Yogyakarta.
The Emergy Flow Table
The first step in this phase is to collect data related to the natural resources that exist in the system (including external systems that affect the system). Second, perform unit conversions of existing resources data into units of joules. Third, perform transformity from emergy to joules. The next step is to determine the over-all value emRupiah for later to contribute this value on each resource item.
The Emergy Balance Sheet
There are examples of the emergy balance sheet resulted of authors in this study (table 6 and table 7).
By including the available emergy for use in the category of Non-Financial Assets, while natural resources and energy used to produce emergy into the Non-Financial Liabil-ities & Equity in making the emergy balance sheet from Provincial Government of Provinsi Daerah Istimewa Yogyakarta, means the Gov-ernment has to involve energy derived from the natural resources in the activities and eco-nomic growth in their area.
The Emergy Surplus-Deficit Report
There are examples of the emergy surplus-deficit report resulted of authors in this study (table 8 and table 9).
Table 6: The Emergy Balance Sheet in 2007 Using the emRupiah value of the Current Price GRDP
Asset Liabilities and Equity
Financial Assets XXX Liabilities and Equity XXX
Non-Financial Assets XXX Non-Financial Liabilities & Equity XXX
Emergy 41,500,000 SDA and Energy 41,500,000
Total Assets XXX Total Liabilities and Equity XXX Table 7: The Emergy Balance Sheet in 2007
Using the emRupiah value of the Constant Price GRDP
Aktiva Passiva
Financial Assets XXX Liabilities and Equity XXX
Non-Financial Assets XXX Non-Financial Liabilities & Equity XXX
Emergy 23,100,000 SDA and Energy 23,100,000
Total Aktiva XXX Total Passiva XXX
Table 8: The Emergy Surplus-Deficit Report in 2007 Using the emRupiah value of the Current Price GRDP
Value of Emergy in 2007 41,500,000
Value of Emergy in 2006 (37,200,000)
Increase in the Value of Emergy 4,300,000
Table 9: The Emergy Surplus-Deficit Report in 2007 Using the emRupiah value of the Constant Price GRDP
Value of Emergy in 2007 23,100,000
Value of Emergy in 2006 (22,200,000)
The emergy surplus-deficit report makes the local government will find infor-mation about the increase or decrease in total emergy flow is generated and used in each year. This reportis important for the manage-ment and sustainable useof natural resources and energy more efficiently and effectively, given the continued increase in the number of inhabitants in Provinsi Daerah Istimewa Yog-yakarta.
Emergy Index Calculation
To calculate the emergy indices, the available resources in Provinsi Daerah Istimewa Yog-yakarta must first be classified as a renewable resource, non-renewable resources, and re-sources are imported. Materials and renewable energy used directly by the people in which the flow of material and energy used at a rates lower than the rate of their generation, such as the production of food crops, the production of vegetable crops, fruit crops production, pro-duction of plantation crops, propro-duction of for-est products, livfor-estock production and fisher-ies, water resources, as well as self-produced electricity at 2.505% of the total electricity supply in the province is treated as a renewa-blere source(labeled R). Material and non-renewable energy used by people to flow orig-inating from the storage used at a rate faster than their regeneration such as: waterfor con-sumption (assumed to be non-renewable be-cause of the risk of over-exploitation as a re-sult of the level of the population continues to grow), land, minerals group C (labeled N). Fuel purchased for local transportation, indus-try, and electricity imported for 97.495% of the total electricity supply in the provinceis treated as a resource that is imported (labeled F).
Summary of Research Findings
The main source of flow for the entire region in the province of Yogyakarta has been calcu-lated as follows:
1. Total emergy used in Provinsi Daerah Is-timewa Yogyakarta in 2006 was 3.17E + 21sej/year, in 2007 was 3.59E+21sej/year,
while in 2008, 2009 and 2010 are 5.88E+21sej/year, 6.04E+21sej/year, and 6.16E+21sej/year, respectively. This value corresponds to the number of all emergy flow that supplies the entire region.
2. Total renewable emergy (R) in Provins i Daerah Istimewa Yogyakarta in 2006 was 5.17E+19sej/year, in 2007 was 5.19E+19sej/year, while in 2008, 2009 and 2010, are 5.83E +19 sej/year, 5.63E+19sej/year, and 8.74E+19 sej/year, respectively.
3. Total non-renewable emergy (N) in Provinsi Daerah Istimewa Yogyakarta in 2006 was 2.19E+21sej/year, in 2007 was 2.50E+21sej/year, while in 2008, 2009 and 2010are 4.75E+21sej/year, 4.80E + 21sej/year, and 4.83E+21 sej/year, respec-tively.
4. Total imported emergy (F) in Provins i Daerah Istimewa Yogyakarta in 2006 was 9.27E+20sej/year, in 2007 was 1.04E+21sej/year, while in 2008, 2009 and 2010 are 1.07E+21sej/year, 1.18E+21sej/year, and 1.24E +21 sej/year, respectively.
As for the results of emergy indices in Provinsi Daerah Istimewa Yogyakartahas been calculated as follows:
1. Provinsi Daerah Istimewa Yogyakarta has fluctuated Environmental Loading Ratio (ELR) significantly. From 2006 were only 60.29, increased to 68.21 in 2007 and 99.83 in 2008. The highest increase was in the year 2009 ie 106.22, although in 2010, fell to 69.45. A sharp spike in 2009 suggests the utilization of non-renewable resources are more dominant than the re-newable resources in the process of eco-nomic growth. These results lead to high stress on the ecosystem or "load" weight on environmental waste treatment capaci-ty.
2. Empower Density is the number of emer-gy flow for a certain time. Urban with in-dustrial systems, commercial business and housing construction development o f high-density has high entry emergy flow
and this means high Empower Densit y compared to rural areas. Empower Densi-ty Ratio is the amount of emergy used in the economy of a region's total land area. Provinsi Daerah Istimewa Yogyakarta in 2006 had ED amounted to 9.95E+11sej perm2, in 2007 amounted to 1.13E+12sej per m2, while in 2008, 2009, and 2010 are 1.85E+12sej per m2, 1.90E+12 sej per m2, 1.93E+12 sej per m2. The increase ratio in each year Provinsi Daerah Istimewa Yog-yakarta showed a fairly good progress. There are always economic development in this area every year, such as the growt h of new industries.
3. Emergy per Person (EpP) is the ratio o f total emergy with the population. It shows how the consumption related to popula-tion and, in a sense, this index is the re-sponsibility of every resident in the use o f resources. Provinsi Daerah Istimewa Yogyakarta in 2006 had amounted to 9.32E+14 sej per people,in 2007 sebesar 1.05E+15 sej per people, while in 2008, 2009, dan 2010 are 1.70E+15 sej per peo-ple, 1.72E+15 sej per peopeo-ple, 1.78E+15 sej per people. These results indicate a n increase in the level of consumption o f the emergy per one people in each year. The high ratio to be a good sign, because it means that people more prosperous. However, a bad sign, if the high ratio is not balanced with the management and utilization of energy resources more effi-ciently and effectively.
4. Emergy Investment Ratio (EIR) is the ra-tio of the external input emergy purchased to support the system in conjunction wit h all local emergy, both renewable and non-renewable. It shows the proportion of in-vestment to economic resources native to the area and reflects the intensity of de-velopment (Campbell & Meisch, 2005). A high level of EIR system is a kind of fra-gility because of its dependence on the input of other economic systems. Degree of dependence on other ecosystems showed weakness in competitive capacit y (self-reliance and long-term
sustainabil-ity) of the local system, because the avail-ability of resources for the development and maintenance are not under the contro l of the system. Provinsi Daerah Istimewa Yogyakarta in 2006 and 2007 had the EIR by 0.41, while in 2008, 2009 and 2010 0.22, 0.24, and 0.09, respectively. These results indicate that relatively low intensi-ties corresponding between economic emergy purchased from outside the regio n with emergy from renewable environmen-tal resources and are not renewable in the region. This index shows that Provins i Daerah Istimewa Yogyakarta a is still a n interesting place to further economic in-vestment.
5. EmRupiah or emergy to money ratio is obtained by dividing the total emergy use of a region with a gross regional domestic product, the result is the average amount of emergy purchased by spending a dollar (sej/rupiah) termed emRupiah (abbreviat-ed emRp). In other words, the ratio o f emergy/rupiah tell us the purchasing power of dollars in real wealth (emergy) that can be purchased. A low emergy val-ue of the rupiah does not mean that the emergy less in circulation. In fact, many areas with a low ratio of emergy to rupia h has emergy use value per capita is ver y high. It simply means that the region is more dependent on the use of environ-mental resources beyond the boundaries of their territory, and resulted in the use o f money to acquire goods and services to support the economy.
Using the GRDP at current prices, Provinsi Daerah Istimewa Yogyakarta in 2006 and 2007 had a value of 1,08E+8 sej per rupiah dan 1,09E+8 sej per rupiah, while in 2008, 2009, and 2010 respective-ly 1.54E+8 sej per rupiah, 1.46E+8 sej per rupiah and 1.36E+8 sej per rupiah. Fro m these results it can be seen that Provins i Daerah Istimewa Yogyakarta in 2008 had a ratio of emergy to the rupiah higher tha n another 4 years, so it can be concluded that the purchasing power of the rupia h against real wealth (emergy) strongly
dur-ing the year.When usdur-ing GDP at constant prices 2000, Provinsi Daerah Istimewa Yogyakarta in 2006 and 2007 had a value of 1.81E+8 sej per rupiah and 1.96E+8 sej per rupiah, while in 2008, 2009, and 2010 each amounted to 3.06E+8 sej per rupiah, 3.18E+8 sej per rupiah and 2.93E+8 sej per rupiah. From these results it can be seen that the Yogyakarta Special Regio n in 2008 and 2009 experienced the best growth than in 2006, 2007, and 2010. CONCLUSION
The conclusions of research by the authors in this time are as follows:
1. Total emergy used in Provinsi Daerah Is-timewa Yogyakarta in 2006 was 3.17E+21 sej/year, in 2007 was 3.59E+21sej/year, while in 2008, 2009 and 2010 are 5.88E+21 sej/year, 6.04E+21 sej/year, and 6.16E+21 sej/year, respectively. Total an-nual emergy value is almost 70% is domi-nated by non-renewable emergy (N). While renewable emergy (R) and the im-ported emergy (F) each contributed 2% and 27%.
2. Sharp spike Environmental Loading Ratio (ELR) in 2009 suggests the utilization o f non-renewable resources are more domi-nant than the renewable resources in the process of economic growth. These re-sults lead to high stress on the ecosyste m or "load" weight on environmental waste treatment capacity.
3. Increasing the ratio of Empower Densit y (ED) in each year in Provinsi Daerah Is-timewa Yogyakarta showed a fairly good progress. That means, there is always economic development in this area ever y year, such as the growth of new indus-tries.
4. Results of Emergy per Person (EPP) showed an increase in the level of con-sumption of the soul emergy per popula-tion in each year. The ratio of high to be a good sign, because it means that people more prosperous. However, a bad sign, if the high ratio is not balanced with the
management and utilization o f energy re-sources more efficiently and effectively. 5. Results of Emergy Investment Ratio
(EIR) showed relatively low intensities corresponding between economic emergy purchased from outside the region wit h emergy from renewable environmental sources and are not renewable in the re-gion. This index shows that Provinsi Dae-rah Istimewa Yogyakartais still an inter-esting place to further economic invest-ment.
6. Results of emRupiah or the ratio of emer-gy to money using GDP at current prices can be seen that Provinsi Daerah Istimewa Yogyakartain 2008 had a ratio of emergy to the rupiah higher than another 4 years, so it can be concluded that the purchasing power of the rupiah against real wealt h (emergy) strong during the year. While the results emRupiah or the ratio of emer-gy to money using GDP at constant prices in 2000 can be seen that the Yogyakarta Special Region in 2008 and 2009 experi-enced the best growth than in 2006, 2007, and 2010.
So overall it can be concluded that the level of the economy in the province of Yog-yakarta showed good results in 2009. This is indicated by the value of emRupiah or emergy to money ratio using GDP at constant prices in 2000. Although the value of emRupiah or emergy to money ratio using GDP at current prices fell from 2008, but in 2009 still show better results than in 2006, 2007 and 2010. Although the rate of the economy in the prov-ince of Yogyakarta Special Region in 2009 was pretty good, but economic growth is still dominated by the use of non-renewable re-source that almost 70% of the total available emergy. In light of this, the Government should Yogyakarta continue to improve the management and utilization of energy re-sources more efficiently and effectively, be-cause in the future there will certainly still emergy usage spikes that followed the popula-tion growth as economic growth.
By including the available emergy for use in the category of Non-Financial Assets, while natural resources and energy used to produce emergy into the Non-Financial Liabilities & Equity in making the emergy balance sheet from Provincial Government of Provinsi Dae-rah Istimewa Yogyakarta, means the Govern-ment has to involve energy derived from the natural resources in the activities and econom-ic growth in their area. The emergy surp lus-deficit report makes the local government will find information about the increase or de-crease in total emergy flow is generated and used in each year. This is an excellent first step in an effort to management and sustaina-ble use of natural resources and energy more efficiently and effectively, given the continued increase in the number of inhabitants in Provinsi Daerah Istimewa Yogyakarta.
Limitation
Emergy base complex to use, although it can be said that by using emergy basis, all the de-tails of the data and holistic frame of an area can be created by combining a lot of different sides of the economic and the environment system. Sustainability emergy base is an issue transdisciplinary, which is necessary in a vari-ety of perspectives from different disciplines to be able to measure emergy a more accurate and reliable. To do emergy basis, a researcher must collect raw data relating existing re-sources in a region as detail, and it takes a lot of time and cost as well as prudence. Because according to Campbell in Skuladottir (2005) the accuracy of emergy evaluation depends on the overall accuracy of the calculation a varie-ty of raw data collected.
In this thesis, where the resources in Provinsi Daerah IstimewaYogyakarta which will be put into a renewable resource with a label R, turns out to be the hard part done in the analysis. In this study, the authors take to assume the production of food crops, the pro-duction of vegetable crops, the propro-duction of
fruit crops, the production of plantation crops, the production of forest, the production of livestock and fisheries as a renewable re-source. The authors recognize the classifica-tion of the producclassifica-tion of food crops, the pro-duction of vegetable crops, the propro-duction of fruit crops, the production of plantation crops, the production of forest, the produc tion of livestock and fisheries in other areas may be different, especially in areas that may be bar-ren and dry.
Future studies are expected to refine these results by conducting a more detailed study by the districts/cities in Provinsi Daerah Istimewa Yogyakarta. The study was to de-termine the economic growth in compariso n to their respective districts/cities in the utilization and management of natural resources that pro-duce energy. Results of research conducted by this author can be used as a comparison tool. REFERENCES
Campbell, D. E. & Meisch M. E. (2005). En-vironmental accounting using emergy: Evaluation of the State of West Virgin-ia. Narragansett: U.S. Environmental Protection Agency, O ffice of Research and Development.
Odum, H. T., Brown, M. T., & Brandt-Williams, S. (2000). Handbook of emergy evaluation, folio # 1, introduc-tion and global budget Gainesville: University of Florida.
Skuladottir, B. H. (2005). Primary emergy evaluation of Iceland: The question of a sustainable natural resource man-agement. Lund: Lund University. University of Florida. (2012a). Retrieved 5
July 2013, from
http://www.emergysystems.org/.
University of Florida (2012b). Retrieved 18
June 2012, from