Journal of Computer Science and Information Technology, Vol. 1,No 1, 2016, pp. 19 Copyright © 2016 by LPPM UPI YPTK
Classification of Sales Agent for Cement Distribution using
K-Means Clustering
Yeng Primawati
1*, Ihsan Verdian
1, and Gunadi Widi Nurcahyo
11
Universitas Putra Indonesia YPTK Padang, Sumatera Barat, Indonesia
Received 02 February 2016; Revised 19 March 2016; Accepted 20 June 2016
Abstract
Agent is one of very important assets for distributors. A better knowledge of the agents and their behavior is required, particularly to support decisions related to the company's business strategy and to manage a better relationship with distributors. Such knowledge can be obtained by classifying agents based on their behavior through historical data, such as the sale and purchase transaction data. One approach that can be done is a segmentation approach can be done by dividing the agents into several segments. In this paper, Data Mining techniques i.e.k-means clustering method is exploredto classify sales agents. By implementing k-means,the knowledge about the best agents can be acquired along with the agents that have least contribution to the distributor.
Keywords: Data Mining;k-means;Clustering; Agent.
1.
Introduction
of the sales agents is to maximize the value of each agent for the distributor. Through segmentation, agents with better performance tend to have different treatment in the distribution services [23,24,25,26]. This allows marketers of the company to choose an effective way of treating agents with different characteristics,since the objective of this segmentation is to establish a better relationship with the customer in order to maximize revenue [27,28,29]. One of the things that can be done to determine the characteristics of the agent is to learn the sales historical data and find hidden knowledge is using Data Mining.The RFM (Recency, Frequency, and Monetary) model is known as one of the customer value analysis method that was first introduced by Bult and Wansbeek in 1995 as described in [30],and has been applied in marketing for a long time. In [31], authors suggested that the integration between RFM analysis and Data Mining to sales data can yield useful information about current customers or new customers. Indicators in RFM analysis are:
a. Recency of last purchase (R); R represents recency , referring to the last time interval of purchase until the current time.
b. Frequency of the purchases (F); F represents the frequency refers to the number of transactions in a given period of time.
c. Monetary value of the purchases (M); M represents monetary refers to how much money is consumed in a specific time period.
In this paper, Data Mining techniques i.e.k-means clustering method is exploredto classify sales agents with respect to RFM. By implementing k-means, the knowledge about the best agents can be acquired along with the agents that have least contribution to the distributor.
The rest of this paper is organized as follow. Section 2 presents proposed method. Section 3 presents results and discussion. Finally, the conclusion of this work is presented in Section 4.
2.
Methodology
Supporting data that is relevant to the research process in determining segmentation agents using data mining techniques are historical sales data[21,22].Preprocessing is a stage in the Data Mining thatrequires long time to complete[32]. Many raw collected data do not meet the appropriate criteria to conduct mining process, such as records that are incomplete or unclear and the selection of inappropriate attributes for Data Mining processes[33]. This stage also made transformation of data into the Recency, Frequency and Monetarymodel [30].
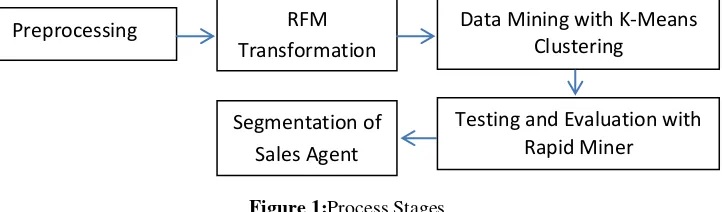
At the design stage, the number of clusters is determined along with specifications of the hardware and software used. Sales agent data value that has been calculated using RFM analysis will be processed by using Rapid Miner to obtain a conclusion regarding the pattern resulting from the process of data extraction (Pattern Evaluation). After testing Rapid Miner, the next step is to determine the sales agent segment. Figure 1 shows the process stages conducted in this study.
Figure 1:Process Stages
From Figure 1, there are five processes proposed i.e. preprocessing, RFM transformation, data mining with k-means clustering, testing and evaluation with rapid miner, and finally segmentation
3.
Result and Discussion
3.1.
Data Analysis
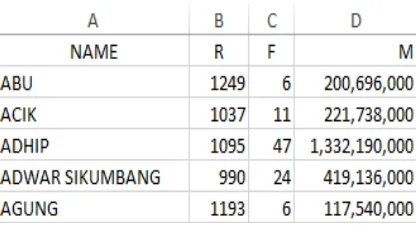
The data used in this study is the historical cement sales data for one year i.e. in2012 of a cement distributor company. Table 1 as followpresents a sample of XYZ company cement sales data only in 2 January 2012.
Table 1: Cement sales data sample
3.2.
Data Preprocessing
Before the data is processed by the Data Mining, many missing values in raw data are often found i.e., the distortion value, non-saving value (misrecording), sampling is not good enough,etc. In the preprocessing, the selection of attributes to be used is also performed.
3.3.
Applying RFM Model
In applying the RFM model, as described in Figure 1 earlier, the sample value of RFM is obtained in Table 2 as follows:
Table 2:RFM Values
Table3:Scalingrules
Table 4 shows RFM sample sales data values after scaling.
Table4:RFM Values afterScaling
3.4.
K-Means Algorithm
In the sales agent clustering process, k-means clustering method is used as shown in Figure 2.
Start
specify the number of clusters
specify the cluster center
specify the object distance to the cluster center
allocate each object to the nearest centroid
centroid value of the old and new changes
end
Yes
Figure2:K-Means Algorithm
Name R F M
Abang 2 1 1 Acik 5 2 1 Adhip 4 3 3 Adwar 5 3 2
Score R F M
c. Specify the distance of the object to the centroid using the formula Euclidean Distance. By the formula:
D(i,j
)=
(𝑋1𝑖 − 𝑋1𝑗)2+ 𝑋2𝑖 − 𝑋2𝑗 2+…+ 𝑋𝑘𝑖 − 𝑋𝑘𝑗 2d. Allocate each object based on the closest centroid. Having obtained the distance of each data against centroid, the data is allocated based on the minimum distance to the cluster.
e. Search a new central cluster by using formula:
Ci= 𝑁𝑖 X k
𝑘=1
𝑁𝑖
f. Back to step 2 until there is no object to be removed.
In this case, the testing is performed by using Rapid Miner software in generating clusters. The next step is profiling on each cluster. Profiling is performed by calculating the average RFM value of each cluster compared to the overall average. Figure 3 shows the results obtained by the extraction of cluster models.
Figure3:Cluster model
The last centroid values are shown in Figure 4.
The comparison between centroid of each cluster and the average of overall clusters is shown in Table 5.
Table5:Comparison between centroid averageandaverage of overall clusters
Cluster R F M Total
cluster_0 4.487179 1.153846 1.051282 39 cluster_1 2.5 3 3 2 cluster_2 4.625 2.75 2.4375 16 cluster_3 1 1 1 15 cluster_4 4.333333 1 3 3 cluster_5 2 1 1 27 cluster_6 5 4.727273 3.818182 11 cluster_7 3 1.047619 1 21
Overall
average 3.368189 1.959842 2.03837
The following figure presents the RFM values for each cluster.
Figure5:Diagram of RFM Values
From Figure 5, the complete results are the following:
a. Cluster 1 is a cluster with high Recency, low Frequency and low Monetary values. Agents that belong to the cluster are still active transaction in a short span of time. However, with a lower
Frequency and Monetary (R ↑ ↓ M ↓ F) . Then the sales agent is classified as a new agent (First Time).
b. Cluster 2 is a cluster with a low Recency value, high Frequency and Monetary values. Sales agents that belong to the cluster no longer conduct transactions in a short span of time. However,it has a value that is higher Frequency and Monetary ( R M ↑ ↑ ↓ F ). Those sales agents that are classified in this cluster is an agent that has activity decreased (Churn).
c. Cluster 3 is a cluster with high Recency, Frequency and Monetary values (R M ↑ ↑ ↑ F). Agents that are included in this cluster is the best company’s agent (Best).
d.
Cluster 4 is a cluster with low Recency, Frequency and monetary values. Agents that belong to the cluster no longer conduct transactions in a short span of time. However,it has a lowfrequency value, and nominal paid too low (R F ↓ ↓ ↓ M). These
agents are then classified
in this cluster as an agent that has contributed the least to the company (Uncertain).
e. Cluster 5 is a cluster with highRecency, low Frequency, and high Monetary. Agents that areincluded in this cluster are active in transactions in short period.Although having a low
active in transactions in the short period. This has low frequency, as well as the paid nominal value (R F ↓ ↓ ↓ M). These agents are then classified in this cluster as an agent that has contributed the least to the company (Uncertain).
g. Cluster 7 is almost the same as cluster 3, a cluster with high Recency, Frequency and Monetary values (R M ↑ ↑ ↑ F). Agents that are included in this cluster is the best company’s agent (Best).
h. Cluster 8 is similar to clusters 4 and 6. This clusterhas lowerRecency, Frequency, and Monetary values. Agents that are included in this cluster is no longer active in transactions in the short period. This cluster has low frequency, as well as the paid nominal value (R F ↓ ↓ ↓ M). The agents belong to this cluster is an agent that has contributed the least to the company (Uncertain).
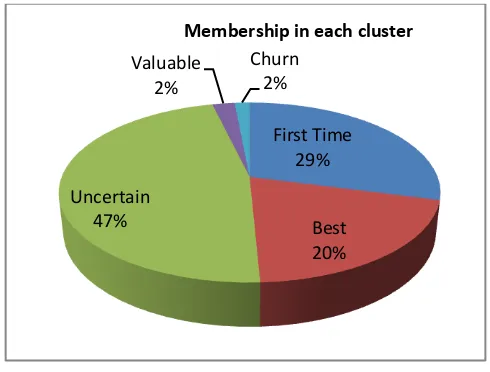
Overall, having acquired the characteristics of each cluster, five different segment of agents are obtained, namely: the best agent (Best), an agent which has a high value for the company (Valuable), an agent with a contribution of at least (Uncertain), agents that has decrease transaction (Churn) and a new agent (First Time). Figure 6shows a diagram of a membership percentage for each segment.
Figure 6:Diagram of cluster (segment) membership
4.
Conclusion
This paper has presented
classification of sales agent for cement distribution using k-means clustering.From the results of the implementation and testing that has been done Using
Rapid Miner tool, it can be concluded that the compan
y’s agents
dominated by sales
agents with the Uncertain characteristics. The 47% of agents in PT. XYZ, Ltd is an agent
that has contributed very low. They no longer carry out the transaction in the near future.
These agents are rarely bought and paid nominal value too low. The company owns 20 %
of the best agents, they carry out transactions on a regular basis until today with high
nominal amount. In addition, there are 2 % agents that have potential and high value. The
Company currently has 29 % of new agents and 2 % agent has decreased the activity.
From the testing results, it is known that the agent who occupy certain segment in the
preceding discussion also occupies the same segment in the testing phase. After getting the
knowledge, the company is expected to set a more appropriate policy.
First Time 29%
Best 20% Uncertain
47%
Valuable 2%
Churn 2%
Acknowledgement
The authors would like to thanks Universitas Putra Indonesia “YPTK” Padang for supporting this
research.
References
[1] Morwitz, V.G. and Schmittlein, D., 1992. Using segmentation to improve sales forecasts based on purchase intent: Which" intenders" actually buy?.Journal of marketing research, pp.391-405.
[2] Bucklin, R.E., Gupta, S. and Siddarth, S., 1998. Determining segmentation in sales response across consumer purchase behaviors. journal of Marketing Research, pp.189-197.
[3] Jiawei,H, Micheline, K dan Jian, “Data Mining Concepts and Techniques”, 3rd edition P.2011.
[4] Birant, D.,“Data Mining Using RFM Analysis, Knowledge-Oriented Application in Data Mining”,
2011.
[5] Herawan, T., Deris, M.M. and Abawajy, J.H., 2010. A rough set approach for selecting clustering attribute. Knowledge-Based Systems, 23(3), pp.220-231.
[6] Herawan, T. and Deris, M.M., 2011. A soft set approach for association rules mining. Knowledge-Based Systems, 24(1), pp.186-195.
[7] Shah, H., Herawan, T., Ghazali, R., Naseem, R., Aziz, M.A. and Abawajy, J.H., 2014, November. An Improved Gbest Guided Artificial Bee Colony (IGGABC) Algorithm for Classification and Prediction Tasks. In International Conference on Neural Information Processing (pp. 559-569). Springer International Publishing.
[8] Bakar, S.Z.A., Ghazali, R., Ismail, L.H., Herawan, T. and Lasisi, A., 2014. Implementation of Modified Cuckoo Search Algorithm on Functional Link Neural Network for Climate Change Prediction via Temperature and Ozone Data. In Recent Advances on Soft Computing and Data Mining
(pp. 239-247). Springer International Publishing.
[9] Mamat, R., Herawan, T. and Deris, M.M., 2013. MAR: Maximum Attribute Relative of soft set for clustering attribute selection. Knowledge-Based Systems, 52, pp.11-20.
[10] Amini, A., Saboohi, H., Wah, T.Y. and Herawan, T., 2014. DMM-Stream: a density mini-micro clustering algorithm for evolving data streams. In Proceedings of the First International Conference on Advanced Data and Information Engineering (DaEng-2013) (pp. 675-682). Springer Singapore. [11] Qin, H., Ma, X., Zain, J.M. and Herawan, T., 2012. A novel soft set approach in selecting clustering
attribute. Knowledge-Based Systems, 36, pp.139-145.
[12] Mohd, W.M.B.W., Beg, A.H., Herawan, T., Noraziah, A. and Rabbi, K.F., 2011. Improved Parameterless K-Means: Auto-Generation Centroids and Distance Data Point Clusters. International Journal of Information Retrieval Research (IJIRR), 1(3), pp.1-14.
[13] Qin, H., Ma, X., Herawan, T. and Zain, J.M., 2012, May. An improved genetic clustering algorithm for categorical data. In Pacific-Asia Conference on Knowledge Discovery and Data Mining (pp. 100-111). Springer Berlin Heidelberg.
[14] Qin, H., Ma, X., Zain, J.M., Sulaiman, N. and Herawan, T., 2011, June. A Mean Mutual Information Based Approach for Selecting Clustering Attribute. In International Conference on Software Engineering and Computer Systems (pp. 1-15). Springer Berlin Heidelberg.
[15] Guleria, P danSood, M.,”Data Mining in Education”,The International Journal of Data Mining and Knowledge Management Process, 4(5):47-60, 2014.
[16] Joshi, A dan Kaur, R.,“Comparative Study of Various Clustering Technique in Data Mining”,The International Journal of Advanced Research in Computer Science and Software Engineering, 3(3):55-57, 2013.
[19] Pallavi and Godara, S.,“A Comparative Performance Analysis of Clustering Algorithms”,The International journal of Engineering Research and Application, 1(3):441-445, 2010.
[20] Aastha,J danRajneet, K.,“Comparative Study of Various Clustering Technique in Data Mining”,The International Journal of Advanced Research in Computer Science and Software Engineering, 3(3):55-57, 2013.
[21] Arora, A dan Vohra, R.,“Segmentation of Mobile Customer for Improving Profitability Using Data Mining Technique”,The International Journal of Computer Science and Information Technologies,
5(4)5241-5244, 2014.
[22] Golmah, V. and Mirhashemi, G., 2012. Implementing a data mining solution to customer segmentation for decayable products-a case study for a textile firm. International Journal of Database Theory and Application, 5(3), pp.73-90.
[23] Ziafat, H danShakeri, M.,“Using Data Mining Technique in Customer Segmentation”,The International Journal of Engineering Research and Application,4(3): 70-79, 2014.
[24] Silwattananusarn, T danTuamsuk, K.,“Data Mining and Its Application for Knowledge Management”,The International Journal of Data Mining and Knowledge Management Process,.2(5):13-24, 2012.
[25] R ajagopal, S.,“Customer Data Clustering Using Data Mining Technique”,The International Journal of Database Management System, 3(4):1-9, 2011.
[26] Kashwan, R.K.,“Customer Segmentation Using Clustering and Data Mining Technique”,The International Journal of Computer Theory and Engineering,5(6):856-861, 2013.
[27] Balaji, S. and Srivatsa, S.K., 2012. Customer segmentation for decision support using clustering and association rule based approaches. International Journal of Computer Science & Engineering Technology, 3(11), pp.525-529.
[28] Anshul, A danRajan, V.,“Segmentation of Mobile Customer for Improving Profitability Using Data Mining Technique”,The International Journal of Computer Science and Information Technologies, 5(4)5241-5244, 2014.
[29] Vahid, G danGolsa, M.,“Implementing a Data Mining Solution to Customer Segmentation for Decayable Product”,The International Journal of Database Theory and Application, 5(3):73-89,
2012.
[30] Chen, Y.L., Kuo, M.H., Wu, S.Y. and Tang, K., 2009. Discovering recency, frequency, and monetary
(RFM) sequential patterns from customers’ purchasing data. Electronic Commerce Research and Applications, 8(5), pp.241-251.
[31] Enny,K, Ujang,S, L,Noor,YdanAsep, S., “Customer Loyality and Profitability”,The international Journal of Marketing Studies, 5(6):62-72, 2013.
[32] Herawan, T., Rose, A.N.M. and Deris, M.M., 2009. Soft set theoretic approach for dimensionality reduction. In Database Theory and Application (pp. 171-178). Springer Berlin Heidelberg.