29
CHAPTER IV
FINDINGS AND DISCUSSIONS
In this chapter, the researcher will explain the findings from the research conducted by the researcher. The results of this study are used to see the youth’s perception towards marketing and promoting the products through social media. Their perception can be either positive or negative.
4.1. Respondent Demography
As the researcher has mentioned in the previous chapter, the respondent were selected over certain criteria made by the researcher; they are >18 – 24 years old (youth) and have ever purchased a product via online. The respondents are assumed as the potential customers in Masashi Online Shop. The following table shows the demography of the respondents.
4.1.1 Gender
Table 4.1 Gender
Frequency Percent Valid Percent Cumulative Percent
Valid
male 23 35.9 35.9 35.9
female 41 64.1 64.1 100.0
Total 64 100.0 100.0
30
The table above shows that there are 35.9% male respondents and 64.1% female respondents. The result shows that shopping via online is still dominated by female respondents. It also indicates that female have a higher interest in shopping than the male.
4.1.2 Age
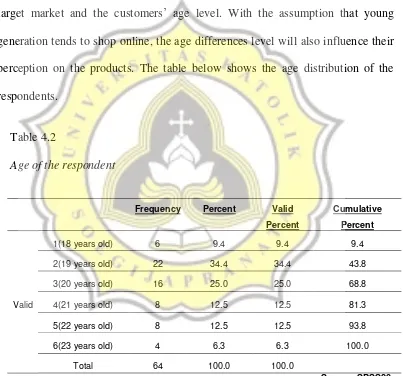
When it comes to business, it is very important for the owner to know their target market and the customers’ age level. With the assumption that young generation tends to shop online, the age differences level will also influence their perception on the products. The table below shows the age distribution of the respondents.
Table 4.2
Age of the respondent
Frequency Percent Valid Percent
Cumulative Percent
Valid
1(18 years old) 6 9.4 9.4 9.4
2(19 years old) 22 34.4 34.4 43.8
3(20 years old) 16 25.0 25.0 68.8
4(21 years old) 8 12.5 12.5 81.3
5(22 years old) 8 12.5 12.5 93.8
6(23 years old) 4 6.3 6.3 100.0
Total 64 100.0 100.0
31
Based on the result above, it can be said that out of 64 respondents who were assumed as Masashi potential customers in this research, the online purchase is dominated by those in the age of 19 – 20 years old.
4.2 Findings
The result of the respondent’s response about Masashi Online Shopping
Shop is categorized into 2 categories. If the means value is higher than 3, it can be categorized as a positive response. If the means value is lower than 3, it is categorized as a negative response. The questionnaires consist of 10
statements distributed to 64 Masashi potential respondents and this questionnaire have 5 options.
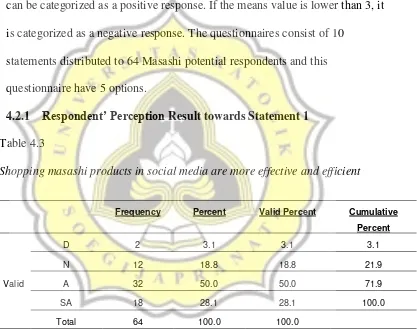
4.2.1 Respondent’ Perception Result towards Statement 1
Table 4.3
Shopping masashi products in social media are more effective and efficient
Frequency Percent Valid Percent Cumulative Percent
Valid
D 2 3.1 3.1 3.1
N 12 18.8 18.8 21.9
A 32 50.0 50.0 71.9
SA 18 28.1 28.1 100.0
Total 64 100.0 100.0
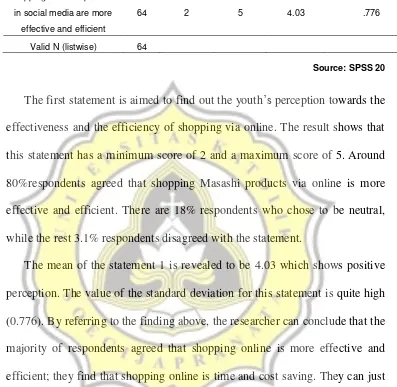
32 Table 4.3.1
Descriptive Statistics Result of Statement 1
N Minimum Maximum Mean Std. Deviation
Shopping masashi products
in social media are more
effective and efficient
64 2 5 4.03 .776
Valid N (listwise) 64
Source: SPSS 20
The first statement is aimed to find out the youth’s perception towards the effectiveness and the efficiency of shopping via online. The result shows that this statement has a minimum score of 2 and a maximum score of 5. Around 80%respondents agreed that shopping Masashi products via online is more effective and efficient. There are 18% respondents who chose to be neutral, while the rest 3.1% respondents disagreed with the statement.
The mean of the statement 1 is revealed to be 4.03 which shows positive perception. The value of the standard deviation for this statement is quite high (0.776). By referring to the finding above, the researcher can conclude that the majority of respondents agreed that shopping online is more effective and efficient; they find that shopping online is time and cost saving. They can just scroll the screen, take a look at every product and choose the products they like from Masashi official account.
33
offline store, so people who do not like to shop via online can buy the products in the store.
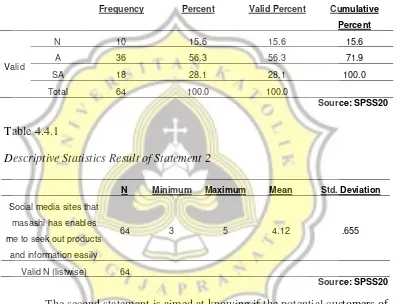
4.2.2 Respondents’ Perception Result towards Statement 2
Table 4.4
Social media sites that masashi has enables me to seek out products and
information easily
Frequency Percent Valid Percent Cumulative Percent
Descriptive Statistics Result of Statement 2
N Minimum Maximum Mean Std. Deviation
Social media sites that
masashi has enables
me to seek out products
and information easily
64 3 5 4.12 .655
Valid N (listwise) 64
Source: SPSS20
34
From table 4.4.1 above, the data shows that the mean score of statement 2 is 4.21 which refers to positive perception of the respondents. The researcher believes that almost all the respondents did not have any connection problems or any troubles while seeking the products and information from Masashi official website and Instagram.
4.2.3 Respondents’ Perception Result towards Statement 3
Table 4.5
It is easier to search information about Masashi from social media rather than
mass media
Frequency Percent Valid Percent Cumulative Percent
Descriptive Statistics Result of Statement 3
N Minimu m
Maximu m
Mean Std. Deviation
It is easier to search
35
The researcher made the third statement in order to know whether social media has an important role in many aspects including the business or not. The data shows that statement number 3 has a minimum score of 1 and a maximum score of 5. The result revealed that most respondent agreed that Internet plays an important role in many aspects. There are 29.7% respondents who chose strongly agreed and 52% respondents who are just agreed that it is easier for them to find the Masashi product information from the internet rather than from mass media. Meanwhile, 18.8% respondents chose to be neutral.
36
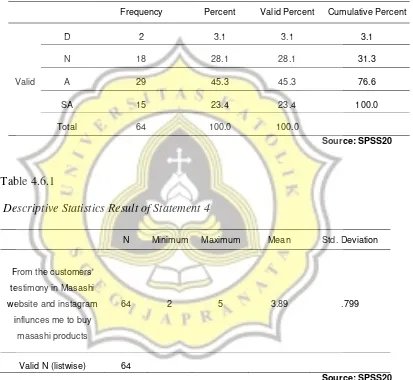
4.2.4 Respondents’ Perception Result towards Statement 4
Table 4.6
From the customers' testimony in Masashi website and instagram influnces me to
buy masashi products
Frequency Percent Valid Percent Cumulative Percent
Valid
Descriptive Statistics Result of Statement 4
N Minimum Maximum Mean Std. Deviation
37
65% respondents are interested to buy the Masashi products because they saw the customer’s testimony. Meanwhile, around 28% respondents chose
to be neutral. It means that they might buy the product depending on their perception of the products. The rest 3.1% respondents chose disagreed with the statement. They neglected the existence of customer’s testimony.
The 3.1% respondents means they are not interested to buy Masashi products since Masashi sells scarf and headband. More than 35% of respondent are male and they are not interested to buy scarf or headband or maybe some might be people who think that the testimony from the customers in Masashi official account are not trustworthy. They think that the testimony was made up by the owner of Masashi as one of the marketing strategy applied.
38
4.2.5 Respondents’ Perception Result towards Statement 5
Table 4.7
Social media provides an effective platform for me to buy scarf from masashi
Frequency Percent Valid Percent Cumulative Percent
Valid
D 2 3.1 3.1 3.1
N 16 25.0 25.0 28.1
A 25 39.1 39.1 67.2
SA 21 32.8 32.8 100.0
Total 64 100.0 100.0
Source: SPSS20
Table 4.7.1
Social media provides an effective platform for me to buy scarf from masashi
Frequency Percent Valid Percent Cumulative Percent
Valid
D 2 3.1 3.1 3.1
N 16 25.0 25.0 28.1
A 25 39.1 39.1 67.2
SA 21 32.8 32.8 100.0
Total 64 100.0 100.0
Source: SPSS20
39
products from social media. Maybe they think that buying products offline is more trustworthy that buying it online.
It could be concluded from the result obtained that most of the respondent agreed with the statement that social media provides an effective platform for the potential Masashi customer to buy the Masashi products through more than 25% respondents were not so sure whether social media can facilitate them to buy Masashi products. The mean score of statement 5 is 4.02 which indicated that it got positive perception from the respondents.
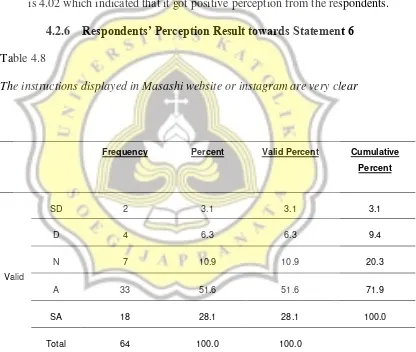
4.2.6 Respondents’ Perception Result towards Statement 6
Table 4.8
The instructions displayed in Masashi website or instagram are very clear
Frequency Percent Valid Percent Cumulative Percent
Valid
SD 2 3.1 3.1 3.1
D 4 6.3 6.3 9.4
N 7 10.9 10.9 20.3
A 33 51.6 51.6 71.9
SA 18 28.1 28.1 100.0
Total 64 100.0 100.0
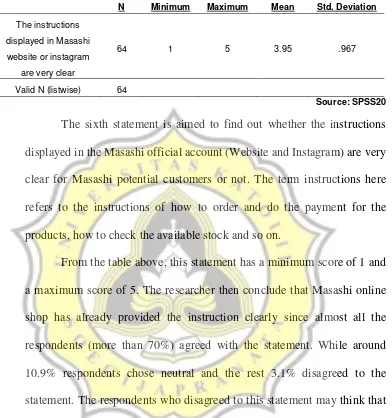
40 Table 4.8.1
Descriptive Statistics Result of Statement 6
N Minimum Maximum Mean Std. Deviation
The instructions
displayed in Masashi
website or instagram
are very clear
64 1 5 3.95 .967
Valid N (listwise) 64
Source: SPSS20
The sixth statement is aimed to find out whether the instructions displayed in the Masashi official account (Website and Instagram) are very clear for Masashi potential customers or not. The term instructions here refers to the instructions of how to order and do the payment for the products, how to check the available stock and so on.
41
4.2.7 Respondents’ Perception Result towards Statement 7
Table 4.9
The information displayed in Masashi website and instagram are easy to understand
Frequency Percent Valid Percent Cumulative Percent
Descriptive Statistics Result of Statament 7
N Minimum Maximum Mean Std. Deviation
42
From the 64 respondents, there are more than 7% respondents who gave negative answer to this statement. One possible reason why they did not agree with the statement is because they think that the information given is not clear enough. This can be a good suggestion for the owner to make the information to be more detailed. The researcher can conclude that most of the respondent agree that information in the Masashi official account is easy to understand. However, since the majority of the respondents agreed to this statement, the researcher think that maybe the information (the caption in the products picture and so on) in every picture is simple and to the point. The means score of this statement is 3.98 which is considered as a positive perception.
4.2.8 Respondents’ Perception Result towards Statement 8
Table 4.10
Masashi website and instagram provide accurate information about the product
Frequency Percent Valid Percent Cumulative Percent
Valid
D 3 4.7 4.7 4.7
N 9 14.1 14.1 18.8
A 28 43.8 43.8 62.5
SA 24 37.5 37.5 100.0
Total 64 100.0 100.0
43 Table 4.10.1
Descriptive Statistics
N Minimum Maximum Mean Std. Deviation
Masashi website and
instagram provide
accurate information
about the product
64 2 5 4.14 .833
Valid N (listwise) 64
Source: SPSS20
Based on the data analysis result, statement 8 has a minimum score of 2 and a maximum score of 5. The standard deviation for this statement is quite high. There are 37.5% respondents who are strongly agreed with the statement. 43.8% respondents just agreed to the statement. Meanwhile, the 14.1% respondents chose neutral and the rest 4.7% respondents did not agreed with the statement above.
44
4.2.9 Respondents’ Perception Result towards Statement 9
Table 4.11
The Masashi website and instagram have interesting look
Frequency Percent Valid Percent Cumulative Percent
Descriptive Statistics Result of Statement 9
45
This statement has a minimum score of 1 and a maximum score of 5. There are 31.3% respondents who strongly agreed and 51.6% respondent agreed with the statement above. Also, more than 10% respondents chose to be neutral and the other 6.3% respondents chose to disagreed. Meanwhile, the rest 1% of the total respondents chose to strongly disagreed. Maybe the reason why they did not agree with the statement is because they did not find that Masashi official account has an attractive look. The feeds or the theme of the website might be too boring and not creative enough for them. Nevertheless, more than 80% respondents agreed with the statement. The total mean score of this statement is 4.08 and the value of standard deviation for this statement is quite high (0.822) which indicated that this statement has a positive perception from the respondents.
4.2.10 Respondents’ Perception Result towards Statement 10.
Table 4.12
I like the look of Masashi website and instagram
Frequency Percent Valid Percent Cumulative Percent
Valid
D 4 6.3 6.3 6.3
N 7 10.9 10.9 17.2
A 30 46.9 46.9 64.1
SA 23 35.9 35.9 100.0
Total 64 100.0 100.0
46 Table 4.12.1
Descriptive Statistics Result of Statement 10
N Minimum Maximum Mean Std. Deviation
I like the look of Masashi
website and instagram 64 2 5 4.13 .845
Valid N (listwise) 64
Source: SPSS20
Statement 10 aims at finding out whether the Masashi website look and the Instagram feeds can be well received by the potential customers or the Masashi customers or not. Based on the data analysis result, statement number 10 has a maximum score of 5 and a minimum score of 2. More than 35% respondents strongly agreed to the statement and they have an interest to the look of Masashi official account. Meanwhile, around 46% respondents agreed with the statement, 10.9% respondents chose neutral. Another 6.3% respondents of this research chose disagreed. The respondents who did not agree with the statement might not be interested with Masashi official account’s look. They might think that the design of
the website of Masashi is not attractive enough for them.
47 4.3 Overall Discussion
Based on the research that the researcher has conducted in the Faculty of Language and Arts, Soegijapranata Catholic University in May to April 2018, the results showed that the respondents in this research who were assumed as Masashi potential customers have positive perception towards the use of social media as marketing tool at Masashi online shop. The researcher found that the statement number 4 has the lowest mean score in this research. Meanwhile statement number 10 has the highest mean score in this research. The following table describes the mean score obtained from each statement in this research:
Table 4.13
to seek out products and
information easily
64 3 5 4.12 .655
It is easier to search
48
I like the look of masashi
website and instagram 64 2 5 4.13 .845
Valid N (listwise) 64
Source: SPSS20
49
important role while people especially youth choose to shop via online. The 10 statements show the positive response of the respondents. It means that marketing the products or services through social media nowadays give a lot of positive effects both for the buyers and the sellers especially for the Masashi customers or the potential customers.