Summary Climatic effects on annual net carbon gain, stem biomass and annual transpiration were simulated for Pinus radiata D. Don at Canberra and Mt. Gambier. Simulations were conducted with an existing process-based forest growth model (BIOMASS, Model 1) and with a modified version of the BIOMASS model (Model 2) in which response functions for carbon assimilation and leaf conductance were replaced with those derived from field gas exchange data collected at Mt. Gambier.
Simulated carbon gain was compared with a published re-port stating that mean annual stem volume increment (MAI) at Mt. Gambier was 1.8 times greater than at Canberra and that the difference could be the result solely of differences in climate. Regional differences in climate resulted in a 20% greater simulated annual transpiration at Canberra than at Mt. Gambier but only small differences in simulated productivity, indicating that climatic differences did not account for the reported differences in productivity. With Model 1, simulated annual net carbon gain and annual increase in stem biomass were greater at Canberra than at Mt. Gambier, whereas Model 2 indicated a similar annual net carbon gain and annual stem biomass increase in both regions.
Keywords: carbon gain, simulation model, stem growth.
Introduction
Primary productivity and biomass gain of a plant or an ecosys-tem vary with the availability of resources and the charac-teristics of the environment (e.g., Smith and Hinckley 1995a, 1995b). Changes in climate can cause changes in productivity, and sometimes alter the geographic range over which a species can grow (e.g., Barlow and Conroy 1988, Booth and McMur-trie 1988).
The productivity of Pinus radiata D. Don can be manipu-lated silviculturally by operations that alter resource availabil-ity (e.g., Sheriff 1995a). However, the responses of primary productivity and biomass gain to silvicultural manipulation depend on constraints imposed by the environment. Thus, to predict these responses in different environments requires de-tailed information on the effects of environmental variables on the underlying processes that govern productivity.
Nambiar (1995) reported that stem volume growth of P. ra-diata increases 1.8 times as fast in trees located near Mt. Gambier (southeastern South Australia) than in trees located in other parts of southern Australia receiving similar amounts of rainfall, and hypothesized that the difference results from ac-cess to aquifer water at Mt. Gambier (see Teskey and Sheriff 1996). An alternative hypothesis is that the difference is a result of differences in humidity and temperature of the two regions (Sheriff and Mattay 1995). To distinguish between these hypotheses, we estimated net carbon assimilation (ACO2) and transpiration (E) for the two regions with the BIOMASS model (McMurtrie et al. 1990a, McMurtrie and Landsberg 1992), and with a modified version of the BIOMASS model in which the functions for the responses of ACO2 and leaf conduc-tance (gl) to humidity and temperature were replaced with those derived by Sheriff (1995).
Materials and methods BIOMASS----Model 1
The BIOMASS model predicts crop yield through a dynamic, process-based simulation of net canopy carbon assimilation and transpiration (McMurtrie et al. 1990b, 1992). Rates of carbon assimilation and transpiration were calculated on a daily basis using meteorological variables, soil water charac-teristics and stand conditions at the beginning of the simulation period as model inputs.
BIOMASS----Model 2
In Model 1, ACO2 and gl decline linearly as the leaf to air vapor pressure gradient, considered here to be the same as atmos-pheric vapor pressure deficit (vpd), increases beyond a thresh-old value. In addition, both ACO2 and gl are quadratic functions of temperature when other variables are constant, and are reduced by overnight subzero temperatures. However, partial regression coefficients of a multiple nonlinear analysis of field gas exchange data (Sheriff 1995) indicate that net ACO2 and gl of P. radiata decline exponentially with increasing vpd and that their variation with temperature follows quadratic rela-tionships but with different parameters to those used in Model 1. The forms of these relationships for responses to vpd
Modeling productivity and transpiration of
Pinus radiata
: climatic
effects
D. W. SHERIFF,
1J. P. MATTAY
1and R. E. M
CMURTRIE
21
Plantation Forest Research Center, Division of Forestry, CSIRO, P.O. Box 946, Mount Gambier, SA 5290, Australia 2 School of Biological Science, University of New South Wales, Sydney, NSW 2052, Australia
Received March 2, 1995 Tree Physiology 16, 183--186
are:
ACO2=k1e−kDD, (1)
gl=k2kd/(kd+D). (2)
The forms of these relationships for responses to temperature are:
ACO2=k3(1 −kT(Tl−TM) 2)
, (3)
gl=k4(1 −kt(Tl−Tm)2). (4)
where k1, k2, k3 and k4 are multipliers whose values depend on effects of other variables on ACO2 or gl; kD, kT, kt and kd are parameters, D is ambient vpd, Tl is leaf temperature, and TM and Tm are statistically derived temperature ‘‘optima’’ for ACO2 and gl. Responses to temperature are such that gl increases with temperature to a maximum at about 32 °C and then declines, whereas at ambient temperatures, net ACO2 increases almost linearly with temperature.
Simulations
Weather data used for the simulations were collected by the Australian Bureau of Meteorology stations at Canberra and Mt. Gambier during the 10 years from January 1, 1984, until December 31, 1993 (Table 1). For each simulation it was assumed that soil characteristics and foliar nutrition in the two regions were the same and that stand conditions were the same at the beginning of the simulation. Leaf area index (LAI) was specified as an input to the model; projected LAI increased from 3 to 4.5 at both sites during the simulations.
Regional effects
To examine the relative effects of incident light, temperature, vpd and rainfall on net ACO2 and E at the two locations, model estimates were recalculated when each weather variable was swapped, in turn, between regions. Because vapor pressure deficit depends on the absolute humidity of the air and on its temperature, the vpd and temperature variables were swapped together.
Results and discussion Simulations
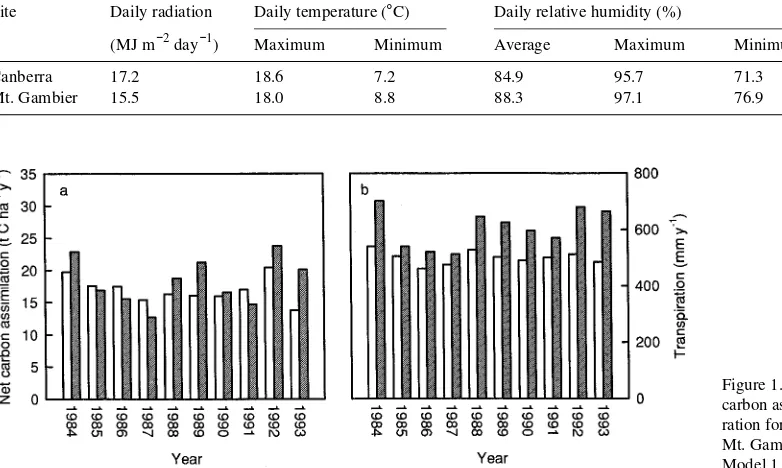
Both versions of the BIOMASS model indicated considerable year to year variation in carbon gain (Figures 1a and 2a). Variations were caused by changes in all weather variables, with different variables contributing differently in different years. The generally greater carbon gain predicted by the modified Model 2 than by the unmodified Model 1 probably resulted from its greater sensitivity to adverse environmental conditions, especially dry air. Transpiration also varied be-tween years (Figures 1b and 2b), but there was less difference between years than for carbon assimilation. Altering model response had little effect on transpiration, partly because both models are water-limited, and most water input to the soil is lost by evapotranspiration during the same year. There were only small differences between the two versions of the model in patterns of carbon gain or stem biomass increase (Table 2).
Regional effects
The most obvious differences between simulated values for the two regions were the relatively small variations in yearly values for transpiration and greater assimilatory transpiration
Table 1. Ten-year means of weather values used for simulations.
Site Daily radiation Daily temperature (°C) Daily relative humidity (%) Annual rainfall
(MJ m−2 day−1) Maximum Minimum Average Maximum Minimum (mm year−1)
Canberra 17.2 18.6 7.2 84.9 95.7 71.3 669.4
Mt. Gambier 15.5 18.0 8.8 88.3 97.1 76.9 708.2
Figure 1. Simulated (a) annual net carbon assimilation and (b) transpi-ration for Canberra (shaded) and Mt. Gambier (unshaded) by Model 1.
efficiency (ATE = assimilation/transpiration) at Mt. Gambier. This site had an ATE about 18% greater for the data as a whole and about 20--26% greater for annual transpiration rates at Mt. Gambier. The higher water use efficiency at Mt. Gambier than at Canberra is largely a result of lower vpds, and to some extent lower average radiation, both of which lessen evaporative demand.
Site differences were greater for Model 2 simulations than for Model 1 simulations. (cf. Figures 1 and 2). Averaged over 10 years, output from the unmodified Model 1 predicted slightly greater net carbon assimilation and stem biomass increase at Canberra than at Mt. Gambier (Table 2). The
modi-fied Model 2 also indicated only small differences in net carbon assimilation and stem biomass increase, but it showed a slightly greater net carbon assimilation at Mt. Gambier than at Canberra. Both models predicted about 20% greater transpi-ration at Canberra than at Mt. Gambier as a result of differ-ences in interception loss, reflecting fewer periods of heavy rain at Canberra compared with Mt. Gambier.
Swapping weather variables
Simulations run with weather variables swapped between Can-berra and Mt. Gambier indicated that regional differences in climate can result in different simulated values for productivity and transpiration. The unmodified BIOMASS model predicted larger effects of swapping weather variables between the two regions on net carbon assimilation, stem biomass and transpi-ration than the modified BIOMASS model (Table 3). Output from the unmodified BIOMASS model indicated that both radiation and rainfall at Canberra contributed to the greater carbon gain and stem biomass increment in simulations for that region. However, these effects were offset by the effects of temperature and relative humidity at Canberra which were less favorable for carbon gain than at Mt. Gambier (Table 3). All of the Canberra weather variables contributed to the high transpi-ration rates simulated at Canberra. The modified BIOMASS model produced a similar result, but the Mt. Gambier radiation values were, on average, more favorable for net carbon assimi-Figure 2. Simulated (a) annual net carbon assimilation and (b) tran-spiration for Canberra (shaded) and Mt. Gambier (unshaded) by Model 2.
Table 2. Estimated annual net carbon assimilation (Mg C ha−1 year−1), stem biomass increase (Mg C ha−1 year−1) and transpiration (mm year−1) in the Canberra and Mt. Gambier regions. Values are means ± SE calculated over 10-year periods with Models 1 and 2.
Model Carbon Stem biomass Transpiration assimilation
Canberra
Model 1 18.3 ± 1.2 14.2 ± 1.0 606 ± 22 Model 2 25.6 ± 1.7 19.8 ± 1.4 612 ± 22
Mt. Gambier
Model 1 17.0 ± 0.6 12.6 ± 0.5 500 ± 7 Model 2 26.3 ± 1.1 19.7 ± 0.9 517 ± 10
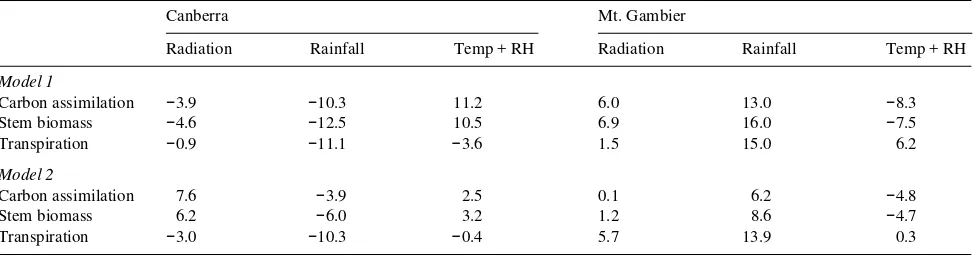
Table 3. Effects on simulated annual net carbon assimilation, stem biomass increase and rainfall of swapping radiation, rainfall or temperature and humidity values between the weather data files for Canberra and Mt. Gambier. The effects are shown as the percentage change in the value of the simulated variable after the weather variable was swapped.
Canberra Mt. Gambier
Radiation Rainfall Temp + RH Radiation Rainfall Temp + RH
Model 1
Carbon assimilation −3.9 −10.3 11.2 6.0 13.0 −8.3
Stem biomass −4.6 −12.5 10.5 6.9 16.0 −7.5
Transpiration −0.9 −11.1 −3.6 1.5 15.0 6.2
Model 2
Carbon assimilation 7.6 −3.9 2.5 0.1 6.2 −4.8
Stem biomass 6.2 −6.0 3.2 1.2 8.6 −4.7
Transpiration −3.0 −10.3 −0.4 5.7 13.9 0.3
lation and stem biomass increase than the Canberra radiation values.
Conclusions
The simulated results were not consistent with the finding of Nambiar (1995) that P. radiata is more productive at Mt. Gambier than at Canberra, or with the hypothesis of Sheriff and Mattay (1995) that differences in climate between Mt. Gambier and Canberra would be expected to cause an 8% higher annual net carbon assimilation at Mt. Gambier. Simu-lated carbon gain values averaged about 1.4% more at Can-berra than at Mt. Gambier; however, a simulated 20% higher annual transpiration at Canberra is consistent with Sheriff and Mattay’s (1995) estimate of 19% greater annual transpiration at Canberra.
Acknowledgments
We thank Miko Kirschbaum and Peter Snowdon for their helpful comments on the paper. Weather data used in the simulations were provided by the National Climate Center, Australian Bureau of Mete-orology, Melbourne, Australia.
References
Barlow, E.W.R. and J. Conroy. 1988. Influence of elevated atmos-pheric carbon dioxide on the productivity of Australian forestry plantations. In Greenhouse. Planning for Climate Change. Ed. G.I. Pearman. CSIRO, Melbourne, pp 520--533.
Booth, T.H. and R.E. McMurtrie. 1988. Climate change and Pinus radiata plantations in Australia. In Greenhouse. Planning for Cli-mate Change. Ed. G.I. Pearman. CSIRO, Melbourne, pp 534--545.
McMurtrie, R.E., M.L. Benson, S. Linder, B.J. Myers, S.W. Running, T. Talsma and W.J.B. Crane. 1990a. Water--nutrient interactions affecting productivity of stands of Pinus radiata. For. Ecol. Man-age. 30:415--423.
McMurtrie, R.E., D.A. Rook and F.M. Kelliher. 1990b. Modelling the yield of Pinus radiata on a site limited by water and nitrogen. For. Ecol. Manage. 30:381--413.
McMurtrie, R.E. and J.J. Landsberg. 1992. Using a simulation model to evaluate the effects of water and nutrients on the growth and carbon partitioning of Pinus radiata. For. Ecol. Manage. 52:243--260.
McMurtrie, R.E., R. Leuning, W.A. Thompson and A.M. Wheeler. 1992. A model of canopy photosynthesis and water use incorporat-ing a mechanistic formulation of leaf CO2 exchange. For. Ecol. Manage. 52:261--278.
Nambiar, E.K.S. 1995. Relationships between water and nutrients in Australian forests: application to wood production and quality. Plant Soil 168/169:427--435.
Sheriff, D.W. 1996. Gas exchange of field-grown Pinus radiata----re-lationships with foliar nutrition and water potential, and with cli-matic variables Aust. J. Plant Physiol. 22:1015--1026.
Sheriff, D.W. and J.P. Mattay. 1995. Simultaneous effects of foliar nitrogen, temperature, and humidity on gas exchange of Pinus radiata. Aust. J. Plant Physiol. 22:615--626.
Smith, W.K. and T.M. Hinckley. 1995a. Resource physiology of coni-fers acquisition, allocation and utilization. Academic Press, San Diego, 396 p.
Smith, W.K. and T.M. Hinckley. 1995b. Ecophysiology of coniferous forests. Academic Press, San Diego, 338 p.
Teskey, R.O. and D.W. Sheriff. 1996. Water use by Pinus radiata trees in a plantation. Tree Physiol. 16:273--279.