Summary Stem maintenance respiration rates were meas-ured in five contrasting balsam fir (Abies balsamea (L.) Mill.) stands. At 15 °C, average respiration rates for individual stands ranged from 120 to 235 µmol m−3 s−1 when expressed per unit
of sapwood volume, from 0.80 to 1.80 µmol m−2 s−1 when expressed per unit of stem surface area, and from 0.50 to 1.00 µmol g−1 s−1 when expressed per unit of nitrogen in the living
stem biomass, but differences among stands were not statisti-cally significant. Coefficients of variation ranged from 50 to 100% within stands and were similar for all bases used to express respiration rates. Coefficients of determination for regressions between chamber flux and chamber values of sap-wood volume, stem surface area and nitrogen content varied between stands and no one base was consistently higher than the other bases. We conclude that the bases for expressing stem respiration are equally useful. Respiration rates were more closely correlated to stem temperature observed approximately 2 h earlier than to current stem temperature. Among stands, annual stem maintenance respiration per hectare varied from 0.1 to 0.4 Mmol ha−1 year−1, primarily because of large differ-ences in sapwood volumes per hectare. Annual stem mainte-nance respiration per unit of leaf area ranged from 3 to 6 mol m−2 year−1, increasing as sapwood volume per hectare in-creased.
Keywords: Abies balsamea, woody-tissue respiration, mainte-nance respiration, temperature responses, carbon balance.
Introduction
Estimates of maintenance respiration are required to complete carbon budgets for studies of forest responses to climate change (Ryan 1991a). Measurements made in chambers over short time periods are frequently scaled up to provide estimates of annual stem respiration per hectare (Kinerson 1975, Linder and Troeng 1980, Ryan and Waring 1992, Ryan et al. 1994, 1995). However, the reliability of such estimates of annual maintenance respiration per hectare depends on the accuracy of both the methodology used to separate maintenance respi-ration from growth respirespi-ration and the techniques used to scale to the stand level measurements obtained during short intervals
from small parts of tree components in chambers. Although much work has been done to resolve these methodological difficulties (Sprugel and Benecke 1991, Sprugel et al. 1995), considerable uncertainty remains.
Because the quantity of living, respiring stem tissue in chambers or ecosystems exists amid dead tissues, it can only be measured by indirect methods. Selection of the appropriate indirect measure is important for scaling up from the chamber to the ecosystem level, and for extrapolating estimates for a particular ecosystem from measurements made in another eco-system. Although stem surface area has frequently been used as an index of the amount of living stem tissue in a chamber or ecosystem (Kinerson 1975, Linder and Troeng 1980, 1981, Lavigne 1987, 1988, Matyssek and Schulze 1988), Ryan (1990) and Sprugel (1990) have argued that sapwood volume is a better index of the amount of living tissue in chambers and ecosystems than stem surface area (see also Sprugel and Benecke 1991, Ryan and Waring 1992, Ryan et al. 1994, 1995, Sprugel et al. 1995). A third basis for describing living biomass, nitrogen content, is also used as an index of the amount of living stem tissue (Ryan 1991b, 1995, Ryan et al. 1995). The argument for using N content is that it should be highly correlated with protein or enzyme content (Amthor 1989, Ryan 1991a).
Relationships between chamber measurements of respira-tion rate per second and stem temperature are used to estimate respiration over longer time intervals. Records of temperature are then used with these relationships to estimate respiration for periods when measurements were not made and for ecosys-tems that were not measured. Ryan et al. (1995) observed that stem respiration rates correlated more closely with stem tem-peratures measured up to 3 h earlier than to current tempera-tures, suggesting that a lag in the response of stem respiration to temperature could substantially influence estimates of stand respiration.
Few studies have directly compared the respiration of dis-similar stands. Ryan and Waring (1992) compared stem respi-ration and growth of three lodgepole pine (Pinus contorta Dougl. ex Loud.) stands representing a chronosequence. Ryan et al. (1995) compared respiration rates of four conifer stands growing in contrasting climates. In the present study, we
meas-Estimating stem maintenance respiration rates of dissimilar balsam fir
stands
M. B. LAVIGNE,
1S. E. FRANKLIN
2and E. R. HUNT, JR.
31
Canadian Forest Service - Maritimes Region, Natural Resources Canada, P.O. Box 4000, Fredericton, N.B. E3B 5P7, Canada 2
Department. of Geography, University of Calgary, Calgary, AB T2N 1N4, Canada 3
Department of Botany, University of Wyoming, Laramie, Wyoming 82071-3165, USA
Received September 12, 1995
ured stem respiration in five balsam fir (Abies balsamea (L.) Mill.) stands representing wide ranges of living woody biomass, age, and past history and compared the estimates on the bases of stem surface area, sapwood volume, and N con-tent. We also evaluated the significance of lagged temperature responses of stem respiration for extrapolating over time inter-vals from hours to years.
Materials and methods
Stand descriptions
Respiration was measured in four balsam fir stands in western Newfoundland during October 1992, and in one balsam fir stand in New Brunswick during October 1993. We cruised stands and destructively sampled trees to estimate structural characteristics and growth rates of the Newfoundland stands. Some of these data have been reported by Franklin et al. (1994). Diameter at breast height (DBH), total height, crown length, and sapwood, bark and current-year ring widths were measured at five to ten prism points per stand after the growing season. Number of trees per hectare by diameter class, and mean diameter increment, sapwood cross-sectional area and total height for each diameter class were estimated for each stand.
Forty-four balsam fir trees, ranging in height from 1.5 to 20 m and in DBH from 1 to 32 cm, were destructively sampled. Diameter at breast height, total height, crown length, fresh weights of crown thirds and the stem, and sapwood widths at breast height and the base of the live crown were measured in the field. Two sample branches per crown third and stem disks were taken to the laboratory for measurements of dry weights and projected leaf areas. Equations using sapwood cross-sec-tional area at breast height to predict leaf area and oven-dry branch weight were fit with these data (Lavigne et al. 1996). An equation using DBH and total height to estimate stem dry weight was also fit.
These predictive equations were used with the cruising re-sults to estimate leaf area index (LAI), sapwood volume per hectare, and biomass per hectare of stem, branches and foliage at the beginning and end of the growing season, and annual growth was estimated by difference. Diameter at breast height
at the beginning of the growing season was estimated by subtracting twice the 1993 ring width from measured DBH.
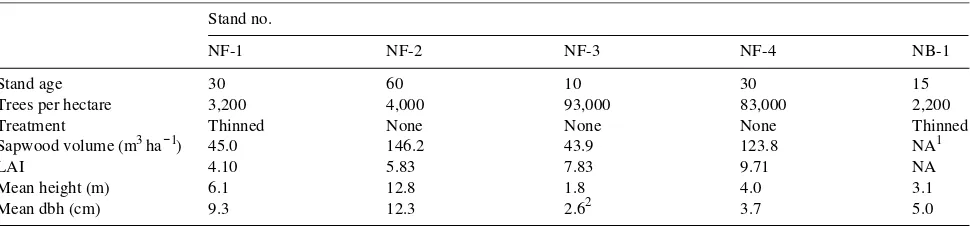
Diameter at breast height and height of all trees in a 900-m2 plot had been measured in the New Brunswick stand (D.A. MacLean, pers. comm.). Data relating to leaf areas were not available for these trees. Mensurational and ecological charac-teristics of the five stands are summarized in Table 1. The stands represent a wide range of stand ages, stand density, living woody biomass, and leaf area index. Two of the stands had been thinned. The 30-year-old unthinned stand NF-4 was adjacent to the 30-year-old thinned stand NF-1.
Respiration measurements
Carbon dioxide concentration of air was measured with an infrared gas analyzer (LI-5252, Li-Cor, Inc., Lincoln, NE). The air flow system comprised four pumps, four mass flow meters (Li-Cor, Inc.), and four banks of solenoids. The solenoids were controlled by a data logger (CR-10, Campbell Scientific Inc., Chatham, Ontario). Tubing directed air from the energized solenoids to 16 respiration chambers. Air was pumped through each respiration chamber for 20 min at a rate of 1--2 l min−1; during the last 5 min the air was directed to the gas analyzer and, during the last minute, the readings from the gas analyzer were averaged and recorded by the data logger. A complete measurement cycle took 105 min, and included four tests of the zero calibration and one test of the span calibration of the gas analyzer. Stem temperature inside the respiration chamber was measured with a copper-constantan thermocouple inserted un-der the bark into the cambial region.
Respiration chambers were made from acrylic tubes and closed-cell neoprene. A chamber that completely encircled the tree was used when the diameter of the stem was less than 7 cm. The diameter of the acrylic tube was about 3 cm greater than the diameter of the stem. A section of tubing, 10--25 cm long, was cut in half lengthwise. Neoprene, 2.5 cm thick and 2.5 cm wide, was glued to the inside wall at the ends of the tube. Strips of 0.3-cm thick neoprene were glued to the cut edges of one side of the chamber. Hose clamps were used to attach the respiration chamber to the stem. Small amounts of silicone grease were used to ensure airtight seals between the neoprene and the bark. Chambers that enclosed one side of the bole were used on larger stems. These chambers were cut from
Table 1. Characteristics of four Abies balsamea stands in Newfoundland and one in New Brunswick where respiration rates were measured.
Stand no.
NF-1 NF-2 NF-3 NF-4 NB-1
Stand age 30 60 10 30 15
Trees per hectare 3,200 4,000 93,000 83,000 2,200
Treatment Thinned None None None Thinned
Sapwood volume (m3 ha−1) 45.0 146.2 43.9 123.8 NA1
LAI 4.10 5.83 7.83 9.71 NA
Mean height (m) 6.1 12.8 1.8 4.0 3.1
Mean dbh (cm) 9.3 12.3 2.62 3.7 5.0
1 Not available.
17.5--22.5-cm diameter acrylic tubes. Neoprene was glued to the inside wall of the chamber perimeter.
Respiration measurements were made during 4-day periods in October at each site (Table 2). We assumed that, because the cambium of balsam fir is quiescent in October (Sundberg et al. 1987, Mellerowicz et al. 1989), no stem growth occurred while measurements were being made; that is, only stem mainte-nance respiration was occurring.
Carbon dioxide efflux rates were recorded at least 40 times for each chamber. The observations for each chamber were evenly distributed throughout each day of the sampling period. At three of the four Newfoundland sites, two chambers were placed on each of eight trees, one near breast height and one near the middle of the crown. At stand NF-3, one chamber was placed on each of 16 trees because the trees were too small to install two chambers per tree. Chambers were installed near breast height on 16 trees at the New Brunswick site. Chambers that developed large leaks during the measurement period were excluded from the analyses. Leaks were identified by measur-ing air flow rates entermeasur-ing and leavmeasur-ing chambers with rotame-ters. To minimize the correlation between tree size and growth rate, trees, chamber locations and stands were chosen to in-clude a wide a range of stem sizes and growth rates.
The amount of stem surface area enclosed was measured while the chamber was attached to the stem. Stem diameters were measured and increment cores were extracted from the enclosed part of the stem after the chambers were removed. Sapwood, current-year ring, and bark widths were measured on the increment cores and used to estimate sapwood volume and stem volume growth beneath the stem surface enclosed in chambers. At the Newfoundland sites, a second core was collected to determine nitrogen content. Kjeldahl N of com-bined sapwood, cambial zone, and phloem tissues was deter-mined for a sample of known dry weight.
The relationship between temperature and stem respiration rate was expressed as (Lavigne 1987, Sprugel and Benecke 1991, Sprugel et al. 1995):
R = R15Q10((T− 15)/10), (1)
where R is respiration per unit of living stem tissue per second, R15 is respiration rate at 15 °C, Q10 is the ratio of respiration
rate at some temperature and the respiration rate at 10 °C greater than that temperature, and T is temperature (°C). A linear form of Equation 1 was obtained by logarithmic trans-formation:
ln(R) =b0 + b1((T − 15)/10), (2)
where b0 is ln(R15) and b1 is ln(Q10). Values of b0 and b1 were
estimated by simple linear regression using the GLM proce-dure of SAS for Windows v6.08 (SAS Institute, Inc., Cary, NC). Equation 2 was fitted for each chamber using stem surface area, sapwood volume, and nitrogen content as the bases for expressing respiration rate. Using sapwood volume to express respiration rates, we fitted Equation 2 for current temperatures, and temperatures observed during the previous measurement cycle, for all observations, and separately for observations made during daylight hours and at night. Hourly air temperatures recorded at Deer Lake Airport were used with Equation 1 to estimate annual maintenance respiration rate for each chamber (cf. Amthor 1989, Sprugel and Benecke 1991, Ryan and Waring 1992, Ryan et al. 1995).
Simple correlation analyses were used to test for relation-ships between chamber measurements and chamber attributes. We also regressed chamber flux rates against chamber values for sapwood volume, stem surface area and N content, and compared goodness of fit statistics. Coefficients of determina-tion (R2) was estimated according to Kvalseth (1985) when regression lines were forced through the origin. For each chamber, a paired t-test was used to compare R15 per unit of
sapwood volume (R15(V)) based on current and previous stem
temperatures. A paired t-test was also used to compare the daytime (0600--1800 h) and nighttime estimates of R15(V) for
each chamber. Differences between stands in respiration rates and morphometric attributes of chambers were compared by one-way analysis of variance followed by Student-Newman-Keuls multiple comparison tests when appropriate.
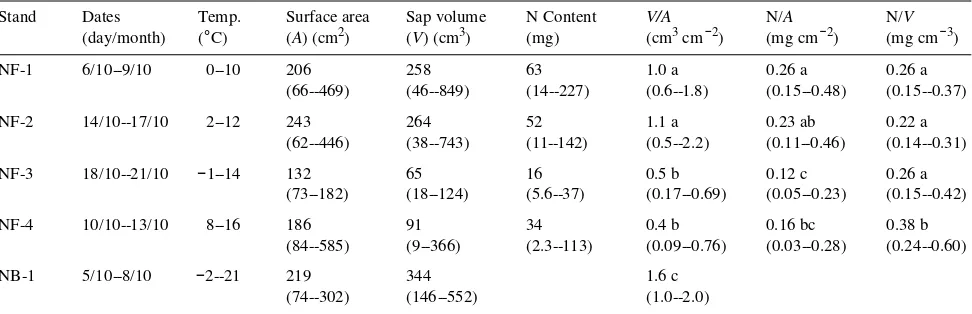
Table 2. Characteristics of the respiration chambers. Values in columns that are followed by the same letter were not statistically different (P < 0.05) based on the Student-Newman-Keuls multiple comparison method.
Stand Dates Temp. Surface area Sap volume N Content V/A N/A N/V
(day/month) (°C) (A) (cm2) (V) (cm3) (mg) (cm3 cm−2) (mg cm−2) (mg cm−3)
NF-1 6/10--9/10 0--10 206 258 63 1.0 a 0.26 a 0.26 a
(66--469) (46--849) (14--227) (0.6--1.8) (0.15--0.48) (0.15--0.37)
NF-2 14/10--17/10 2--12 243 264 52 1.1 a 0.23 ab 0.22 a
(62--446) (38--743) (11--142) (0.5--2.2) (0.11--0.46) (0.14--0.31)
NF-3 18/10--21/10 −1--14 132 65 16 0.5 b 0.12 c 0.26 a
(73--182) (18--124) (5.6--37) (0.17--0.69) (0.05--0.23) (0.15--0.42)
NF-4 10/10--13/10 8--16 186 91 34 0.4 b 0.16 bc 0.38 b
(84--585) (9--366) (2.3--113) (0.09--0.76) (0.03--0.28) (0.24--0.60)
NB-1 5/10--8/10 −2--21 219 344 1.6 c
Results
Lagged responses to temperature
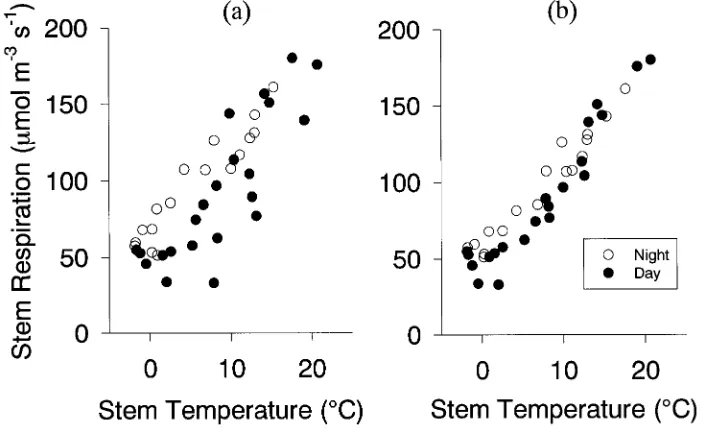
At any temperature, respiration rates were lower during the day than during the night (Figure 1a). This hysteresis was not apparent when stem respiration per unit of sapwood volume was plotted against the stem temperature 1.75 h earlier (prior temperature) (Figure 1b). For 50 of 70 chambers, R2 was higher when respiration was regressed against prior stem tem-perature than when respiration was regressed against current temperature (cf. Figures 1a and 1b). On average, for the 70 chambers, R2 was 6% higher when prior temperature rather than current temperature was the independent variable, and the differences in precision were statistically significant (P < 0.01). Despite increased precision, estimates of R15(V)
based on prior stem temperature did not differ statistically from those based on current stem temperature (P = 0.64). The mean R15(V) based on prior temperature was 151.4 µmol m−3 s−1
compared with 149.9 µmol m−3 s−1 based on current stem
temperature. Values of Q10 estimated from prior stem
tempera-ture were not statistically different from those estimated from current stem temperature (P = 0.30).
When respiration rate was regressed against current tem-perature, the mean R15(V) at night was 18% greater than the
mean R15(V) during the day (168 versus 142 µmol m−3 s−1) and
the difference was highly significant (P < 0.001). When respi-ration was regressed against prior stem temperature, the mean R15(V) at night was not significantly different (P = 0.41) from
the mean R15(V) during the day (155 versus 150.6 µmol m−3 s−1).
Comparing bases for expressing respiration rates
Variances as a percentage of the mean (coefficients of vari-ation) were similar for all bases for expressing stem respiration rates (Table 3). Mean R15 values were not significantly
differ-ent between stands when expressed per unit of stem surface
Figure 1. Relationship between stem temperature (°C) and stem maintenance respiration rate per unit of sapwood volume (µmol m−3 s−1) in a chamber in the New Brunswick stand: (a) stem tem-perature measured concurrently with respiration, and (b) stem temperature observed 1.75 h ear-lier than respiration was meas-ured.
Table 3. Comparison of stem surface area (A), sapwood volume (V) and nitrogen content of living stem biomass (N) as the basis for expressing stem maintenance respiration rates for balsam fir stands sampled in Newfoundland and New Brunswick. Responsiveness of respiration to temperature (Q10) for each stand is also compared.
Stand no.
NF-1 NF-2 NF-3 NF-4 NB-1
Sample size 14 14 11 14 16
R15(A) (µmol m−2 s−1) 1.45 1.29 1.08 0.81 1.78
Coefficient of variation (A) 96 59 84 65 50
R15(V) (µmol m−3 s−1) 141.9 153.1 234.4 204.3 120.2
Coefficient of variation (V) 90 78 72 66 70
R15(N) (µmol mg(N)−1 s−1) 0.51 0.70 0.72 0.97 NA1
Coefficient of variation (N) 73 76 53 97 NA
Q10 2.09 2.48 2.28 1.96 1.96
Coefficient of variation (Q10) 18 21 18 25 13
(P = 0.08), per unit of sapwood volume (P = 0.14) or per unit weight of nitrogen (P = 0.31).
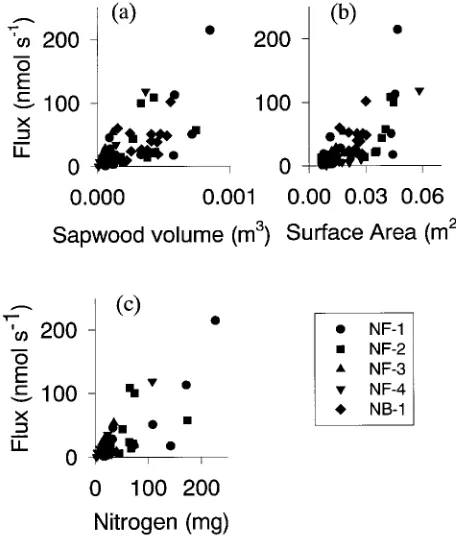
The intercepts of relationships involving chamber flux were not significantly different from zero when sapwood volume per chamber (P = 0.57) or stem nitrogen (P = 0.86) was the independent variable, but the intercept was significantly differ-ent from zero (P = 0.03) for stem surface area (Figure 2). Coefficients of determination for relationships predicting chamber flux from sapwood volume, stem surface and N content varied among stands, and no one basis for expressing respiration had consistently higher R2 than the other bases (Table 4).
Chamber values of sapwood volume, stem surface area and nitrogen content were highly intercorrelated when compared for each stand separately and for all data combined; most correlation coefficients exceeded 0.95 and all were highly significant (P < 0.01). The R15 estimated for the three bases
were highly correlated to each other (Table 5).
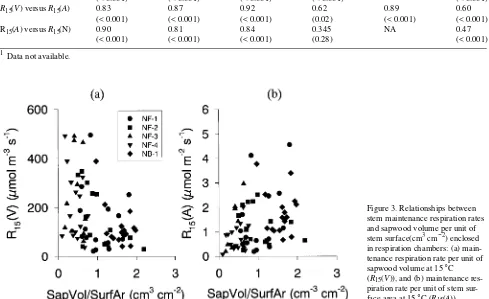
The use of ratios between sapwood volume, stem surface area and stem nitrogen content to evaluate specific respiration rates reduced the influence of the correlations among these bases. There was a significant negative correlation between R15(V) and sapwood volume per unit of stem surface (V/A;
r = −0.41, P < 0.001) (Figure 3a). There was a significant positive correlation between R15(A) and V/A (r = 0.33,
P < 0.01) (Figure 3b). The V/A ratio differed significantly (P < 0.01) between stands; the ratio was greatest for stand NB-1 and least for the high density stands (Table 2). The R15(N) was not significantly correlated to N per unit stem
surface area (N/A) (r = −0.25, P = 0.07) (Figure 4a). The N/A ratio differed significantly (P < 0.001) among stands (Table 2); it was lower in the high density stands (NF-3, NF-4) than in the low density stands (NF-1, NF-2) (Table 2). The R15(N) was not
significantly correlated to N per unit of sapwood volume (N/V) (r = 0.14, P = 0.3) (Figure 4b). The N/V ratio differed signifi-cantly (P < 0.001) between stands (Table 2).
Comparing stand respiration rates
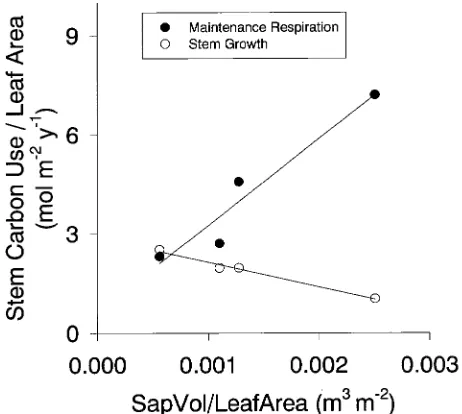
Annual stem maintenance respiration per hectare increased significantly (r = 0.96, P = 0.04) with sapwood volume per hectare (Figure 5). Sapwood volume per hectare and LAI (Table 1) were not correlated (r = 0.31, P = 0.70). Annual stem maintenance respiration per unit of leaf area increased signifi-cantly (r = 0.94, P = 0.06) as sapwood volume per unit of leaf area increased, whereas the stem growth per unit of leaf area decreased but not significantly (r = −0.79, P = 0.21) (Figure 6). Sapwood volume per unit of leaf area was not correlated to LAI (r = −0.25, P = 0.75).
Discussion
Lagged respiration responses to temperature
Ryan et al. (1995) reported that stem respiration of four conifer stands growing in contrasting climates exhibited lagged sponses to stem temperature and we observed a similar re-sponse in balsam fir. The lagged rere-sponses of stem respiration to temperature are likely a result of the large resistance to movement of CO2 from stem to air (Eklund and Lavigne 1995)
that requires a large increase in internal concentration before an increased rate of diffusion from the stem can occur. The concentration of CO2 inside stems is 10--30 times greater than
ambient air (Eklund 1990) and, therefore, large concentration gradients exist to drive CO2 diffusion. If the volume of air
inside stems is large relative to the diffusion rate then it takes time for the internal concentration to increase sufficiently to drive CO2 diffusion at a higher rate when temperature rises.
Alternative explanations for the lagged response include the possibility that (1) temperatures measured a short distance beneath the bark, as in this study, may not be representative of temperatures experienced by most of the respiring biomass Figure 2. Chamber flux at 15 °C plotted against (a) sapwood volume
enclosed in chamber, (b) surface area inside chamber, and (c) stem nitrogen beneath chamber.
Table 4. Coefficients of determination (R2) for relationships between chamber flux at 15 °C (nmol s−1) and sapwood volume per chamber, stem surface per chamber and stem nitrogen content beneath the chamber for each stand and for all stands combined.
Stand Sapwood volume Stem surface area Stem nitrogen
(Derby and Gates 1966), (2) some CO2 produced by respiration
moved vertically in the transpiration stream rather than mov-ing laterally to the atmosphere durmov-ing daylight, but not at night (Martin et al. 1994), or (3) bark photosynthesis reduced the rate of CO2 efflux during daylight (Benecke 1985).
The finding that respiration rates have a lagged response to stem temperature is especially important when measurements cannot be collected for both daytime and nighttime. If meas-urements were only made during the day and the respiration lag were not taken into account, then the resulting equations would underestimate nighttime respiration rates by approxi-mately 20%, and estimates of stem respiration for longer periods would substantially underestimate actual respiration.
Comparing bases for expressing respiration
Respiration rates varied by similar amounts within stands for all bases used to express respiration rates (Tables 3 and 4, Figure 2), indicating that no base is superior to the others.
Ryan (1990) and Sprugel (1990) found that differences in sapwood volume per chamber explained much of the variation in chamber flux values. Our analysis of the relationship
be-tween R15(A) and V/A (Figure 3a) yielded similar results (cf.
Ryan 1990, Sprugel 1990); however, we also observed a rela-tionship between R15(V) and V/A (Figure 3b). Because the V/A
ratio was high when sapwood width was wide and low when sapwood width was narrow, the positive relationship between R15(A) and V/A can be explained by the presence of more living
stem tissues beneath the stem surface when V/A is high than when V/A is low (Ryan 1990, Sprugel 1990). The negative relationship between R15(V) and V/A is more difficult to
ex-plain, but it may reflect a negative relationship between R15(V)
and sapwood width because the phloem, cambial zone and outer sapwood had higher maintenance respiration per unit of volume than the inner sapwood, and these stem components comprise a larger fraction of the total sapwood volume in samples with a narrow sapwood than in samples with a wide sapwood. The V/A ratio varied significantly among stands (Table 2), and the stand average for R15(V) (Table 3) tended to
be higher for stands with lower V/A. This trend suggests the need for caution when using sapwood volume to estimate stand-level stem maintenance respiration rates, especially when chamber measurements are made in stands dissimilar to those for which estimates are required.
Table 5. Simple correlation coefficients, and associated P-values in brackets, describing relationships between respiration rate at 15 °C per sapwood volume (R15(V)), stem surface area (R15(A)), and milligram of nitrogen (R15(N)) for four balsam fir stands in Newfoundland and one stand in New
Brunswick.
Stand no.
NF-1 NF-2 NF-3 NF-4 NB-1 All
R15(V) versus R15(N) 0.93 0.92 0.98 0.86 NA1 0.85
(< 0.001) (< 0.001) (< 0.001) (< 0.001) (< 0.001)
R15(V) versus R15(A) 0.83 0.87 0.92 0.62 0.89 0.60
(< 0.001) (< 0.001) (< 0.001) (0.02) (< 0.001) (< 0.001)
R15(A) versus R15(N) 0.90 0.81 0.84 0.345 NA 0.47
(< 0.001) (< 0.001) (< 0.001) (0.28) (< 0.001)
1 Data not available.
Stem nitrogen content could be more useful than sapwood volume and stem surface area for scaling chamber measure-ments to stand-level estimates, and for estimating stem main-tenance respiration in stands that are dissimilar from those where chamber measurements are made because R15(N) was
not significantly correlated to N/A or N/V (Figure 4), and only the very young stand had an N content per unit of sapwood volume that was significantly different from the other stands.
Comparing stand respiration
Rates of stem growth per unit of leaf area, often referred to as growth efficiency (Waring 1983), were approximately 2 mol m−2 year−1 for all stands, whereas stem maintenance respira-tion per unit leaf area increased approximately twofold over the observed range of sapwood volume per unit of leaf area (Figure 6). Stem growth uses approximately 2--5% of photo-synthetic production (Waring and Schlesinger 1985). There-fore, based on the values in Figure 6, stem maintenance respiration used 2--5% of photosynthetic production in stands Figure 4. Relationships between stem maintenance respiration rate per unit of nitrogen at 15 °C (R15(N)) and
characteristics of chambers: (a) nitro-gen content per unit of enclosed stem surface area (N/A), and (b) nitrogen per unit of sapwood volume (N/V).
Figure 5. Relationship between annual stem maintenance respiration per hectare and stem sapwood volume per hectare for four balsam fir stands in Newfoundland.
with low sapwood volume per unit of leaf area and 4--10% of photosynthetic production in stands with high sapwood vol-ume per unit of leaf area. Because neither LAI nor stand age were correlated with sapwood volume per unit of leaf area, they probably did not influence the relationship between main-tenance respiration and sapwood volume per unit of leaf area. These results suggest that the fraction of photosynthesis used for stem maintenance depends on the size of the sink relative to the size of the source.
The balsam fir stands used more carbon for annual stem maintenance respiration per hectare than the conifer stands measured by Ryan and Waring (1992), and Ryan et al. (1995). Respiration rates reported for Abies amabilis (Dougl.) Forbes by Sprugel (1990) were also lower than those of balsam fir but they were greater than those of lodgepole pine. It is possible that we overestimated maintenance respiration because our rates per unit of sapwood volume included some growth respi-ration; however, we believe that this is unlikely.
We conclude that sapwood volume, stem surface area and nitrogen content were equally useful as a basis for expressing stem respiration rates in terms of the amount of sampling required to obtain precise estimates for stands. Rates expressed per unit of nitrogen varied least between stands. Stem respira-tion exhibits a lagged response to stem temperature that must be taken into account when collecting data and when applying predictive equations. A larger fraction of photosynthetic pro-duction appeared to be allocated to stem maintenance respira-tion in stands with a high sapwood volume per hectare than in stands with a low sapwood volume per hectare.
Acknowledgments
We thank J.G. Donnelly for constructing the respiration system and assisting in the field in Newfoundland. We thank Mario Dupéré for assistance in the field in New Brunswick and for improving the respiration system. We are grateful for the constructive criticisms by M.G. Ryan, M. Rayment, D.A. MacLean, and S.A. Martin on earlier versions. This work was supported by the Climate Change Initiative and Special S&T Opportunity Fund of the Canadian Forest Service.
References
Amthor, J.S. 1989. Respiration and crop productivity. Springer-Ver-lag, New York, 215 p.
Benecke, U. 1985. Tree respiration in steepland stands of Nothofagus truncata and Pinus radiata, Nelson, New Zealand. In Establishment and Tending of Subalpine Forest: Research and Management. Eds. H. Turner and W. Tranquillini. Eidg. Anst. forstl. Versuchswes., Berlin, 270:61--70.
Derby, R.W. and D.M. Gates. 1966. The temperature of tree trunks----calculated and observed. Am. J. Bot. 53:580--587.
Eklund, L. 1990. Endogenous levels of oxygen, carbon dioxide, and ethylene in stems of Norway spruce trees during one growing season. Trees 4:150--154.
Eklund, L. and M.B. Lavigne. 1995. Restricted lateral gas movement in Pinus strobus branches. Trees 10:83--85.
Franklin, S.E., M.B. Lavigne, B.A. Wilson and E.R. Hunt, Jr. 1994. Empirical relations between balsam fir (Abies balsamea) forest stand conditions and ERS-1 SAR data in western Newfoundland. Can. J. Remote Sens. 20:124--130.
Kinerson, R.S. 1975. Relationships between plant surface area and respiration in loblolly pine. J. Appl. Ecol. 12:965--971.
Kvalseth, T.O. 1985. Cautionary note about R2. Am. Stat. 39:279--285. Lavigne, M.B. 1987. Differences in stem respiration responses to temperature between balsam fir trees in thinned and unthinned stands. Tree Physiol. 3:225--233.
Lavigne, M.B. 1988. Stem growth and respiration of young balsam fir trees in thinned and unthinned stands. Can. J. For. Res. 18:483--489. Lavigne, M.B., J.E. Luther, S.E. Franklin and E.R. Hunt, Jr. 1996.
Comparing branch biomass prediction equations for Abies bal-samea. Can. J. For. Res. 26:611--616.
Linder, S. and E. Troeng. 1980. Photosynthesis and transpiration of 20-year-old Scots pine. In Structure and Function of Northern Coniferous Forests----An Ecosystem Study. Ed. T. Persson. Ecol. Bull. (Stockholm) 32:165--181.
Linder, S. and E. Troeng. 1981. The seasonal variation in stem and coarse root respiration of a 20-year-old Scots pine (Pinus sylvestris L.). Mitt. Forstl. Bundesversuchsanst. 142:125--139.
Martin, T.A., R.O. Teskey and P.M. Dougherty. 1994. Movement of respiratory CO2 in stems of loblolly pine (Pinus taeda L.) seedlings.
Tree Physiol. 14:481--495.
Matyssek, R. and E.-D. Schulze. 1988. Carbon uptake and respiration in above-ground parts of a Larix decidua × leptolepis tree. Trees 2:233--241.
Mellerowicz, E.J., R.T. Riding and C.H.A. Little. 1989. Genomic variability in the vascular cambium of Abies balsamea. Can. J. Bot. 67:990--996.
Ryan, M.G. 1990. Growth and maintenance respiration in stems of Pinus contorta and Picea engelmannii. Can. J. For. Res. 20:48--57. Ryan, M.G. 1991a. Effects of climate change on plant respiration.
Ecol. Appl. 1:157--167.
Ryan, M.G. 1991b. A simple method for estimating gross carbon budgets for vegetation in forest ecosystems. Tree Physiol. 9:255--266.
Ryan, M.G. 1995. Foliar maintenance respiration of subalpine and boreal trees and shrubs in relation to nitrogen content. Plant, Cell Environ. 18:765--772.
Ryan, M.G. and R.H. Waring. 1992. Maintenance respiration and stand development in a young subalpine lodgepole pine forest. Ecology 73:2100--2108.
Ryan, M.G., R.M. Hubbard, D.A. Clark and R.L. Sanford, Jr. 1994. Woody-tissue respiration for Simarouba amara and Minquartia guianensis, two tropical wet forest trees with different growth habits. Oecologia 100:213--220.
Ryan, M.G., S.T. Gower, R.M. Hubbard, R.H. Waring, H.L. Gholz, W.P. Cropper and S.W. Running. 1995. Woody tissue maintenance respiration of four conifers in contrasting climates. Oecologia 101:133--140.
Sundberg, B., C.H.A. Little, R.T. Riding and G. Sandberg. 1987. Levels of endogenous indole-3-acetic acid in the vascular cambium region of Abies balsamea trees during the activity--rest--quiescence transition. Physiol. Plant. 71:163--170.
Sprugel, D.G. 1990. Components of woody-tissue respiration in young Abies amabalis (Dougl.) Forbes trees. Trees 4:88--98. Sprugel, D.G. and U. Benecke. 1991. Measuring woody-tissue
respi-ration and photosynthesis. In Techniques and Approaches in Forest Tree Ecophysiology. Eds. J.P. Lassoie and T.M. Hinckley. CRC Press, Boca Raton, pp 329--355.
Waring, R.H. 1983. Estimating forest growth and efficiency in relation to canopy leaf area. Adv. Ecol. Res. 13:327--354.