122 Journal of Buffalo Science, 2012, 1, 122-125
ISSN: 1927-5196 / E-ISSN:1927-520X/12 © 2012 Lifescience Global
Effect of Year, Season and Parity on Milk Production Traits in
Murrah Buffaloes
Hitesh N. Pawar
1, G.V.P.P.S. Ravi Kumar*
,2and Raman Narang
31
School of Animal Biotechnology, GADVASU, Ludhiana-141004 Punjab, India 2
Animal Biotechnology, Indian Veterinary Research Institute, Izatnagar, Bareilly, Uttar Pradesh, India 3
Department of Animal Genetics and Breeding, GADVASU, Ludhiana 141004, Punjab, India
Abstract: The objective of this study was to find out the effects of year, season and parity on milk production traits i.e. total lactation milk yield (TLMY), 305 day milk yield (305d MY) and average fat percentage etc. in Murrah buffaloes under organized herd. Records of 515 Murrah buffaloes maintained at Guru Angad Dev Veterinary and Animal Sciences University (GADVASU), Ludhiana, Punjab (India) during the period of 2004-2008 were used. Average TLMY, 305d MY and fat percentage were recorded to be 2229.87± 93.7 kg, 2147.6 ± 87.06 kg and 7.12 ±0.11%. The TLMY was found to be significantly affected by season (P≤0.05) but not by year and parity. The highest milk yield was obtained in buffaloes calving in winter followed by rainy and summer. Milk yield of buffaloes in winter was significantly higher than that of animals in summer (P≤0.05). The TLMY increased over the years with highest milk yield in the year 2006 (2345.1±99.32kg). Similar results were obtained for 305d MY, where only the season was found significant (P≤0.05). The average fat percentage was significantly (P≤0.05) affected by year and season. Milk fat percentage of buffaloes calved in winter was significantly (P≤0.05) higher than that of calved in summer. Similarly milk fat percentage varied significantly among the parities with no consistent increase over the advancement of the parities. In this study season was found to have a significant effect on 305MY and fat % but not on the total lactation milk yield.
Keywords: Murrah buffalo, year, season, parity, total lactation milk yield, 305 day milk yield.
INTRODUCTION
Buffalo is the major dairy animal in India, contributing approximately 56% of the total milk produced in the country [1]. Buffaloes having high capacity to face adverse environmental conditions and a remarkable longevity (up to 10 years production period). Among the established breeds of buffalo in India, the Murrah breed originated in the valleys of Rohtak and its surrounding area of the Haryana province. This breed has now spread over all parts. Murrah buffaloes performed far better than local and crossbred cattle, indicating its adaptation to various environmental conditions. The variation in milk production is a regular phenomenon in all milking animals, broadly the factors which are responsible for such variations can be divided into 1) Physiological, which will be governed by the genetically make up and 2) Environmental, such as age, number of previous lactations, pregnancy, season of calving, calving interval and nutrition status [2]. The season of calving has got a marked effect on the total production.
In order to enhance productivity of a dairy animal, it is necessary to develop an understanding of the factors affecting its milk production and composition. Milk yield and fat percentage, two important parameters in dairy
*Address corresponding to this author at the Animal Biotechnology, Indian Veterinary Research Institute, Izatnagar, Bareilly, Uttar Pradesh, India; Tel: +91-0581-2304475; Fax: +91-0581-2303284; E-mail: [email protected]
animals, depend on both genetic and non-genetic factors. Genetic improvement may be done by
selection. The non-genetic factors such as
management, amount and quality of feed, season etc. also influence milk yield and lactation length, and need to be assessed in a production set up. Analysis of five year data of Nili-Ravi buffaloes maintained at dairy farm in the home tract of the breed has shown that factors affecting milk yield in buffaloes are almost similar to those of cattle including: year, season, herd, parity, days in milk, days open, age and sire [3].
The objective of the present study was to evaluate the effects of year, season and parity on total lactation milk yield, 305 day milk yield and fat percentage in Murrah buffaloes.
MATERIALS AND METHODS
Source of Data
Effect of Year, Season and Parity on Milk Production Traits Journal of Buffalo Science, 2012 Vol. 1, No. 1 123
Breeding Stock
As per the technical program of the project, a herd of about 300 buffaloes is being maintained for progeny testing program. So in order to have required strength and genetic variability, the buffaloes were purchased from breeding tract of Murrah, mainly from Rohatak, various animal fares of Punjab and outstanding animals of the individual farmers. Selection and purchasing of the animals were exclusively based on the criteria fixed by Indian Council of Agricultural Research (ICAR) for this project, i.e. on the basis of milk yield of three successive milking, breed characteristics, and shape and udder quality characteristics. Once the herd strength was attained, only a few outstanding animals were purchased from time to time. All the female calves born at the farm were retained till they complete their first lactation.
General Practices at the Farm
The animals were maintained under loose housing system. Buffaloes are milked twice daily by hand as groups, year, season and parity.
Methodology
The study was based on 515 records of Murrah buffaloes. Only the existing animals in different parities and different stage of lactation throughout 2004-08 years were taken. Milk yield of the animals with abnormal lactation due to abortions, mortality, sale of animals etc. were included only if the buffaloes produce milk for minimum of 150 days. Those animals which environmental conditions over a period of 5 years. The buffaloes were reared under the standard husbandary practices of the farm. Missing or abnormal records
were deleted from data. To study the effect of year of calving, season of calving and parity on production traits, viz., total milk production, 305d milk production and fat percentage the following model was used
yijkl = µ + si + pk + lj + eijkl
Since the number of observations in each sub-class was unequal and disproportionate, the data were analysed by LSML91 version package of Harvey, 1990. The analysis of variance was carried out by model 1 of Harvey [4], which had the facility to adjust simultaneously for significant fixed by computing different components of variance. To obtain the constants for environmental effects, left hand side consisted of matrices of frequencies in different
subclasses arranged in an m × n symmetrical matrix.
The right hand side was the sum of dependent variable for each subclass. The matrices were reduced to obtain a set of independent equations by imposing restrictions. The reduced matrix was inverted. The inverse elements were multiplied with right hand members to obtain the least square constants for all the levels of fixed effects.
RESULTS AND DISCUSSION
The results obtained from the analyses and relevant discussions pertaining to the results are presented under different headings.
Total Lactation Milk Yield (TLMY)
The total lactation milk yield (TLMY) was found to
be significantly affected by season (P≤0.05) but not by
year and parity (Table 1). The highest milk yield was
obtained in animals calving in winter season followed by rainy and summer season. Milk yield of buffaloes in winter was significantly higher than that of animals in
summer (P≤0.05). However, difference between
124 Journal of Buffalo Science, 2012 Vol. 1, No. 1 Pawar et al.
season produced 86.4kg less milk than those calved in rainy season and 206.4kg less than those calved in winter season. Available reports [5,6] agree with our findings that the TLMY of the buffaloes calving in winter is higher than in other seasons. Similarly total lactation milk yield increased over the first three years with highest milk yield in the year 2006 (2345.1±99.32kg) (Table 2).
There was no consistent increase or decrease with the advance in years there on which may be due to the environmental variation in different years. However the differences between years were not significant
(P≥0.05). There was evident increase of milk yield from
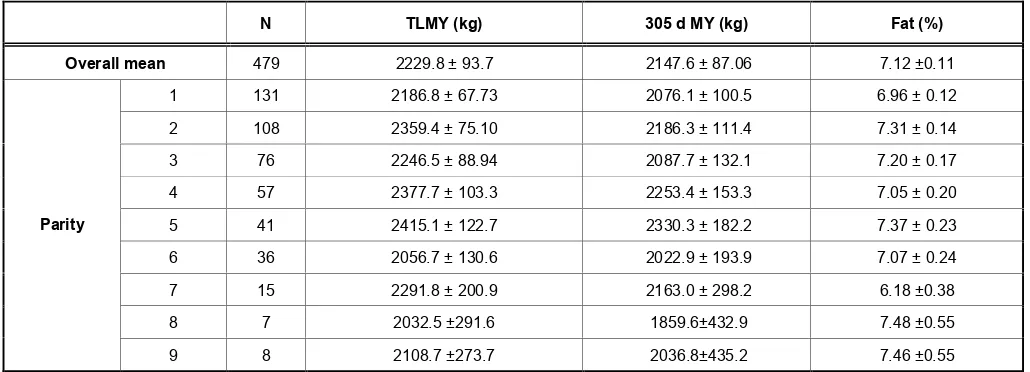
the first fifth parity (Table 3). This is in agreement with
Anderson [7] who reported that production of cow reaches the peak around fifth parity, when animal is seven to eight years old and gains to adult body size. Therefore, increase in production is caused by maturation and increase in body weight and mammary gland. Mammary gland grows and develops parallel to growing, maturation and recurring pregnancies and lactations [7]. Earlier report [8] showed that cows of the same age but different parity have different production, and that differences are particularly evident for the first
and second parity. In the present model the R2 value
for total lactation milk yield was found to be 0.038.
305-Days Milk Yield (305d MY)
Similar results were obtained for 305-days milk yield
(305d MY) (P≤0.05) (Table 1). Buffaloes calved in the
summer season produced 178.8kg less milk than those calved in rainy and 398.7kg less than those calved in winter season. These results corroborate with the
results of Akcay et al. [9] where the cows calved in the
winter season produced 312.9 kg more milk than the cows calving in summer. The decrease in milk yield might be because of high environmental temperature and humidity during summer.
Similarly 305d milk yield increased over the first three periods with highest milk yield in the year 2006
followed by year 2005 and year 2004 (Table 2). There
was no consistent increase or decrease there on. Similarly 305d milk yield varied among the parities from
the first to the second, fourth and fifth parity (Table 3).
The highest 305d milk yield was observed in animals in fifth parity with no consistent increase or decrease over the advancement of the parities [10, 11]. On the other hand findings of other workers [6,12] are contradictory with the results of present study. The variation might be due to the difference in the breeds, herds, size of data sets, methods of estimation, the level of productivity and even the periods of time for
this particular trait. The present model the R2 value for
305 days milk yield was found to be 0.031.
Average Fat Percentage
The average fat percentage was significantly
(P≤0.05) affected by year (Table 2) and season (Table
1). The fat percentage during summer was 0.26 per
Table 1: Effect of Season on Milk Production Traits in Murrah Buffaloes
N TLMY (kg) 305 d MY (kg) Fat (%)
Overallmean 479 2229.8 ± 93.7 2147.6 ± 87.06 7.12 ± 0.11
Summer 169 2132.2 ± 75.15a 1951.6 ± 125.9 a 6.85 ± 0.14a
Rainy 184 2218.6 ± 72.48ab 2107.5 ± 114.1ab 7.11 ± 0.14ab Season
Winter 126 2338.6 ± 84.04b 2300.6 ± 108.3b 7.40 ± 0.16b
Where, N= total number of records, TLMY= total lactation milk yield, 305d MY= 305 day milk yield.
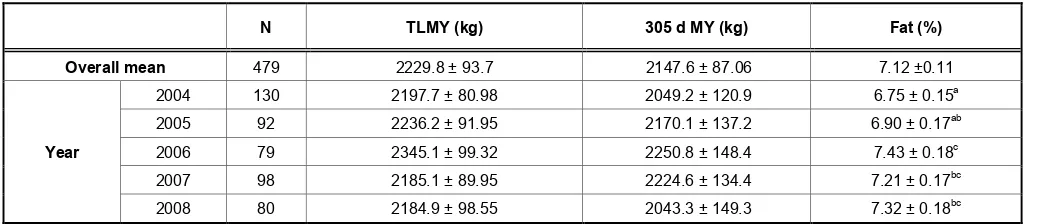
Table 2: Effect of Year on Milk Production Traits in Murrah Buffaloes
N TLMY (kg) 305 d MY (kg) Fat (%)
Overall mean 479 2229.8 ± 93.7 2147.6 ± 87.06 7.12 ±0.11
2004 130 2197.7 ± 80.98 2049.2 ± 120.9 6.75 ± 0.15a
2005 92 2236.2 ± 91.95 2170.1 ± 137.2 6.90 ± 0.17ab
2006 79 2345.1 ± 99.32 2250.8 ± 148.4 7.43 ± 0.18c
2007 98 2185.1 ± 89.95 2224.6 ± 134.4 7.21 ± 0.17bc
Year
2008 80 2184.9 ± 98.55 2043.3 ± 149.3 7.32 ± 0.18bc
Effect of Year, Season and Parity on Milk Production Traits Journal of Buffalo Science, 2012 Vol. 1, No. 1 125
cent less than that during rainy season. Milk fat percentage of buffaloes calved in winter season was
significantly (P≤0.05) higher than that of the animals
calved in summer season, due to environmental
effects. Table 2 depicted that the average fat
percentage increased over the first three periods with highest fat percentage in the year 2006 (7.43±0.18%)
which was significantly higher (P≤0.05) than that of the
first year (6.75±0.15). Similarly the fat percentage
varied significantly among the parities (Table 3) with no
consistent increase over the advancement of the
parities [7]. In the present model R2 value for average
fat percentage was found to be 0.074.
CONCLUSION
It is concluded that total lactation milk yield and 305 day milk yield were affected by season but not by year and parity in contrast to fat percentage which is affected by year and season but not by parity. total lactation milk yield and 305 day milk yield were affected by year into season interaction but actual milk yield is not affected by year. Parity also affected total lactation milk yield, 305d milk yield and fat percentage. Negative phenotypic trend in milk yield is alarming and needs
further investigations.
ACKNOWLEDGEMENT
The authors are grateful to the Head, Department of Animal Genetics and Breeding, Dean, Post Graduate Studies and Director of Research, Guru Angad Dev
Veterinary and Animal Sciences University, Ludhiana-141004 (Punjab) India for providing funds and necessary infrastructural facilities to carry out this study.
REFERENCES
[1] F.A.O. Food and Agriculture Organization. Rome Italy, 2008; STAT database.www.fao.org.
[2] Bernabucci U, Lacetera N, Ronchi B, Nardone A. Effects of the hot. Ani Res 2002; 51: 25-3.
http://dx.doi.org/10.1051/animres:2002006
[3] Cady RA, Shah SK, Schermerhorn EC, McDowel RE. Factors affecting performance. J Dairy Sci 1983; 66: 578-86. http://dx.doi.org/10.3168/jds.S0022-0302(83)81828-1
[4] Harvey WR. User's Guide for LSMLMW. Mixed model least squares and maximum likelihood computer program. PC-Version 2. 1990 Ohio State University, Columbus, USA (Mimeograph).
[5] Bufano G, Carnicella D, De Palo P, Laudadio V, Celano G, Dario C. The effect of calving. Arch Lat Prod Ani 2006; 14(2): 60-61.
[6] Ahmad M, Hussain R, Javed K. Effect of some environmental. The J Ani Pl Sci 2001; 11(4): 147-49. [7] Anderson RR. Mammary gland. In: Lactation (Ed.: Larson, B.
L.). Ames, The Iowa State University Press 1985; p. 276.
[8] Bagnato A, Oltenacu PA. Phenotypic evaluation. J Dairy Sci 1994; 77: 874-82.
http://dx.doi.org/10.3168/jds.S0022-0302(94)77022-3
[9] Akcay H, Ilaslan M, Koc A. Effects of calving season. ADÜ Ziraat Fakültesi Dergisi 2007; 4 (1-2): 59-61.
[10] Ahmad SS, Khan MA, Ali A, Muhammad MS. Effect of some environmental. The J Ani Pl Sci 1993; 3: 110-12.
[11] Javed K, Afzal M, Ahmad M, Hussain R. Genetic studies. The J Ani Pl Sci 2001; 11(2): 48-52.
[12] Garcha DS, Dev DS. Effect of genetic. J. Dairy Foods Home Sci 1994; 13(3): 205-09.
Received on 01-01-2012 Accepted on 08-02-2012 Published on 15-03-2012
DOI: http//dx.doi.org/10.6000/1927-520X.2012.01.01.22
Table 3: Effect of Parity on Milk Production Traits in Murrah Buffaloes
N TLMY (kg) 305 d MY (kg) Fat (%)
Overall mean 479 2229.8 ± 93.7 2147.6 ± 87.06 7.12 ±0.11
1 131 2186.8 ± 67.73 2076.1 ± 100.5 6.96 ± 0.12
2 108 2359.4 ± 75.10 2186.3 ± 111.4 7.31 ± 0.14
3 76 2246.5 ± 88.94 2087.7 ± 132.1 7.20 ± 0.17
4 57 2377.7 ± 103.3 2253.4 ± 153.3 7.05 ± 0.20
5 41 2415.1 ± 122.7 2330.3 ± 182.2 7.37 ± 0.23
6 36 2056.7 ± 130.6 2022.9 ± 193.9 7.07 ± 0.24
7 15 2291.8 ± 200.9 2163.0 ± 298.2 6.18 ±0.38
8 7 2032.5 ±291.6 1859.6±432.9 7.48 ±0.55
Parity
9 8 2108.7 ±273.7 2036.8±435.2 7.46 ±0.55