FROM WATER POLLUTANTS:A CASE STUDY IN GROJOKAN SEWU
SUB-WATERSHED, KARANGANYAR DISTRICT, CENTRAL JAVA
Nining Wahyuningrum and Irfan Budi Pramono
Population growth leads to water scarcity in terms of both quality and quantity. Agricultural and urban watersheds potentially produce more pollutantsthan forested area. It is considered that forested area has potential in storing and protecting water supply in such a way that water distribution and quality can be guaranteed. The objective of the study was to determine the relationship between the percentages of forested area in a watershed with the water quality. Thestudy was conducted in 2010in GrojokanSewu Sub-watershed, Karanganyar District, Central Java. Using GIS (Geographic Information System), this sub-watershedwas divided into four sub-sub-watershedswith different percentages of forested areas. Water samples were collected in each sub-sub-watershedto find out the relationship between the forested area and the total dissolvedsolids, turbidity, sodium, nitrite, nitrate, sulfate and organic matters. The statistical analysis indicates relationships in quadratic form between sodium, nitrite, TDS, sulfate and organic matters with the percentage of forested area ( =0.99,
=0.99, =0.98, =0.95 and =0.77, respectively). The relationships are different from those of
turbidity and nitrate that have low ( =0.28 and =0.36) values. It implies that the forested area is capable to reduce sodium, nitrite, TDS, sulfate and organic matters, and thus water pollutants can be reduced by forest formation as it can filter water through retention of sediments and nutrients.
Keywords: forest, water quality, watershed, land use
1,2 1
2
2 2 2 2
2 2 2
Received : 11 February 2013, Accepted : 12 September 2013
ABSTRACT
R
R R R R
R R R
I. INTRODUCTION
Demand for water is rising rapidly in line with world's population growth. Water scarcity for drinking water as well as for agriculture is increasing. On the other hand ground water is being depleted as ecosystems are becoming
polluted and degraded (Rosegrant , 2002).The
water use is related to the consumption of the people. The water consumption of a country is defined as the volume of water needed for the production of the goods and the services consumed by the inhabitants of the country. USA appears to have an average water consumption of 2480m /cap/yr, while China has 700m /cap/yr.
et al.
3 3
The global average water consumption is 1240m /cap/yr (Hoekstra and Chapagain, 2007).
A wide range of construction and development activities can adversely affect the world's water supplies in terms of both quality and quantity. These conditions are also affected by land use formations. It is widely known that watershed hydrology depends on many factors, including land use, climate, and soil conditions. (Tong, 2002) Agricultural and urban watersheds potentially produce more pollutantsthan forested
areas.(Lenat and Crawford, 1994; Dauer ,
2000; Fisher , 2000; Wang, 2001) It maybe the
result of high concentration of fertilizers (Mattikalli and Richards, 1996) and municipal
wastes (Fisher , 2000). Moreover, conversion
of forested lands to agriculture and/or urban/ residential areas has been associated with declines in stream and lake water quality (Houlahan and
3
et al. et al.
et al.
1
2
Forestry Institute on Watershed Management, Jl. A. Yani Pabelan, Kartasura, POBOX 295, Surakarta
Findlay, 2004). Therefore, forest is expected to be effective in maintaining water quality by reducing any pollutant into the river. By intercepting rain, a forest canopy reduces the impact of heavy rainfall on the forest floor and decreases soil disturbance. Leaves and natural debris on the forest floor may slow down the rate of water runoff and trap soil washing away from surrounding fields. Consequently, it reduces soil loss which potentially brings nutrient to the stream (Zisheng
, 2011; Foltz, 2012).
Forest condition that manages to regulate water is the forest which has multilayers, such as natural forest (Tíscar and Linares, 2011) or agroforestry system (Suryanto and Putra, 2012). Natural forest which consists of trees at different stages of growth, such as seedlings, saplings, poles and mature trees creates canopy layers (Tíscar and Linares, 2011). This multilayer can also be found in agroforestry in which trees or shrubs are grown in association with agricultural crops (Suryanto and Putra, 2012). Based on that, characteristic of forested area acts as water filter and thus protects soil from erosion and surface run off (Wentai , 2011; Singh and Mishra, 2012), as well as supplies ground water discharge which provides oxygen to
the stream (Núñez ., 2006). Hairiah . (2012)
reported that forest conversion to coffee-based agroforestry initially led to a decrease in the rate of litter fall and the accumulated litter layer covering the soil, replenishment of soil organic matter (SOM), and likely related to a reduction in soil macro porosity. On sloping land, a reduction of macro porosity and soil cover will increase
overland flow and erosion (Hairiah , 2012). It
indicates that the type of trees used as shade trees to the coffee can influencedirectly the physical conditions of the soil through their rooting pattern. A combination of trees with slowly decomposing litter, that help to protect the soil surface, and trees with deep root systems that directly create macro porosity is probably the best for securing soil conditions that meet the requirements of low surface runoff and erosion rates.
Based on the important effect of forested area on water quality, the study was aimed to determine the relationship between land use type composition (the percentage of forest cover) and water quality parameters, i.e. total dissolvedsolids
et al.
et al.
et al et al
et al.
(TDS), sodium (Na), sulfate (SO ), nitrite (NO -N), nitrate (NO -N) and organic matters in a watershed. To achieve the goal of the study, observation of water quality was conducted in four sub-watersheds which have different percentagesof forested areas.
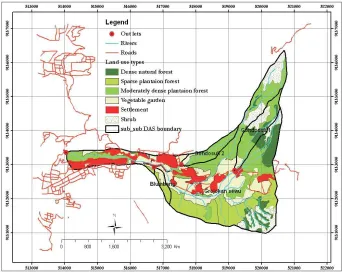
This research has been conducted in Grojokan Sewu Sub-watershed in Karanganyar District, Central Java. Geographically, which is located between 7°41'24.10''-7°37'32.48''S and 111°07'27.07''-111°07'19.01''E. Grojokan Sewu Sub-watershed was divided into four sub-sub-watersheds: Grojokan Sewu, Blumbang, Gondosuli 1 and Gondosuli 2.
GrojokanSewu Sub-watershed is dominated by undulating topography. This area was selected because there are extensive agricultural activities on steep slopes using intensive fertilizer (Prasetyo, 2013) which may lead to erosion and water pollution.
Land cover mapwas generated from Quick-Bird image of September 29, 2006 which was downloaded from Google Earth in 2010. Arc-Map 9.3 was used in image processing, such as geo referencing and digitizing. Geo referencing process utilized the coordinate system of WGS 84 based on images coordinates of Google Earth. On-screen digitizing was done by delineating similar patternsseen in the image, such as color and texture of the objects. Land cover types were divided into four types,i.e. vegetable garden, settlement, forest and shrub.
Ground checking survey was conducted in the same yearas the image downloading. Survey was based on land cover map by matching the present type in the field with the map. To determine forest density, tree measurement was conducted to obtain parameters such as tree species, diameter at breast height (DBH), tree height and number of trees in the 30 m × 30m sample plots (sample intensity was approximately 10%). These
4 2
3
II. MATERIAL AND METHOD A. Location
plotswere considered as training samplesused to complete the image classification.
Finally, land coverswere classified into six classes such as vegetable crops, settlement, sparse plantation forest, moderately dense plantation forest, dense natural forest and shrubs. Cover story and under storywere also analyzed in order to find out their effect on water filtering.
Water samples were collected in 2009 during the rainy season from each sub-subwatershed with different percentages of forested area. The samples (4 samples) were taken simultane ously. Each sample consisted of 1500 ml water and it was analyzed in the Indonesian Ministry of Health's Laboratory, Yogyakarta. Parameters analyzed were turbidity, TDS, natrium, sulfate, nitrite, nitrate and organic matters. The standard methods used were SNI 06-6989.25-2005; SNI 06-6989.1-200; APHA2012, Section 3500-Na; SNI 6989.20-2009; SNI 06-6989.9-2004; APHA 2012, Section 4500- NO and SNI 066989.22-2004, respectively. Regression method was used to develop the relationship between forested area and each water quality parameter.
C. Water sample analysis
3
III. RESULT AND DISCUSSION 1. Land cover types
Based on image analysis there were six land cover classes in the study area, i.e.vegetable crops, settlement, sparse plantation forest, moderately dense plantation forest, dense natural forest and shrubs. The distribution of land cover types is presented in Figure 1.
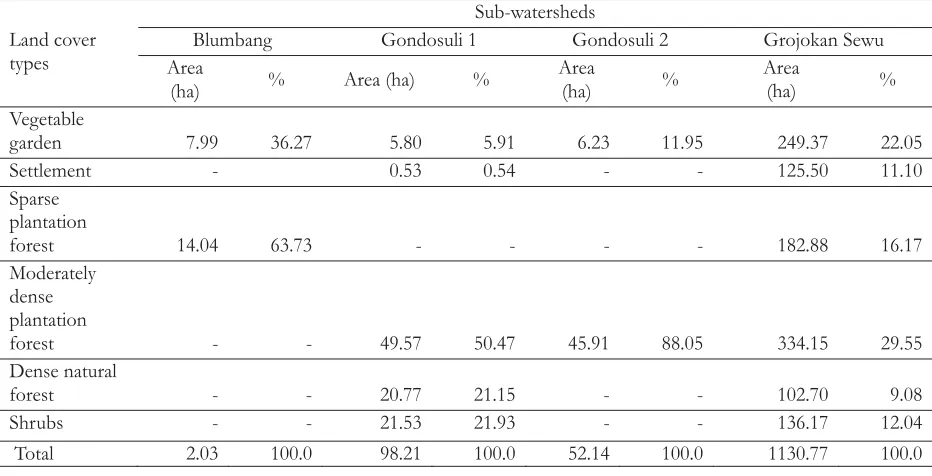
Settlements are generally situated inflat areas, while vegetable gardens, forests and shrubs are found in areas with steeper slopes, in areas with slope of more than 45%. Based on the map, Grojokan Sewu Sub-watershed is dominantly covered by forests (55%) (Table 1). Table 1 shows the percentage of forested area in each sub-watershed, namely Gondosuli 2 (88%), Gondosuli 1 (72%), Blumbang (64%) and Grojokan Sewu (55%). The forest cover type was divided into three classes based on density levels, i.e. (1) sparse plantation forest, (2) moderately dense plantation forest, and (3) dense natural forest. The forest density is influenced by the type of plant, tree density per ha, canopy closure, understory plants and diameter (Table 2)
Natural forests are densely populated by mixed
.
species of trees and shrubs. Species of shrubs
found in the area were Gleichenia linearis,
Eupatorium odoratum, Nephrolelepis falcata, Mimosa
pudica, Centotheca lappacea, Echinocloa colonum, Aristolochia tagala, Dicranopteris linearis, Cyperus rotundus, andImperata cylindrica.
Table 1. Distribution ofland cover types in each sub-watershed
Land cover types
Sub-watersheds
Blumbang Gondosuli 1 Gondosuli 2 Grojokan Sewu
Area
garden 7.99 36.27 5.80 5.91 6.23 11.95 249.37 22.05
Settlement - 0.53 0.54 - - 125.50 11.10
Sparse
forest - - 49.57 50.47 45.91 88.05 334.15 29.55
Dense natural
forest - - 20.77 21.15 - - 102.70 9.08
Shrubs - - 21.53 21.93 - - 136.17 12.04
Total 2.03 100.0 98.21 100.0 52.14 100.0 1130.77 100.0
Table 2. Forest condition and density of GrojokanSewu Sub-watershed
Land cover
675.0 9.0 182.88 16.17
Moderately
835.0 15.3 334.15 29.55
Dense natural forest
Mixed species 86.7 Uniformly
Dense
1033.3 - 102.70 9.08
2. Water quality
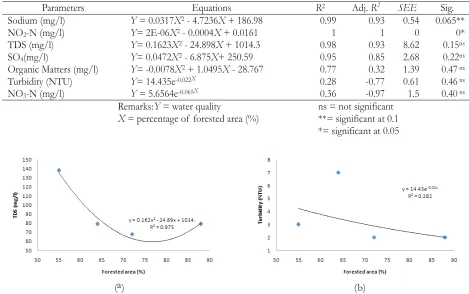
The statisticalanalysis indicatesa relationshipin quadratic form between Sodium, Nitrite, TDS, Sulfateand organic matters with the percentage of forested area whereas this relationshipis not found between turbidity and nitrate and the percentage of forested area (Table 3).
These relationships between the forested area with TDS, turbidity and other chemical materials are graphed in Figure 2 and Figure 3.
Table 3. Relationship of water quality parameters with the percentage of forested area
Parameters Equations R2 Adj.R2 SEE Sig.
Sodium (mg/l) Y= 0.0317X2- 4.7236X+ 186.98 0.99 0.93 0.54 0.065**
NO2-N (mg/l) Y= 2E-06X2- 0.0004X+ 0.0161 1 1 0 0*
TDS (mg/l) Y= 0.1623X2- 24.898X+ 1014.3 0.98 0.93 8.62 0.15ns
SO4(mg/l) Y= 0.0472X2- 6.875X+ 250.59 0.95 0.85 2.68 0.22ns
Organic Matters (mg/l) Y= -0.0078X2+ 1.0495X- 28.767 0.77 0.32 1.39 0.47ns
Turbidity (NTU) Y= 14.435e-0.022X
0.28 -0.77 0.61 0.46ns
NO3-N (mg/l) Y= 5.6564e-0.065X 0.36 -0.97 1.5 0.40ns
Remarks:Y= water quality ns = not significant X= percentage of forested area (%) **= significant at 0.1
*= significant at 0.05
area the application of inorganic fertilizers tends to deliver high concentration of nitrates. In addition the well-drained area contained the highest concentration of nitrates(Hamilton and
Helsel, 1995; Coulter , 2004). Moreover, water
from forested catchments has lower nitrates content compared to those from farmland, and residential areas(Ngoye and Machiwa, 2004)
The relationship between turbidity and forested area is similar to the research found by
Coulter (2004). They concluded that turbidity
is generally higher in the urban and mixed watersheds.Intensive agriculture in the study area by applying intensive tillage and sewage from settlement might be the source of pollutants. These pollutants are delivered to the rivers through runoff and erosion. Surface-runoff, stream flow and overland flow also increase the turbidity level of the water. Turbidity will further influence the other water quality parameters such as TDS. Tillage erosivity increases exponentially with tillage depth. Therefore reducing tillage depth can be considered as an effective soil
et al.
etal.
.
conservation strategy (Oost , 2006).
The forested area reduces pollutants by taking up nutrients and, especially in saturated riparian areas,creating conditions (anaerobic soil conditions and energy source of organic material) for de-nitrification (reduction of nitrite and nitrate to N gas). Moreover, higher nitrate-N concentrations were found in streams with adjacent forest cover (Ice and Binkley, 2003;
Messer , 2012). Forested area e.g. riparian
foresthas also a function of maintaining water quality by protecting land from runoff and erosion. Riparian forest can reduce the carbon export to water bodies and forest buffers are effective in protecting water quality and aquatic life, particularly when it is wider than 40
m(Gundersen , 2010). Furthermore, riparian
forests are highly valued for maintaining water quality through the retention of sediments and nutrients. In addition increases in land development will likely lead to greater erosion and
sediment deposition in these areas (Jolley ,
2010).
et al.
et al.
et al.
et al. 2
c
et al.
et al. et al.
Fragment size, or length and width of riparian forest and vegetation type, and fragment location in the catchment may have critical roles in enabling forest fragments to reduce the negative impacts of agriculture. The characteristics of fragments have important consequences for stream remediation. Moreover, small forest fragments can mitigate upstream agricultural
effects on water quality (Harding , 2006).
Therefore, forestry practices e.g. urban forest can be functioned as a buffer region in urbanizing watershed to protect and to improve water
quality(Matteo , 2006; Vyas , 2012). The
urban forest cover substantiallyis a benefit to water quality and water quantity at a watershed scale. It was observed that previous cover reduced the problem of nonpoint source pollution from
sediment and nutrient entering into urban watershed systems. Combining riparian and roadside buffers for urban forestry can provide substantial improvements in water quality. In addition, runoff decreased under these spatial policies, thus mitigating storm water problems. Nutrient loss is reduced through tree uptake and
reduction in sediment loading (Matteo , 2006).
Existence of forest increases precipitation and water availability. Progressive deforestation, land conversion from forest to agriculture and urbani zation has potentially negative consequences on global precipitation. Therefore, forest ecosystems are fundamental for providing and maintaining freshwater resources, maintaining human health, agricultural production and economic activity
(Ellison , 2011).
et al.
-et al.
Figure 3. Relationship of chemical materials such as natrium (a), SO4 (b), NO3-N (c) NO2-N (d) and organic matter (d) with the percentage of forested area
d
et al. et al. et al.
et al.
et al. et al.
On the other hand, forest may act also as the source of chemical elements resulting from the
decomposition of litter (Congyan , 2012) such
as lignin, Nitrate, Carbon and Phosphorus
(Mitchell , 2011; Moore , 2011). Congyan
et al. (2012) concluded that high temperature and intensive precipitation may lead to an accelerated decomposition of litter of conifer and also of broad leave forest in the tropics. Both the litter and forest floor material favor decomposition and
nutrient mineralization processes(Laganiere ,
2010). Moreover, microbial community composition also plays an important role in
decomposition (Powers , 2009; Bray ,
2012).
Based on the fact that water pollutants can be reduced by forest formation, it is recommended to build forest buffer strips for trapping nonpoint-source pollutants and protecting surface water quality(Endreny, 2002). In this regard there are three aspects that should be considered: (1)the likelihood for excess pollutant on a watershed site is a function of the land cover type or use, (2)the likeli hood for run off to leave a water shed site is a function of the size of the upslope contributing area and the slope, and (3) the likelihood for polluted runoff to enter a surface water body is a function of the opportunities for pollution filtering within the runoff dispersal area.
The percentage of forested area has relationships with Sodium, Nitrite, TDS, Sulfate and organic matters in quadratic forms. It implies that forested area may reduce Sodium, Nitrite, TDS, Sulfate and organic matters, and water pollutants can be reduced by forest formation as it can filter water through retention of sediments and nutrients.
Bray, S.R., Kitajima, K. and Mack, M.C. 2012.
Temporal dynamics of microbial
communities on decomposing leaf litter of 1 0 p l a n t s p e c i e s i n r e l a t i o n t o decomposition rate. Soil Biology & Biochemistry 49, 30-37.
IV. CONCLUSION
REFERENCES
Congyan, W., Guomin, H., Yong, J. 2012. Insight into the temperature sensitivity of forest litter decomposition and soil enzymes in subtropical forest in China. Journal of Plant Ecology 5, 279-286.
Coulter, C.B., Kolka, R.K. and Thompson, J.A. 2004. Water quality in agricultural, urban, and mixed land use watersheds. JAWRA Journal of the American Water Resources Association 40, 1593-1601.
Dauer, D.M., Ranasinghe, J.A. and Weisberg, S.B. 2000. Relationships between benthic community condition, water quality, sediment quality, nutrient loads, and land use patterns in Chesapeake Bay. Estuaries 23, 80-96.
Ellison, D., Futter, M.N. and Bishop, K. 2011. Review on the forest coverwater yield debate: from demand to supply-side thinking. Global Change Biology18, 806-820. Endreny, T.A. 2002. Mapping the Water Quality Benefits; Forest Buffer Strips. Journal of Forestry 100, 35-40.
Fisher, D.S., Steiner, J.L., Endale, D.M. 2000. The relationship of land use practices to surface water quality in the Upper Oconee Watershed of Georgia. Forest Ecology and Management 128, 38-48.
Foltz, R.B. 2012. A comparison of three erosion control mulches on decommissioned forest road corridors in the northern Rocky Mountains, United States. Journal of Soil & Water Conservation 67, 536-544.
Gundersen, P., Laure´n, A., Fine´r, L. 2010. Environmental Services Provided from Riparian Forests in the Nordic Countries. AMBIO 39, 555-566.
Hairiah, K., Suprayogo, D., Widianto. 2012.
Hamilton, P.A. and Helsel, D.R. 1995. Effects of Agriculture on Ground-Water Quality in Five Regions of the United States. Ground Water 33, 217-226.
Harding, J.S., Claassen, K. and Evers, N. 2006. Can forest fragments reset physical and water quality conditions in ag ricultural
catchments and act as refugia for forest stream invertebrates? Hydrobiologia 568, 391-402.
Hoekstra, A.Y. and Chapagain, A.K. 2007. Water footprints of nations: Water use by people as a function of their consumption pattern. Water Resources Management 21, 35-48. Houlahan, J.E. and Findlay, C.S. 2004. Estimating
the 'critical' distance at which adjacent land-use degrades wetland water and sediment quality. Landscape Ecology 19, 677-690. Ice, G. and Binkley, D. 2003. Forest Streamwater
Concentrations of Nitrog en and
Phosphorus; A Comparison with EPA's Proposed Water Quality Criteria. Journal of Forestry.
Jolley, R.L., Lockaby, B.G. and Cavalcanti, G.G. 2010. Changes in riparian forest composition along a sedimentation rate gradient. Plant Ecol 210, 317-330.
Laganiere, J., Pare, D. and Bradley, R.L. 2010. How does a tree species influence litter decomposition? Separating the relative contribution of litter quality, litter mixing, and forest floor conditions. Can. J. For. Res. 40, 465-475.
Lenat, D.R. and Crawford, J.K. 1994. Effects of land use on water quality and aquatic biota of three North Carolina Piedmont streams. Hydrobiologia 294, 185-199.
Matteo, M., Randhir, T. and Bloniarz, D. 2006. Watershed-Scale Impacts of Forest Buffers on Water Quality and Runoff in Urbanizing Environment. Joumal of Water Resources Planning and Management 132, 144-152. Mattikalli, N.M. and Richards, K.S. 1996.
Estimation of Surface Water Quality Changes in Response to Land Use Change: Application of The Export Coefficient Model Using Remote Sensing and Geographical Information System. Journal of Environmental Management 48, 263-282.
Messer, T.L., Burchell, M.R., Grabow, G.L. and Osmond, D.L. 2012. Groundwater nitrate reductions within upstream and down stream sections of a riparian buffer. Ecological Engineering 47, 297-307.
Mitchell, J.D., Lockaby, B.G. and Brantley, E.F. 2011. Influence of Chinese Privet (Ligustrumsinense)on Decomposition and Nutrient Availability in Riparian Forest, . Invasive Plant Science and Management 4, 437-447.
Moore, T.R., Trofymow, J.A., Prescott, C.E. and Titus, B.D. 2011. Nature and nurture in the dynamics of C, N and P during litter decomposition in Canadian forests. Plant Soil 339, 163-175.
Ngoye, E. and Machiwa, J.F. 2004. The influence of land-use patterns in the Ruvu river watershed on water quality in the river system. Physics and Chemistry of the Earth, Parts A/B/C 29, 1161-1166.
Núñez, D., Nahuelhual, L. and Oyarzún, C. 2006. Forests and water: The value of native temperate forests in supplying water for h u m a n c o n s u m p t i o n . E c o l o g i c a l Economics 58, 606-616.
Oost, K.V., Govers, G., Alba, S.d. and Quine, T.A. 2006. Tillage erosion: a review of controlling factors and implications for soil quality. Progress in Physical Geography 30, 443-466.
Powers, J.S., Montgomery, R.A., Adair, E.C. 2009. Decomposition in tropical forests: a pan-tropical study of the effects of litter type, litter placement and mesofaunal exclusion across a precipitation gradient. Journal of Ecology 97, 801-811.
Prasetyo, W. 2013, Demi Bawang, Ketersediaan P u p u k D i j a m i n , S u a r a M e r d e k a , http://m.suaramerdeka.com/index.php/r ead/cetak/2013/06/28/229203, 13 September 2013.
Rosegrant, M.W., Cai, X. and Cline, S.A. 2002. Global water Outlook to 2025; Averting an Impending Crisis. A 2020 Vision for Food, Agriculture, and the Environment Initiative. International Water Management Institute, Colombo, Sri Lanka.
Suryanto, P. and Putra, E.T.S. 2012. Traditional Enrichment Planting in Agroforestry Marginal Land Gunung Kidul, Java, Indonesia. Journal of Sustainable Development 5.
Susanna T.Y. Tong and Chen, W. 2002. Modeling the relationship between land use and surface water quality. Jour nal of Environmental Management 66, 377393. Tíscar, P.A. and Linares, J.C. 2011. Structure and
Regeneration Patterns of Pinus nigra subsp. salzmannii Natural Forests: A Basic Knowledge for Adaptive Management in a Changing Climate. Forests 2, 1013-1030. Vyas, V., Kumar, A., Wani, S.G. and Parashar, V.
2012. Status of Riparian Buffer Zone and floodplain areas of River Narmada, India.
International Journal of Environmental Sciences 3.
Wang, X. 2001. Integrating water-quality management and land-use planning in a w a t e r s h e d c o n t e x t . J o u r n a l o f Environmental Management 61, 2536. Wentai, Z., Dongsheng, Y., Xuezheng, S. 2011.
The Suitability of Using Leaf Area Index to Quantify Soil Loss under Vegetation Cover. J. Mt. Sci. 8, 564-570.