Vol. 18, No. 3, 2003, 243 - 260
DETERMINANTS OF INDONESIAN FIRMS’ CAPITAL STRUCTURE:
PANEL DATA ANALYSES
*Fitri Santi
Bengkulu University
ABSTRACT
Tulisan ini bertujuan untuk menelaah determinan struktur modal perusahaan di Indonesia. Sampel yang diambil adalah 87 perusahaan yang terdaftar di BEJ. Model panel data digunakan sebagai metoda dalam menganalisis determinan struktur modal. Dari hasil regresi diketahui bahwa variabel tangibility, growth opportunity, size, dan profitability mempunyai pengaruh terhadap struktur modal perusahaan.
Keywords: Capital Structure, Determinant, Indonesia, Panel Data.
INTRODUCTION*
Many believe that one of the important factors of monetary crisis in Indonesia is debt burden. A huge capital inflow not only makes Indonesian economy grow, but also results in economic overheating. Indonesian firms’ faced an increasing amount of external debt and the shorter maturity of their debt. These make them fragile to sentiments and boost financial distress risk (World Bank, 1998).
The increasing of Indonesian firm’s external debt is caused by several factors. A significant difference between domestic and international interest rate and predictability of exchange rate are perceived as attractive reasons to borrow abroad with improper hedging policy before crisis period (World Bank, 1998).
Macro economic factors, such as interest rate, inflation rate, exchange rate, the liquidity level of the economy, the government policy that benefited certain sector, capital market development, and other institutional factors are
*
This paper is a revisited version of my thesis “Studi empiris mengenai struktur modal perusahaan di
Indonesia: analisis panel data”. I would like to thanks to Mr. Ruslan Prijadi for all his advises.
thought to have significant influence to firms’ capital structure choice. For example, there is a jump of percentage change in external debt-to-GDP ratio from 64% in 1997 become 150% at the end of 1998. This movement could be indication of changes in Indonesian firms’ capital structure that due to exchange rate swing.
Ideally, such factors are included as independent variables in studying the capital structure decision. Such study needs both
country level and firm level data.
Unfortunately, we do not have firm level data from the other countries. Those macrolevel factors are not included directly to the research design, rather controlled by included dummy time variable and its interactions with firm specific capital structure determinants. By doing this, the real effect of firm specific factor at microlevel on capital structure choice can be ensured.
both firm-variant heterogeneity and time-variant heterogeneity. This study tries to fill this gap by using panel data in analysis of capital structure determinants.
This study uses an Indonesian data set to assess whether capital structure theory is portable across firms with different industrial characteristics, and to find out why some firms use more debt than others under identical macro conditions of taxation and interest rates. The lack of convincing and conclusive eviden-ce was probably what prompted Miler [1977] to put forth his famous irrelevancy theory.
Miller’s irrelevance holds that an optimal capital structure exists only for the aggregate economy. Theories of optimal capital structure survive not because they do any good but because they do not harm. There are at least two implications of this theory. First, the aggregate amount of debt used by corporations should be correlated with the appropriate macro variables such as tax rates, interest rates, financial institutions type, and second, the distribution of the firm debt ratios around this aggregate should be random.
However, inter-industry differences of debt ratios or leverage ratios and their correlation with firm characteristics provide evidence against such a random distribution (Titman and Wessels [1988]; Balakrishnan and Fox [1993]; Demirgüç-Kunt and Maksimovic [1994]; Rajan and Zingales [1995]; Hussain and
Nivorozhkin [1997]; Booth, Aivazian,
Demirgüç-Kunt and Maksimovic [2000]; Purba [2001]; Bevan and Danbold [2001]). Important theories of capital structure that attempt to explain these differences have included additional variables, such as; agency cost (Jensen and Meckling [1976]), non-debt tax shields (DeAngelo and Masulis [1980]), under-investment cost, assets substitution, and over-investment cost due to shareholder-bondholder conflict (Myers [1977]), asym-metry information problems between insider and outsider (Ross [1977], Leland and Pyle [1977], Myers and Najluf [1984]), pecking
order hypothesis and combination of these variables.
Three-research questions are proposed. First, do the firm-specific factors (such as tangibility, growth opportunity, size of the firm, and profitability) influence the firm capital structure? Second, do their influences have significant differences between crisis period and before crisis period? Third, does industrial classification have significant impact on firms’ leverage?
The remaining sections of this study are organized as follow. Section 2 presents an overview of literature on capital structure. Section 3 describes data and research methodology. Section 4 reports results of the statistical analyses. Section 5 summarizes the main consideration of the study.
LITERATURE REVIEW
There are several definitions of capital structure or leverage. The definition of leverage depends on the objective of analyses (Rajan and Zingales [1995]). For example, for agency problems related studies of capital structure, leverage may be defined as debt-to-firm value ratio, debt-to-total assets ratio, total liabilities-to-total assets, or total debt-to-net assets. For study of leverage and financial distress, interest coverage ratio is more suitable. Further, debt measures could be divided into its various components and numerator and denominator could be measured in book value and market value terms.
value and market value is used in measure the level of total leverage, long-term debt, and short-term debt.
There are at least three main theories considered as theoretical model of capital structure, i.e. static trade-off theory (STO), agency theory model (ATM), and pecking order theory (POH). In STO, capital structure move toward certain target that convey the type of firm assets, profitability, business risk, tax rate, and bankruptcy risk. In ATM, the potential conflict among manger, shareholders, and bondholders determine optimal capital structure minimized agency costs. Asset characteristics, and firm growth opportunities are important factors in agency cost. While in POH, market imperfection becomes the main issue. Transaction cost and asymmetric information try to link between firm ability to start a new investment and internal funds. If they should explore external sources, they more likely to issue debt then equity because of lower asymmetric information in debt than in equity issue.
The selection of independent variables as the determinants of leverage is primarily guided by the result from previous empirical studies in some developed and developing countries. According to prior research, several variables explain variations in leverage. Titman and Wessel (1988) used assets struc-ture, firm growth, non-debt tax shields, and firm uniqueness as explanatory variables of leverage level. Harris and Raviv (1991) suggest that leverage will increase as fixed assets, non-debt tax shield, investment opportunities, and size of firm increase; and will decrease as profitability, R&D expend-iture, advertising expendexpend-iture, bankruptcy probability, product uniqueness increase. Rajan and Zingales (1995) found that debt to total asset ratio is positively correlated with tangibility and size of firm; and negatively correlated with growth opportunity and profitability. This study used these four Rajan and Zingales variables as independent
variables or the determinant of capital structure and discuss below the theoretical and empirical considerations underlying each one of them.
Tangibility: According to Rajan and Zingales (1995), tangibility is the important variable in firm financing decision, because tangible assets act as collateral and provide security to lenders in the event of financial distress. Typically, intangible assets contain more asymmetric information about the value than tangible assets; it is easier for the lender to establish the value of tangible than intangible assets. Moreover, it is highly likely that in the face of probable bankruptcy, intangible assets like goodwill will rapidly disappear, thus diminishing the net worth of a firm and further accelerating its bankruptcy probability. Hence, one could argue that firms with a greater percentage of their total assets composed of tangible assets will have a higher capacity for raising debt. Collaterals also protect lenders from moral hazard problem cause by the shareholders-lenders conflict (Jensen and Meckling, 1976). Thus, firms with higher tangible assets are expected to have high level of debt.
Some empirical studies report a statistically significant relationship between tangibility and total debt-to-total assets ratio (Titman and Wessels [1988]; Rajan and Zingales [1995];
Booth, Aivazian, Demirgüç-Kunt and
Maksimovic [2000]; Purba [2001]). While, Bevan and Danbold [2001] suggest that the relationship between tangibility and leverage depends on the definition of leverage adopted. They found positive correlation between tangibility and long-term debt elements; a negative correlation is observed for short-term debt elements. Other study (Demirgüç-Kunt and Maksimovic [1994]) found that tangibility has positive correlation on total debt and long-term debt, but negative correlation on short-term debt.
companies whose value is predominately
accounted for by future investment
opportunities. Future investment opportunities represent a firm’s intangible value that does not have collateral value and would like to be losing value if financial distress takes place. Rajan and Zingales [1995] suggest that due to under investment problems (Myers and Majluf [1984]), it is expected a negative relationship between expected growth and leverage. These suggest a negative relationship between growth opportunity and leverage ratio. Titman and Wessels [1988] also suggest a similar relationship but for the reason that firms with greater growth opportunity have more flexibility to invest sub optimally and thus expropriate wealth from bondholders to shareholders. Rajan and Zingales point out that timing could be the other reason of negative relationship between growth opportunity and leverage ratio. If this is true, this negative relationship should be driven by companies that issued equity in a big size (Rajan and Zingales [1995]). Equity holders in highly leveraged companies with significant growth opportunity have incentives to do sub optimal investment policy (Myers [1977]). If these agency cost is severe, then it could be predicted that the growth companies would mainly be financed with equity or short-term debt. These implied that agency problem might be lower for short–term debt than long-term debt. As assets that revealed in balance sheets did not capture the future investment opportunities rather than share price reflects them. Therefore, market-to-book ratio is used as proxy for growth opportunity.
Empirical evidence on relationship between growth opportunity and leverage is incon-clusive. The studies conducted by Rajan and Zingales [1995], Titman and Wessels [1988] confirm negative relation between growth opportunity and total debt. Booth et al. [2000] find negative relationship between growth opportunities and long-term debt (both in book value and market value). While, Bevan and
Danbold [2001] found; positive insignificant relation between growth opportunity and long-term debt; and negative significant relation bet-ween growth opportunity and short-term debt. Size. Size can be expected to be a proxy of firms’ default probability (Titman and Wessels [1988]). As (1) bankruptcy costs are fixed and a diminishing function of firm value (Titman and Wessels [1988]) and (2) larger companies are usually more diversified and so less probability to bankrupt than smaller compa-nies, then it suggest that larger firm size should lead to higher debt capacity. Therefore, it can be predicted that size has positive relationship with leverage especially for countries and industries with higher bankruptcy cost.
Usually, asymmetric information between insider and market is less severe in larger companies; therefore, they should have higher capability to issue information sensitive securities (like equity) and have lower debt level than smaller companies (Rajan and
Zingales [1995], Demirgüç-Kunt and
Maksimovic [1996]). The asymmetric
information problems could make the negative relation between size and leverage.
Size is predicted to have positive relation-ship with long-term debt. Larger companies have easy access to get long-term debt than smaller companies (Rajan and Zingales [1995], Demirgüç-Kunt and Maksimovic [1996]). Agency conflicts between lenders and stockholders are probably more intense in small companies. Lender could manage the risk of borrowed funds to small companies by restraint the maturity of debt (Demirgüç-Kunt and Maksimovic [1996]). Consequently, smaller companies are expected to have less long-term debt –but probably have more short-term debt– than larger companies (Titman and Wessels [1988]).
positive relationship only for the export-oriented firms. There are also evidences that larger firms tend to use more long-term debt, trade credit, short-term securitised debt, but less short-term bank financing than small firms (Danbold and Bevan [2001]).
Profitability. Modigliani and Miller had made the interest tax-shield explanations; firms with high profits would employ high debt to gain tax benefits. Further, in the presence of asymmetric information profitable firms may signal quality by leveraging up (Jensen, 1986). If these are true, then there will be a positive relationship between leverage and profitability. Contrary, the pecking order or asymmetric information hypothesis of Myers and Majluf [1984] postulates that companies prefer internal financing to debt or equity. The interest tax-shield may also not work for those firms that have other avenues, like depreciation, to shield their taxes (DeAngelo and Masulis [1980]). Firms with higher profitability will employ higher retained earning and less debt. Most empirical studies confirm the pecking order hypothesis (Titman and Wessels [1988], Baskin [1989], Demirgüç-Kunt and Maksimovic [1994], Rajan and Zingales [1995], Purba [2000], Bevan and Danbold [2001], Booth et.al. [2001]).
DATA AND METHODOLOGY
This study use data of ICMD published by ECFIN.1 The selected time-period from 1989
to 1999 is intended to capture the differences in economic conditions of Indonesian economy (before and after crisis) and data availability consideration. Companies that exist throughout the 10-year period with no missing data are included in the study. Firms are grouped into nine industrial sectors. These groups are based on JSX classification. Firms in the financial, securities, and investment sector were excluded from sample. The sector that contains
1
Authors express the gratitude to Wawan Kurniawan, ECFIN Journal, for making data available.
only one firm in sample (mining industry) is also excluded. The remaining industry sectors are as follow:
1. S1: agriculture industry.
2. S2: basic industry and chemical industry. 3. S3: miscellaneous industry.
4. S4: consumer goods industry. 5. S5: real estate and property industry.
6. S6: infrastructure, utilities, and transpor-tation industry.
7. S7: trade and services industry (not inclu-ding investment companies).
The remaining firms after eliminating outlier are 87 for each year.
The entire period from 1989 to 1999 is divided into two sub periods: before crisis period (1989-1996) and crisis period (1997-1999). The variables are calculated as follow: Dependent variables measure leverage level are:
1. Total leverage in book values. LEV1B = [total debt / total assets].
2. Total leverage in market values. LEV1M = [total debt / (total assets – book value of equity + market value of equity)].
3. Long-term debt ratio in book values. LTDB = [total long-term debt / total assets]. 4. Long-term debt ratio in market values.
LTDM = [total long-term debt / (total assets - book value of equity + market value of equity)].
5. Short-term debt ratio in book values. STDB = [total short-term debt / total assets]. 6. Short-term debt ratio in market values.
STDM = [total short-term debt / (total assets - book value of equity + market value of equity)].
Independent variables:
tangibility is positively related to all leverage measures.
2. Growth opportunity. MTB = [(total assets – book value of equity + market value of equity)/total assets]. We hypothesized empirically that growth opportunity has negative relationship with total leverage and long-term debt ratios, but positively related to short-term debt ratios.
3. Size. SIZEA = [log (sales)]. We hypothe-sized size has a positive relation with total leverage ratio and long-term debt ratios, and short-term debt ratios.
4. Profitability. PROA = [EBIT/total assets]. We hypothesized profitability is negatively related to each leverage measures.
5. Industrial dummies. In order to control for any industry-specific effects that may not be captured by the variables above, industry dummies are also included as independent variable.
6. Time dummy. DUMTHA = {zero if before crisis period; and one if crisis period}.
This study assumes that the differences in debt ratios could result from a firm’s dynamic through different times. Let the capital structure or leverage, Lit, for firm i at period t,
Lit = F (Xit, Di, Dt) (1)
be a function of a vector of firm and time variant variables determining capital structure (Xit), and Di and Dt. Di and Dt are firm-specific
and time-specific effects represented by firm and time dummy (or time trend) variables respectively. To conserve degrees of freedom the firm-specific effects (Di) are replaced by
industrial sector dummy variables. Thus, the leverage is allowed to vary across firms and over time. Since factors that determine a firm’s leverage may change over time, it is likely that the optimal debt ratio may move over time even for the same firm. This captures the dynamic nature of the capital structure pro-blem, which has hitherto been overlooked in the literature. By taking averages over time,
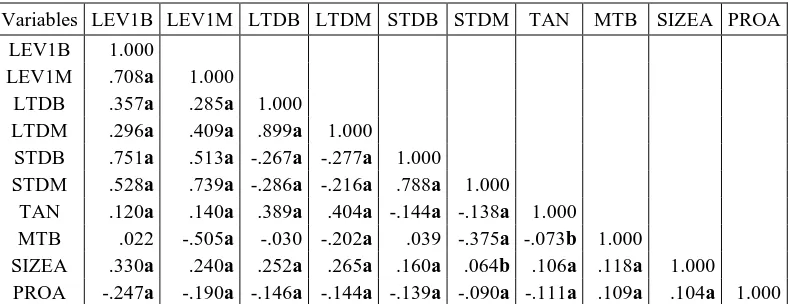
most papers employing time series do not ma-ke use of this important source of information. Since there is cross-sectional heterogeneity, the GLS estimations rather than OLS estimations is used in this study. By using first order autoregressive in the model, first-order positive serial correlation can be removed in the GLS model. After looking at table 2, the matrix of correlation coefficients between the dependent and independent variables, we find that most cross-correlation terms are fairly small, thus giving no cause for concern about problem of multicollinearity among variables.
Four steps are used in the estimation process. First, pooled GLS regressions are estimated. Pooled GLS model might produce biased result due to its failure to control for time-invariant firm-specific heterogeneity. The pooled GLS model analysis yields results that are generally consistent with other cross-sectional results. Based on Hausman test, fixed effect GLS models are used in the second step to counter for time-invariant firm-specific heterogeneity. Third, fixed effect GLS models are extended by incorporating time dummy and its interactions with each independent variables. This analysis of the dynamics in the panel is intended to control both firm variant and time variant heterogeneity. This process could capture the dynamic on all variables influence capital structure. Therefore, this study let not only intercept but also slope vary in the regression. Fourth, the pooled GLS regressions with industrial dummy are made to conserve degrees of freedom of the firm-specific effects (Di) in fixed effect GLS
models. Therefore, we could see the industry classification effect on leverage.
RESULTS AND DISCUSSION
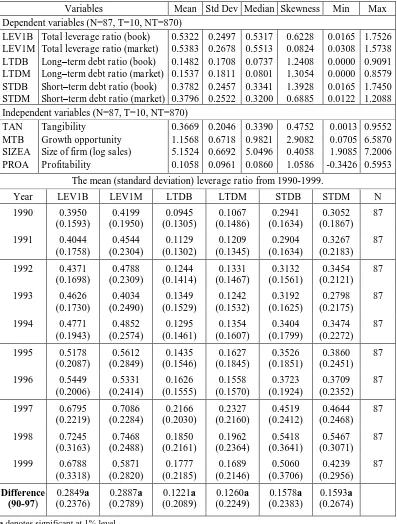
short-term debt ratio is twice of the long-term debt ratio. The distribution of ratios is skewed toward lower end, except for total debt in market value. The average market value ratios are higher then the book value ratios. These results support the World Bank report that Indonesian firms face not only an increasing amount of external debt but also the shorter maturity of their debt.
Each debt ratios in table 1 show substantial change during before crisis period (1990-1996) and crisis period (1997-1999). During the crisis period, the Indonesian economy suffered a drop in exchange rate where the USD soared and the market price of shares fell. Unfortu-nately, their debt was mostly USD nominated and part of them was short-term debt.
Table 2 provides correlation matrix for the pooled sample of 870 observations. Growth opportunity and profitability are positively correlated with size of the firm. This implies that larger firms tend to grow fast and have higher profitability. Tangibility has a negative correlation with profitability and growth opportunity.
Tangibility has a positive correlation with total leverage ratio and long-term debt ratio, but negative correlation with short-term debt ratio. Growth opportunity is significantly and negatively correlated with all market leverage ratio (LEV1M, LTDM, and STDM). It does not have significant correlation with book leverage ratio, except for STDB. Size is positively correlated with all leverage ratios. This study also observed that profitability has negative association with all leverage measures. Finally, this study does observe that book leverage ratios are highly correlated with market leverage ratios.
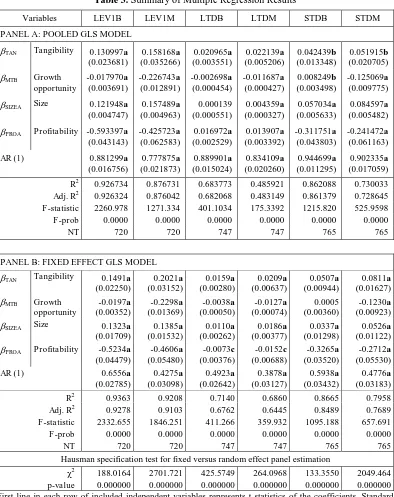
Table 3 presents regression results. We first discuss result of pooled GLS regression. Then second, we continue to discuss result of fixed effect GLS model. Afterward, we will explain the finding of fixed effect GLS regression with time dummy variable and time dummy interaction variables.
Pooled GLS Estimation Result
Table 3 panel A presents the result of the pooled GLS regression analysis. At the aggregate level, we find that the regressions are statistically significant, and we are able to reject the null hypothesis of joint significance of the coefficients at less than the one percent level. Although, the adjusted R2 measure differs significantly among them, from a low of 48.31% for market value of long-term debt ratio (LTDM), to a high 92.63% for book value of total leverage ratio (LEV1B).
Tangibility: This study finds a statistically significant positive relationship between tangi-bility and all types of book and market value leverage ratios. This finding supports collateral value explanation. This suggests that tangible asset could be collateral and reduce agency conflict between bondholders or lenders and shareholders. This result also suggests that firm with more tangible assets tend to borrow more than firm with less tangible assets
Growth opportunity: The multivariate-pooled OLS regression results show that the coefficient of MTB (as a proxy of growth opportunity variable) is negative significant throughout, except for STDB. This study finds a significantly positive relationship between MTB and STDB. These confirm the pecking order theory of Myers [1977] that suggest that companies with high market-to-book ratio would have lower long-term debt ratios and leverage ratios, and used more equity or short-term debt due to the under-investment problem.
Table 1. Summary of Descriptive Statistics
Variables Mean Std Dev Median Skewness Min Max
Dependent variables (N=87, T=10, NT=870) LEV1B
Total leverage ratio (book) Total leverage ratio (market) Long–term debt ratio (book) Long–term debt ratio (market) Short–term debt ratio (book) Short–term debt ratio (market)
0.5322 Independent variables (N=87, T=10, NT=870)
TAN Size of firm (log sales) Profitability
The mean (standard deviation) leverage ratio from 1990-1999.
Year LEV1B LEV1M LTDB LTDM STDB STDM N
Table 2. Correlation Matrix – Pooled Sample
Variables LEV1B LEV1M LTDB LTDM STDB STDM TAN MTB SIZEA PROA
LEV1B 1.000
LEV1M .708a 1.000
LTDB .357a .285a 1.000
LTDM .296a .409a .899a 1.000
STDB .751a .513a -.267a -.277a 1.000
STDM .528a .739a -.286a -.216a .788a 1.000
TAN .120a .140a .389a .404a -.144a -.138a 1.000
MTB .022 -.505a -.030 -.202a .039 -.375a -.073b 1.000
SIZEA .330a .240a .252a .265a .160a .064b .106a .118a 1.000
PROA -.247a -.190a -.146a -.144a -.139a -.090a -.111a .109a .104a 1.000
a denotes correlation is significant at the 0.01 level (1-tailed). b denotes correlation is significant at the 0.05 level (1-tailed).
Profitability: Pooled GLS results indicate a significant negative relation of profitability with book and market value of short-term ratios and total leverage ratios. Profitability seems to be the most dominant determinant of total leverage ratios and short-term debt ratios of Indonesian firms in the pooled GLS regressions as it generally has high beta coefficients and t-statistics that are statistically significant at 1% level. This study also finds that profitability has a positive relation to book and market value of long-term debt ratio. This positive relation seems contradict with the pecking order theory. We still suspect this positive relationship because it might have the correlation between the firm specific effect and profitability variable. This correlation might reverse the sign. It will discussed in the fixed GLS estimation result section.
Fixed Effect GLS Estimation Result
At the second stage of the analysis, this study will utilize the panel nature of the data set and employ fixed effects regression in order to control for underlying time-invariant heterogeneity among firms in the dataset. The failure to control effectively for time-invariant
(but firm-specific) heterogeneity entails that the disturbance term in a classical linear regression will incorporate time-invariant omitted factors. Consequently, if these omitted factors are contemporaneously correlated with the included independent variables – as is the underlying assumption of the fixed effects model – parameter estimation will be biased and inconsistent. Hence, inference based upon these parameters estimation may lead to inappropriate conclusions (Hsiao [1986], Baltagi [1995]). By transforming the model to eliminate time-invariant (firm-variant) effects that vary by firm the parameters of the fixed effects model are BLUE under least square estimation.
Table 3. Summary of Multiple Regression Results
Variables LEV1B LEV1M LTDB LTDM STDB STDM
PANEL A: POOLED GLS MODEL TAN Tangibility 0.130997a
(0.023681) PROA Profitability -0.593397a
(0.043143)
R2 0.926734 0.876731 0.683773 0.485921 0.862088 0.730033 Adj. R2 0.926324 0.876042 0.682068 0.483149 0.861379 0.728645 F-statistic 2260.978 1271.334 401.1034 175.3392 1215.820 525.9598 F-prob 0.0000 0.0000 0.0000 0.0000 0.0000 0.0000
NT 720 720 747 747 765 765
PANEL B: FIXED EFFECT GLS MODEL TAN Tangibility 0.1491a
PROA Profitability -0.5234a
(0.04479) F-statistic 2332.655 1846.251 411.266 359.932 1095.188 657.691 F-prob 0.0000 0.0000 0.0000 0.0000 0.0000 0.0000
NT 720 720 747 747 765 765
Hausman specification test for fixed versus random effect panel estimation
2
188.0164 2701.721 425.5749 264.0968 133.3550 2049.464 p-value 0.000000 0.000000 0.000000 0.000000 0.000000 0.000000 First line in each row of included independent variables represents t-statistics of the coefficients. Standard error is in parenthesis.
a denotes coefficient is significant at the 0.01 level. b denotes coefficient is significant at the 0.05 level. c denotes coefficient is significant at the 0.10 level.
Tangibility: This study did not find the influence of tangibility on the level of the leverage measures to reverse sign when using fixed effects GLS rather than pooled GLS. It is only find changes in the magnitude influence of tangibility on the leverage measure. Furthermore, the significance of the influence of tangibility on short-term debt ratio is increase under fixed effects GLS regression. The positive sign of tangibility coefficient in all leverage equations suggesting that collateral is not only correlated with the level of long-term debt, but is also a delong-termining factor in obtaining short-term debt finance. It means that lenders condition their lending – whether long-term or short-term debt – on the availability of collateral value. The positive tangibility coefficient for short-term debt ratios contradicts the maturity principle. However, the results may be time-specific, with lenders having become increasingly cautious in their lending policies following the Indonesian economic crisis of the mid 1997. We turn to this point in the Dynamics in Fixed Effects Estimation section below.
Growth opportunity: The result show that growth opportunity has a significant negative influence on the level of total leverage (both LEV1B and LEV1M), and on the level of long-term debt (both LTDB and LTDM). Comparing the coefficients of the pooled GLS and the fixed effects GLS model illustrates that controlling for underlying firm-variant heterogeneity in the sample has a significant impact on the results. This study finds that previous positive correlation between growth opportunity and STDB become insignificant under fixed effects GLS regression. Therefore, controlling for time-invariant (firm-variant) heterogeneity eliminates the influence of
growth opportunity upon STDB.
Consequently, the hypothesis of positive relationship between growth opportunity and short-term debt is rejected, but for different reasons than previously.
Size: The influence of company size on each of the leverage measures does not change substantially under the two different estimation techniques, although there are some slight changes in the magnitude and the significance of the coefficient. The missing variable bias of pooled GLS model appears to have some influence on the estimation of relationship between size and LTDB. Once time-invariant heterogeneity is controlled for, the influence of size on LTDB is positive but insignificant under pooled GLS model becomes significant under fixed effect GLS model. Controlling for firm specific effects, it is found a positive relationship between size and all leverage measures.
Profitability: After controlling for time-invariant heterogeneity leads to significant changes in magnitude and the statistically significance of the regression coefficients generally (most notably in the case of LTDB, LTDM and STDM), polarity remains constant save for LEV1B and LEV1M. It is observed that the influence of profitability on long-term debt reverse sign, from positive under pooled GLS model become negative under fixed effect GLS model. The statistically significance of negative influence of profitability on LTDB and LTDM are slightly change, from 1% level of significance under pooled GLS model become 10% level of significance under fixed-effects GLS model. These suggest that this study still found a negative relationship between profitability and all leverage measures, thus this study still able to accept the pecking-order explanation for all leverage measure.
established yet. We will turn to this in the below section
The Dynamics in Fixed Effects GLS Estimations
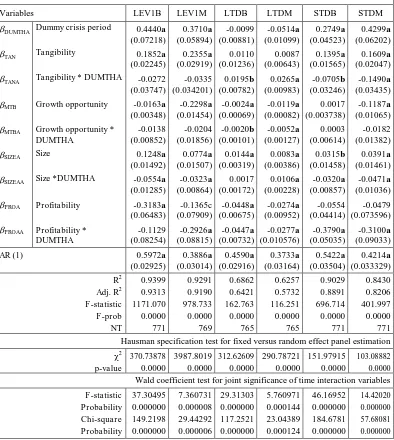
In this section, time-variant heterogeneity is controlled to take into account all possible dynamics in influence of included variables through periods. One possible method to do this would be to use variable intercept and slope model (Bevan and Danbold [2001]). This approach effectively assumes that the time effects can be captured by shifts in both intercept and slopes regression. We follow the work of Bevan and Danbold [2001] extended the fixed effect model by introducing time dummy variables for two periods (before and during crisis) and its interaction with included independent variables. By doing this allow us not only test for general time-specific (but firm-invariant) shifts in leverage level, but also to determine whether the influence of included independent variables on leverage level changes through time. The results of the regressions are presented in Table 4.
From table 4, the coefficient of dummy crisis period is significant at the 1% level of significance. The coefficient of dummy crisis period may be interpreted as the deviation of leverage level during crisis period from the level of leverage before crisis period. It is observed that the coefficients of dummy crisis period are positive significant in LEV1B, LEV1M, STDB, and STDM equations, and negative significant in LTDB and LTDM. These mean that Indonesian firms used more debt in their capital structure and more short-term debt in crisis period (partly the increase may be due to exchange rate swings). Even so, this study found a significant negative coefficient of dummy crisis period, indicating that Indonesian firms start to reduce their long term-debt level in their capital structure at early crisis period. The result also supports the World Bank report that Indonesian firms are highly relied on debt (especially on external
debt) and with shorter debt maturity, and the crisis hurt them more.
A superficial glance at table 4 reveals a large number of significant time interaction coefficients, suggesting some degree of dynamic dependence among the coefficients. This is confirmed when we note that overall adjusted R2 measure for this set regressions is typically larger than under fixed effects estimation without time interactions. Even so, this study also observes a decline in the associated F-statistic indicating that the loss of degree of freedom is not offset with increased explanatory power. However, the results of Wald coefficient test for joint insignificance of the interactive time dummies, presented in table 4, rejects of joint insignificance.
Tangibility: The introduction of dummy crisis period has limited the impact of several included independent variables on leverage level. The influence of tangibility on LEV1B and LEV1M before crisis period does not change significantly during crisis period. The coefficients of tangibility on STDB and STDM equations before crisis period are 0.1395 and 0.1609 respectively, becomes 0.0690 and 0.0119 during crisis period.2 This means that
there was declining in magnitude influence of tangibility on short-term debt during crisis period. However, this study observes the influence of tangibility on long-term debt is positive insignificant in before crisis period, become positive and significant during crisis period.
2
Table 4. Summary of The Regression Results for Dynamics in Fixed Effect Model
FIXED EFFECT GLS MODEL WITH DUMMY VARIABLE AND ITS INTERACTION WITH INCLUDED INDEPENDENT VARIABLES
Variables LEV1B LEV1M LTDB LTDM STDB STDM
DUMTHA Dummy crisis period 0.4440a
(0.07218) MTB Growth opportunity -0.0163a
(0.00348) MTBA Growth opportunity *
DUMTHA
PROA Profitability -0.3183a
(0.06483) PROAA Profitability *
DUMTHA F-statistic 1171.070 978.733 162.763 116.251 696.714 401.997 F-prob 0.0000 0.0000 0.0000 0.0000 0.0000 0.0000
NT 771 769 765 765 771 771
Hausman specification test for fixed versus random effect panel estimation
2
370.73878 3987.8019 312.62609 290.78721 151.97915 103.08882 p-value 0.0000 0.0000 0.0000 0.0000 0.0000 0.0000 Wald coefficient test for joint significance of time interaction variables
F-statistic 37.30495 7.360731 29.31303 5.760971 46.16952 14.42020 Probability 0.000000 0.000008 0.000000 0.000144 0.000000 0.000000 Chi-square 149.2198 29.44292 117.2521 23.04389 184.6781 57.68081 Probability 0.000000 0.000006 0.000000 0.000124 0.000000 0.000000 First line in each row of included independent variables represents t-statistics of the coefficients. Standard error is in parenthesis.
Growth opportunity: Comparison of the result in table 3 and 4 reveals that controlling for the time dimension in the fixed effects analysis have a little significant impact on the results regarding the relationship between leverage ratios and the growth opportunity (MTB). Previous results found that total leverage (LEV1B and LEV1M), long-term debt (LTDB and LTDM), and in particular STDM, were negatively correlated with the level of growth opportunities, while the impact of growth opportunity on STDB was positive but insignificant. Controlling for time only makes slightly changes in the magnitude of the growth opportunity coefficients before crisis period. However, during the crisis period, the coefficient of interaction variable between dummy and growth opportunity is negatively significant only for long-term debt.
Size: Table 3 panel A and B illustrated that generally, large firms tend to use more long-term debt and short-long-term debt than smaller firms. This study then tries to find out whether this relationship remains constant through periods. By controlling for time-variant heterogeneity does make shift in the magnitude influence of size on the leverage measures. The influence size on short-term debt during crisis period has declined; even the coefficient of size becomes negative.3 This illustrates that the correlation between size and short-term debt may have weakened through time. This may suggest that during crisis period large companies tend to reduce their short-term debt, and or lenders have become more willing to lend short-term debt to small firms.
Profitability: The result illustrated that controlling for time has a significant effect upon the correlation between profitability and short-term debt. The only caveat is being loss significance of profitability coefficients on STDB and STDM equations relative to the
3 The coefficients of size in STDB and STDM equations during crisis period are –0.0005 and –0.0080 respectively.
previous fixed effect estimation. The interactive dummy coefficients on profitability in short-term debt equations is negatively significant, point up that during the crisis period profitable firms appear to have decreased their short-term debt. Furthermore, the interactive dummy coefficients on profitability in long-term debt equations is negatively significant provide more support toward the pecking order theory.
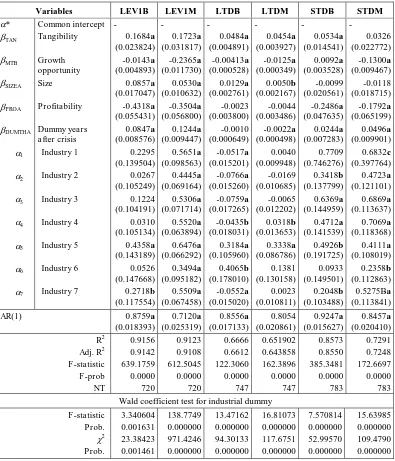
The Influence of Industry Characteristics on Capital Structure
The industrial dummy variables are introduced into the pooled GLS model to find out the influence of industrial characteristics on capital structure. These industrial dummies replace the individual firm dummies vector in fixed effect model, and save degree of freedom in estimation.
The results in table 5 provide evidence that industrial characteristics have a significant role in explaining the Indonesian firms leverage level. However, Wald test provide stronger evidence that the industrial dummies have significant impact on all leverage measures. Thus, inter-industry differences of debt ratios or leverage ratios and their correlation with firm characteristics provide evidence against the random distribution of firms’ debt ratios in the Miller’s irrelevant theory.
Table 5. Summary of Regression Result of Capital Structure Determinants and Industrial dummies
on capital structure.
Variables LEV1B LEV1M LTDB LTDM STDB STDM
PROA Profitability -0.4318a
(0.055431) F-statistic 639.1759 612.5045 122.3060 162.3896 385.3481 172.6697 F-prob 0.0000 0.0000 0.0000 0.0000 0.0000 0.0000
NT 720 720 747 747 783 783
Wald coefficient test for industrial dummy
F-statistic 3.340604 138.7749 13.47162 16.81073 7.570814 15.63985 Prob. 0.001631 0.000000 0.000000 0.000000 0.000000 0.000000 2 23.38423 971.4246 94.30133 117.6751 52.99570 109.4790 Prob. 0.001461 0.000000 0.000000 0.000000 0.000000 0.000000 First line in each row of included independent variables represents t-statistics of the coefficients. Standard error is in parenthesis.
CONCLUSION
JSX firms employ relatively high debt in their capital structure, around 53%, 15%, and 38% for total debt, long-term debt, and short-term debt respectively. We observed that these ratios increase during the crisis period. Indonesian economy faced a downturn since 1997. At the beginning of 1997s, Indonesian firms faced the decreased in their equity values, and increase the debt values due to exchange rate swing.
As regard the determinants of capital structure of JSX firms, the results from pooled GLS model show that tangibility and size of the firm variables has a significant positive
influence on all leverage measures,
profitability variable have a significant negative relationship with all leverage measure except for long-term debt ratios, growth opportunity has a negative relationship with all leverage measure except for STDB. This study found that growth opportunity has a significant positive relationship with STDB.
This study then tries to find out whether these relationships remain constant after controlling for time-invariant heterogeneity. Controlling time-invariant heterogeneity, there are found some changes in the result. It is observed that profitability coefficient in LTDB and LTDM equations reverse sign from positive under pooled GLS model becomes negative under fixed effect GLS model.
In order to additionally control for time-variant factors that affect all firms generally, the analysis is extended by introducing dummy period and its interaction with included independent variables. It is found that there are dynamics in the data. It is observed that the magnitude influence of included variables change after controlling for time-variant factors.
At general level, by controlling for time-variant factors, it is found that during the crisis period companies in the sample have made increasing use of total debt, less use of long
term debt, and increasing use of short-term debt. These results revealed that exchange rate fall have caused the market capitalization of their equities fell, the total leverage ratio and the short-term debt increased, but the long-term debt decreased. However, this general result was found to differ between firms according to the four determining factors. First, over before crisis period, JSX companies with high tangible assets have tended to use more short-term debt and total debt. During crisis period, these companies have tended to decrease the use of short-term in favor to long-term debt.
Secondly, before crisis period high growth opportunity companies have tended to employ less total debt and long-term debt. However, over crisis period these companies have tended to decrease the use of long-term debt.
Third, large companies have tended to employ more debt (both long-term and short-term debt) before crisis period. Over crisis period, they have tended to reduce the level of their debt, particularly short-term debt then before crisis period. There are two possible reasons for these phenomena: (1) large companies have accelerated their debt payment due to exchange rate volatility, or (2) lenders have started to shift their loan orientation, from for large companies before crisis period to for small and medium scale companies during crisis period. Furthermore, they have used more long-term debt then before crisis period, probably they have rolled over their debt, or have made debt restructuring.
Fourth, profitable firms have used less debt, mainly less long-term debt before crisis period. These continue over crisis period, and suggest that this study still can support pecking order theory of negative relationship between debt level and profitability for both before crisis and during crisis period.
differences of debt ratios or leverage ratios and their correlation with firm characteristics. These evidence against the random distribution of Miller’s debt irrelevance theory.
We suggest that further research ers make a deeper investigation on the influence of Indonesian financial market development to firms’ capital structure. For example, the influence of capital market, bond market, and banking sector development, both in their sizes and activities, as sources of fund or supply side, on firms’ capital structure choices.
REFERENCES
Balakrishnan, Srinivasan and Isaac Fox (1993). Asset Specificity, Firm Heterogeneity and Capital Structure, Strategic Management Journal 14, 3-16.
Baskin, Jonathan (1989). An Empirical Investigation of Pecking Order Hypothe-sis, Financial Management, spring, 26-35.
Bevan, Alan A., and Jo Danbold (2001). Panel Estimation of the determinants of Capital Structure in the UK, www.fma.org/ paris/danbolt.pdf.
Booth, Laurence; Varouj Aivazian; Asli Demirguc-Kunt and Vojislav Maksimovic (2000). Capital Structures in Developing Countries, Journal of Finance, 2000
Bradley, Michael; Gregg Jarrell and E. Han Kim (1984). On the Existence of an Optimal Capital Structure: Theory and Evidence, Journal of Finance 39, 857-878. Brander, James A. And Tracy R. Lewis (1986). Oligopoly and Financial Structure: The Limited Liability Effect, American Economic Review 76, 956-970.
Brigham, Eugene and Gapensky (1991). Financial Management, sixth edition, Orlando: The Dryden Press.
DeAngelo, Harry and Ronald W. Masulis (1980). Optimal Capital Structure Under Corporate and Personal Taxation, Journal of Financial Economics 8, 3-30.
Demirgüç-Kunt, Asli, and Vojislav
Maksimovic (1994). Capital Structure in Developing Countries: Evidence from Ten Country Cases. Policy Research Working
Paper #1320, World Bank, Policy
Research Department, Washington, DC. _____ (1996). Institutions, Financial Markets,
and Firms’ Choice of Debt Maturity. Policy Research Working Paper 1321, World Bank, Policy Research Department, Washington, DC.
_____ (1998). Law, Finance, and Firm Growth, Journal of Finance 53, 2107-2137.
Fama, Eugene, and Kenneth French (1992). The Cross-Section of Expected Return, Journal of Finance 46, 427-466.
Fatemi, Ali; James S. Ang; and Alireza Tourani-Rad (1997). Capital structure and Dividend Policies of Indonesian Firms, Pacific-Basin Finance Journal 5, 87-103. Harris, Milton and Artur Raviv (1990). Capital
Structure and the Informational Role of Debt, Journal of Finance 45, 321-349.
Harris, Milton and Artur Raviv (1991). The Theory of Capital Structure, Journal of Finance 46, 297-335.
Hausman, J. A. and W. E. Taylor (1981). Panel Data and Unobservable Individual Effects, Econometrica, 49, 1377-1398.
Homaifar, Ghassem; Joachim Zietz and Omar Benkato (1994). An Empirical Model of Capital Structure: Some New Evidence, Journal of Finance and Accounting, 21(1), 1-14.
Hossi, Takeo; Anil Kashyap and David Scraftstein (1991). Corporate Structure, Liquidity, and Investment: Evidence from Japanese Panel Data, Quarterly Journal of Economics 106, 33-60.
Hussain, Qaizar and Eugeniy Nivorozhkin (1997). The Capital Structure of Listed Companies in Poland. IMF Working Paper #175, IMF Institute.
Jensen, Michael C. (1986). Agency cost of Free-Cash Flow, Corporate Finance and Takeover, American Economic Review 76, 323-339.
Jensen, Michael C. and William Meckling (1976). Theory of the Firm: Managerial Behavior, Agency Cost, and Capital Structure, Journal of Financial Economics 3, 305-360.
Johnston, Jack and John Enrico DiNardo (1997). Econometric Methods, 4th edition, McGraw-Hill.
Judge, George G.; W. E. Griffiths; R. Carter Hill; Helmut Lüthkepohl and Tsoung-Chao Lee (1985). The Theory and Practice of econometrics, second edition, Canada: John Wiley and Sons.
Korajczyk, Robert A.; Deborah Lucas and Robert McDonald (1990). Understanding Stock Behavior Around the Time of Equity Issues, in R. Glenn Hubbard, ed.:
Asymmetry Information, Corporate
Finance, and Investment, Chicago:
University of Chicago Press, 257-277.
Leland, Hayne and David Pyle (1977).
Information Asymmetric, Financial
Structure, and Financial Intermediation, Journal of Finance 32, 371-388.
Miller, Merton H. (1977). Debt and Taxes, Journal of Finance 32, 261-275.
Myer, Stewart and Nicholas Najluf (1984). Corporate Financing and Investment Decisions When Firm Have Information That Investor Do Not Have, Journal of Financial Economics 13, 187-221.
Opler, Tim C. and Sheridan Titman (1994).
Financial Distress and Corporate
Performance, Journal of Finance 59, 1015-1040.
Purba, Silvia Diana (2001). Studi Empiris Struktur Modal Pada Perusahaan yang Go Public di Indonesia, tesis, Program Pasca-sarjana Universitas Indonesia, Jakarta.
Rajan, Raghuram G. and Luigi Zingales (1995). What Do We Know about Capital
Structure? Some Evidence from
International Data, Journal of Finance 5, 1421-1460.
Ross, Stephen A. (1977). Determination of Capital Structure: the Incentive Signaling Approach, Bell Journal of Economics 8, 23-40.
Ross, Stephen A; Radolph W. Wasterfield and Jeffrey Jaffe (1999). Corporate Finance, fifth edition, Singapore: McGraw-Hill. Shim, Jae K. and Joel G. Siegel (1995).
Dictionary of Economics, USA: John Willey & Sons, Inc.
Shleifer, Andrei and Robert W. Vishny (1997). A Survey of Corporate Governance, Journal of Finance, vol. LII, No.2, 737-783.
Sumodiningrat, Gunawan (1998). Ekonome-trika: Pengantar, edisi pertama, Yogya-karta: BPFE.
Stulz, René (1990). Managerial Discretions and Optimal Financing Policies, Journal of Financial Economics 26, 3-27.
Titman, Sheridan and Roberto Wessels (1988). The Determinant of Capital Structure Choice, Journal of Finance 43, 1-19.