Journal's Title, Vol. x, 20xx, no. xx, xxx - xxx HIKARI Ltd, www.m-hikari.com
http://dx.doi.org/10.12988/
Application of Grid Method to Determine
Location of Rice Warehouse in Minahasa Tenggara
Adi Setiawan
Department of Mathematics Faculty of Science and Mathematics
Satya Wacana Christian University Jl. Diponegoro 52-60 Salatiga Indonesia
Eko Sediyono
Master of Information System Program Faculty of Information Technology Satya Wacana Christian University Jl. Diponegoro 52-60 Salatiga Indonesia
Copyright © 20xx Adi Setiawan and Eko Sediyono. This is an open access article distributed under the Creative Commons Attribution License, which permits unrestricted use, distribution, and reproduction in any medium, provided the original work is properly cited.
Abstract
In this paper, we discuss about how to determine the location of rice warehouse for one and two locations of rice warehouse based on the location coordinates of sources and demand of rice in Southeast Minahasa Regency. If it is desired to make one warehouse then it will be obtained in location coordinates 1o 1.8 N, 127o 43.2 E which is located in areas around East Tombatu districts. If it is desired to make two warehouses then it will be obtained in location coordinates 1o 2.4 N, 128o 40.8 E which is located in areas around Tombatu district and 1o 1.2 N, 124o 44.4 E which is located in the area around East Tombatu.
1 Introduction
Rice is the main food of the people of Indonesia. Once the importance of rice for the people of Indonesia, so that the President Jokowi need to prepare new rice granary. As in the month of June 2015 set as the granary Merauke National [1]. In set a new granary, where the old granary also needs to be maintained. Minahasa since the 18th century has been established by the Company, as a granary for food supplies for the VOC in the Moluccas [2]. Currently Southeast Minahasa Regency government also needs to keep its existence as the national granary. Granary location determination as practiced by President Jokowi is the political determination alone. Actually, there are several scientific way in setting the strategic location of facilities based on several indicators [3].
In this paper, it is describe how to determine the location of rice warehouse in case one or two rice warehouses in Minahasa Tenggara by using Grid Method. This method is compared by Center of Gravity Method.
2 Literature Review
In this section, it is explained several methods that are used to determine the location of rice warehouse if the cost of distribution, quantity and the coordinate of supply and demand are known.
Method of Location Determination
Heizer and Render discusses several methods of determining the location of facility (in this case rice warehouse) such as method of ranking factor of the location (Location Factor Rating), Center of Gravity Method and Transportation Method [4].
Location Factor Ranking
Location Factor Rating is a method of determining the location of which emphasizes the importance of objectivity in the process of recognizing the costs are difficult to evaluate. Factors to be considered both qualitatively and quantitatively analyzed by quantifying all factors. The steps that is used to perform the method can be described as follows :
1. Make a list of related factor that is often called the key factor of success (critical success factors - CSFs).
2. Create a weighting for each factor that has been set in step 1. that the size depending on their significance for the company.
3. Create a rating scale for each factor (for example 1-10 or 1-100) 4. Assign several alternative locations were nominated.
6. Analysis of each factor allocates weights to each factor with the assessment, and total the results.
7. Provide recommendations based on the value of the maximum points according to the results obtained in step 6.
Center of Gravity Method
Center of Gravity Techniques is a mathematical technique used to find the location that best apply to a single distribution point serving several stores or areas. This method takes into account the distance of the market, the amount of delivered goods and delivery charges. Step using the Center of Gravity Method is described as follows:
1. Set the amount of goods shipped from the warehouse to the location of the distribution (which will be searched location) every certain period.
2. Go to the map, specify a place as a point of origin (0,0).
3. Place locations owned market companies in a coordinate system with the origin point as a basis.
Load-distance Techniques
Load-distance Techniques is a variation of the center of gravity method for determining the coordinates of the location of the facility. In this method, a number of sites was evaluated based on distance and load.
Transportation Method
Transportation is one of the methods in operations research methods that can be used in selecting a company location. This method is in principle seek optimal value can be obtained by calculating the fulfillment of demand and supply with the lowest transportation costs.
Method of Grid
This method can be explained as follows. Suppose we have n sources of supply of goods in coordinate (xi, yi) for i = 1, 2, …., n and amount of supply is represented
by Wi (in tons) and the cost used to distribute every ton of goods. In this case, Wi
is positive if there is positive difference between rice production and rice consumption, Wi = 0 if there is no difference between rice production and rice
consumption and Wi is negative if there is negative difference between rice
production and rice consumption. The coordinate (xi,yi) states the location
coordinate for every source of goods and the coordinate (x,y) states the location coordinate of warehouse. The Euclidean distance between the sources and the warehouse can be expressed by
. ) ( )
(x x 2 y y 2 Fi i i
n i
i i iW F
d TC
1
where di is cost of transportation for every ton of rice. The location of
warehouse is determined such that the total cost TC is minimum. Practically, the grid method is used by using the described procedure :
1. Suppose the concern area has minimum coordinate of x i.e. xmin and
maximum coordinate xmax. Interval (xmin, xmax) can be divided in sub-interval
with length 0.1 or less depend on the coordinate of location. In a similar way the concern area lays in interval (ymin, ymax) that can be divided in sub-interval
with length 0.01 or less. Finally, the coordinate of warehouse candidate (x,y) can be determined such that xmin < x < xmax and ymin < y < ymax.
2. The total cost of transportation TC for every coordinate of warehouse candidate (x,y) can be determined.
3. The chosen warehouse coordinate (x*,y*) will minimize the total cost.
TABLE I.TABLE PRODUCTION OF RICE AND POPULATION IN 2011
District Coordinate N
Coordinate E
Productio n of Rice in 2011
Populati on in 2011
Rice Need in
2011
Suplus/ Deficite
Ratatotok 0.876 124.695 452 12254 1323 -871
Posumaen 0.978 124.854 1890 8312 898 992
Belang 0.962 124.800 3776 15396 1663 2113
Ratahan 1.054 124.796 4705 12301 1329 3376
The proposed method will be described by using small data in Table I as follows. From Table I, it appears that Ratatotok district has a deficit of rice 871 tons of rice while other districts have a surplus of rice. Based on Table I, we choose the concern interval (0.8, 1.1) for x and (124.65, 124.90) for y. The intervals are divided in step 0.05 to obtain dots 0.80, 0.85, 0.90, 0.95, 1.00, 1.05, 1.10 and 124.65, 124.70, 124.75, 124.80, 124.85, 124.90. It means that, when the coordinate (0.9, 124.7) is used as the location of warehouse, it will provide a total cost TC that is proportional to TC* where
TC*871 (0.8760.9)2(124.695124.7
992 (0.9780.9)2(124.854124.7)2
2113 (0.9620.9)2(124.800124.7
3376 (1.0540.9)2(124.796124.7)2 = 1054.
chosen coordinate by using method of grid.
TABLE II. CALCULATION OF TC* FOR EVERY LOCATION OF (XA,YA).
If we want to determine two rice warehouses in Minahasa Tenggara Regency then the described method can be generalize. The total cost of transportation can be defined as follows
where d is the cost transportation for every ton (if this amount does not depend on the area). Thus, the total cost will only depend on
TABLE III. CALCULATION OF TC* FOR EVERY LOCATION OF (XA,YA)&(XB,YB).
No xA yA xB yB TC*
1 1.1 124.6 1.1 124.60 1685
2 1.1 124.6 1.1 124.65 1382
3 1.1 124.6 1.1 124.70 1110
….. ….. ……. ….. …. …..
2399 0.8 124.9 0.8 124.80 1495
2400 0.8 124.9 0.8 124.85 1562
2401 0.8 124.9 0.8 124.90 1702
3 Research Method
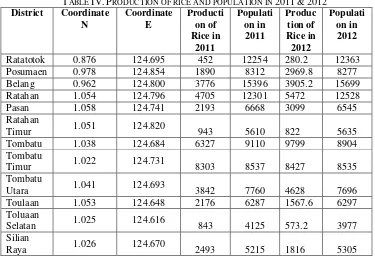
The data used is the production of rice and the total population in 2011 and 2012 in districts at Southeast Minahasa Recency obtained from the central bureau of statistics (BPS). Based on the data of rice production and the total population, it can be obtained the large supply of rice for each district in Table IV. Based on Table IV, the location will be determined such that the rice warehouse provide total distribution cost and supply of rice from the location of the barn to the location of the shortfall that is expressed in the minimum TC. This problem is extended to the case of determining two locations of wharehouse.
TABLE IV.PRODUCTION OF RICE AND POPULATION IN 2011&2012
District Coordinate N
Coordinate E
Producti on of Rice in
2011
Populati on in 2011
Produc tion of Rice in 2012
Populati on in 2012
Ratatotok 0.876 124.695 452 12254 280.2 12363
Posumaen 0.978 124.854 1890 8312 2969.8 8277
Belang 0.962 124.800 3776 15396 3905.2 15699
Ratahan 1.054 124.796 4705 12301 5472 12528
Pasan 1.058 124.741 2193 6668 3099 6545
Ratahan
Timur 1.051 124.820 943 5610 822 5635
Tombatu 1.038 124.684 6327 9110 9799 8904
Tombatu
Timur 1.022 124.731 8303 8537 8427 8535
Tombatu
Utara 1.041 124.693 3842 7760 4628 7696
Toulaan 1.053 124.648 2176 6287 1567.6 6297
Toluaan
Selatan 1.025 124.616 843 4125 573.2 3977
Silian
4 Result and Discussion
Based on data in Table IV, it can be obtained surplus/ shortage of rice for each districts in Southeast Minahasa district which is stated in Table V. Lack or excess rice based on the average requirement per person is 0.3 kg/person/day such that the need for all the population of each sub-district in one year can be calculated. Excess rice production is the difference between the districts with the need for rice in one year. In this case, one year is considered 360 days. Furthermore, by using these results and the described methods, it can be obtained location coordinates of warehouse at coordinates (1.03, 124.72) which will provide a minimum TC and proportional to 1652. In other words, these coordinates are the coordinates of 1o 1.8 N and 127o 43.2 E. These coordinates are in the area around East Tombatu district which have the highest rice production rice in Southeast Minahasa Regency.
If it is desired to create two rice warehouses in Southeast Minahasa Regency, then it will be obtained coordinates (xA, yA) = (1.04, 128.68) and (xB, yB)
= (1.02, 124.74) with TC proportional to 1085,979. In other words, the rice warehouses will be located at coordinates 1o 1.2 N, 128o 40.8 E and 1o 2.4 N, 124o 44.4 E. That means, the location of the first rice warehouse are in the area surrounding Tombatu district and second rice warehouse location is located in the area surrounding East Tombatu district.
TABLE V.TABLE PRODUCTION OF RICE AND POPULATION IN 2011&2012
District Coordinate N
Coordinate E
Rice Surplus
in 2011
Rice Surplus
in 2012
Average
Ratatotok 0.876 124.695 -871 -1055 -963
Posumaen 0.978 124.854 992 2076 1534
Belang 0.962 124.800 2113 2210 2161
Ratahan 1.054 124.796 3376 4119 3748
Pasan 1.058 124.741 1473 2392 1932
Ratahan
Timur 1.051 124.820 337 213 275
Tombatu 1.038 124.684 5343 8837 7090
Tombatu
Timur 1.022 124.731 7381 7505 7443
Tombatu
Utara 1.041 124.693 3004 3797 3400
Toulaan 1.053 124.648 1497 888 1192
Toluaan
Selatan 1.025 124.616 398 144 271
5 Conclussion
In this paper, we have already discussed how to determine the location of rice warehouse for one and two locations the location coordinates of sources and demand of rice in Southeast Minahasa Regency, North Sulawesi, Indonesia. If it is desired to make one warehouse then it will be obtained in location coordinates 1o 1.8 N, 127o 43.2 E which is located in areas around East Tombatu districts. If it is desired to make two warehouses then it will be obtained in location coordinates 1o 2.4 N, 128o 40.8 E which is located in areas around Tombatu district and 1o 1.2 N, 124o 44.4 E which is located in the area around East Tombatu. In the future, the next research can be extended to more than 2 locations of rice warehouse and by using fuzzy theory.
References
[1] Armenia Resty, 2015, Jokowi Siapkan Lumbung Padi Nasional di Merauke, CNN Indonesia Jumat, 05/06/2015 22:18 WIB, download from :http://www.cnnindonesia.com/nasional/
20150605221843-20-58050/jokowi-siapkan-lumbung-padi-nasional-di-merau ke/ is downloaded at : 5 Agustus 2015.
[2] Poesponegoro Marwati Dj., Nugroho Noto Susanto, 2008, Sejarah Nasional Indonesia IV, Kemunculan Penjajahan di Indonesia, Balai Pustaka, Jakarta. [3] Sediyono, E., I. R. Widiasari, Milasari, 2006, Penentuan Lokasi Fasilitas
Gudang Menggunakan Fuzzy C-means (FCM), Jurnal Informatika Vol. 2 No. 2 Hal 155-166.
[4] Heizer Jay, Barry Render, 2013, Principles of Operations Management, 9th Edition, Prentice Hall, London.