Full Terms & Conditions of access and use can be found at
http://www.tandfonline.com/action/journalInformation?journalCode=vjeb20
Journal of Education for Business
ISSN: 0883-2323 (Print) 1940-3356 (Online) Journal homepage: http://www.tandfonline.com/loi/vjeb20
Do Business Communication Courses Improve
Student Performance in Introductory Marketing?
Leah E. Marcal , Judith E. Hennessey , Mary T. Curren & William W. ROBERTS
To cite this article: Leah E. Marcal , Judith E. Hennessey , Mary T. Curren & William W. ROBERTS (2005) Do Business Communication Courses Improve Student Performance in Introductory Marketing?, Journal of Education for Business, 80:5, 289-294, DOI: 10.3200/JOEB.80.5.289-294 To link to this article: http://dx.doi.org/10.3200/JOEB.80.5.289-294
Published online: 07 Aug 2010.
Submit your article to this journal
Article views: 20
View related articles
ationwide, faculty members have lamented that students’ writing skills are weak. This is a major concern for marketing faculty members because communication skills are considered critical to marketing success. Extensive research has shown that employers con-sider communication skills to be among the most necessary critical skills for marketing and business majors (Young & Murphy, 2003). According to Smart, Kelley, and Conant (1999), “Many [marketing] professors who discussed skill issues indicated that their schools had been actively seeking to improve student writing . . .” (p. 210). Comple-tion of the business communicaComple-tions course may be one way to ensure that students have the knowledge and skills needed to succeed in marketing courses. Prerequisites are standard in college curricula and establish the precondi-tions for course enrollment. Prerequi-sites may include specific courses, aca-demic status, and tests of preparedness. Such prerequisites perform two distinct, yet related, functions. First, they can be used as a filter that prevents program continuation. Second, they can serve as a measure of course preparedness. As a filter, prerequisites may improve course performance by eliminating weak stu-dents. As a measure of preparedness,
valid prerequisites should increase the likelihood for success.
As preparation, prerequisites signal the set of entering skills that are required for successful course comple-tion. Designated prerequisites are part of program design and course sequenc-ing. With pressure from regional and international accrediting agencies for increased program assessment, the effect of prerequisites on student out-comes beout-comes increasingly important. Currently, the State of California man-dates validation and reevaluation of community-college course prerequi-sites.1In this study, we used regression
and categorical modeling techniques to
determine whether a business communi-cations course should be a requirement for students who enroll in the marketing course.
Literature Review
Numerous researchers have analyzed the effects of quantitative prerequisites on course performance. Analysis of stu-dent performance in introductory eco-nomics dominates the literature. For example, Anderson, Benjamin, and Fuss (1994) found that a high school calculus course was significant in predicting per-formance in basic economics. Cohn, Cohn, and Bradley (1998) also found math skills were important but ques-tioned math as a prerequisite, arguing that evidence from other courses or SAT performance could suffice. Ely and Hit-tle (1990) found that performance in business finance was improved by com-pletion of accounting courses and was not influenced by mathematical back-ground. Marcal and Roberts (2001) found that students who satisfy a busi-ness statistics requirement received higher grades in the financial manage-ment course.
Most of the remaining studies investi-gate how course or individual character-istics affect student success. For
exam-Do Business Communication
Courses Improve
Student Performance in
Introductory Marketing?
LEAH E. MARCAL JUDITH E. HENNESSEY
MARY T. CURREN WILLIAM W. ROBERTS
California State University, Northridge Northridge, California
N
ABSTRACT. In this study, the authors investigated whether comple-tion of a business communicacomple-tions course improved student performance in an introductory marketing manage-ment course. Regression analysis indi-cated that students who completed the communications course received high-er grades than the othhigh-erwise compara-ble students. In addition, marketing majors and students with high college grade point averages (GPAs) earned better grades in the marketing course. After controlling for college GPA, the authors found that log-linear analysis supported the regression findings by showing a partial association between the grades in marketing and comple-tion of the communicacomple-tions course.
ple, Henebry (1997) considered the importance of class schedule and found that students were more likely to pass a financial management course if it met more than once a week. Horvath, Beaudin, and Wright (1992) investigated gender differences in course persistence and found that female students were less likely to persist in the introductory eco-nomics course sequence. In one of the few studies analyzing student outcomes in introductory marketing, Borde (1998) found that students with high college GPAs earned better grades, whereas community college transfer students and students with employment commit-ments earned lower grades.
Method
The sample for this project consisted of students from a large public univer-sity in Southern California. California State University at Northridge (CSUN) has over 26,000 students and almost 6,000 business majors. In our study, we analyzed course outcomes for students enrolled in Introductory to Marketing Management (MKT 304) over a 3-year period. This course is a typical 3-unit, semester-long, junior business market-ing class designed to increase students’ knowledge of marketing management’s role in a firm’s business strategy. Com-pletion of the required, 3-unit Business Communications course (Buscom) prior to enrollment in MKT 304 is encour-aged. Buscom introduces students to techniques for developing oral and writ-ten communication skills adapted to business situations. Marketing faculty members often assert that these commu-nication skills are essential for
comple-tion of assignments in the marketing course. However, only 42% of the stu-dents in this sample had completed the business communications course before taking MKT 304.
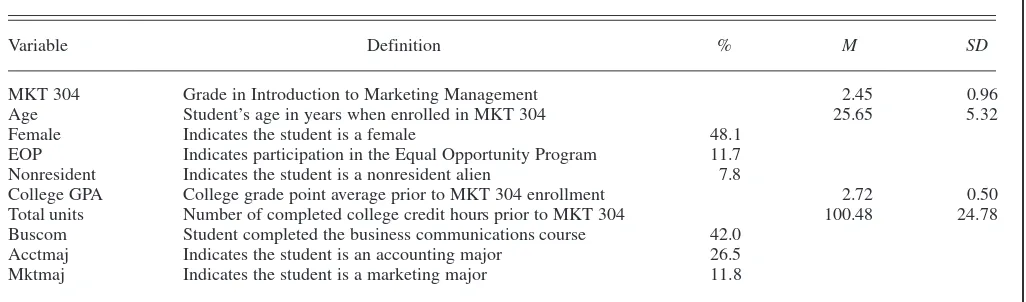
The analysis sample consisted of 3,280 students who earned a grade in MKT 304 between spring 1996 and fall 1998. We collected data on student characteristics before their enrollment in this course and collected their grades in the course at the semester’s end. The average age of students enrolled in MKT 304 was just under 26 (see Table 1). Course enrollment was balanced in terms of gender: Forty-eight percent of the students were women. The mean college GPA was 2.7 after the students’ completion of 100 units.
Results
Ordered Probit Analysis
We estimated an ordered probit model to determine whether students who completed the business communi-cations course obtained higher grades in the marketing class. The specification for the model was as follows:
MKT304* = â’x + å, and å ~ N[0,1]
,
where MKT304* is the unobserved con-tinuous grade scale that underlies the students’ course grades, and x is the vector of explanatory variables. The let-ter grades were coded so that F = 0, D = 1, C = 2, B = 3, and A = 4.2 These
observed grades were related to the unobserved grading scale in the follow-ing manner:
MKT304 = 0 if MKT304* ≤ 0, MKT304 = 1 if 0 < MKT304* ≤ ì1,
MKT304 = 2 if ì1< MKT304* ≤ ì2, MKT304 = 3 if ì2< MKT304* ≤ ì3, MKT304 = 4 if ì3< MKT304*.
The µ’s are threshold parameters that provide the ranking in the model and are estimated with the beta coefficients.
The estimation results (µ and β) allow a calculation of the conditional probability that a student receives a par-ticular letter grade given her character-istics (x). The probabilities for each of the five letter grades are as follows:
Prob(MKT304 = 0) = Ö(–â´x), Prob(MKT304 = 1) = Ö(ì1– â´x) –
Ö(– â´x),
Prob(MKT304 = 2) = Ö(ì2– â´x) – Ö(ì1– â´x),
Prob(MKT304 = 3) = Ö(ì3– â´x) – Ö(ì2– â´x),
Prob(MKT304 = 4) = 1 – Ö(ì3– â´x),
where Φis the cumulative standard nor-mal distribution.
We assumed that student perfor-mance in the marketing course would be influenced by personal characteristics, past achievement in college courses, completion of the business communica-tions course, and choice of major. We included information on each student’s age, gender, and equal-opportunity and nonresident-alien status in the regres-sion. College grade point average and total units completed comprised past achievement in college courses. We dis-tinguished accounting and marketing majors from other business majors (see Table 1).
We report the regression results in Table 2.3 Our findings indicate that
TABLE 1. Variable Definitions and Descriptive Statistics (N= 3,280)
Variable Definition % M SD
MKT 304 Grade in Introduction to Marketing Management 2.45 0.96 Age Student’s age in years when enrolled in MKT 304 25.65 5.32 Female Indicates the student is a female 48.1
EOP Indicates participation in the Equal Opportunity Program 11.7 Nonresident Indicates the student is a nonresident alien 7.8
College GPA College grade point average prior to MKT 304 enrollment 2.72 0.50 Total units Number of completed college credit hours prior to MKT 304 100.48 24.78 Buscom Student completed the business communications course 42.0
Acctmaj Indicates the student is an accounting major 26.5 Mktmaj Indicates the student is a marketing major 11.8
TABLE 2. Ordered Probit Analysis of MKT 304 Grade
Variable r SE t Mof X
Constant –2.690 0.147 –18.35
Age 0.007* 0.003 1.94 25.65
Female –0.006 0.039 –0.16 0.48
EOP –0.167** 0.062 –2.67 0.12
Nonresident –0.292** 0.069 –4.20 0.08
College GPA 1.564** 0.043 36.61 2.72
Total units 0.006** 0.001 6.86 100.48
Buscom 0.190** 0.043 4.41 0.42
Acctmaj 0.049** 0.045 1.09 0.27
Mktmaj 0.213** 0.064 3.31 0.12
Mu(1) 0.999 0.045 22.21
Mu(2) 2.397 0.050 47.56
Mu(3) 3.869 0.058 66.79
Sample size 3,280
Log likelihood (Ln) –3,685.04 Restricted Ln –4,461.62
χ2 1,553.16
Actual versus Fpredicted grades
Actual Predicted MKT 304 grade frequency probability
0 0.030 0.008
1 0.117 0.074
2 0.361 0.421
3 0.359 0.428
4 0.133 0.070
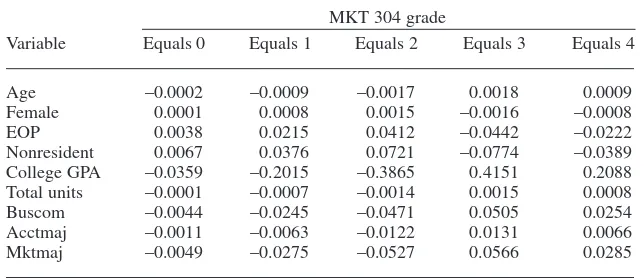
Marginal effects of the regressors
MKT 304 grade
Variable Equals 0 Equals 1 Equals 2 Equals 3 Equals 4
Age –0.0002 –0.0009 –0.0017 0.0018 0.0009 Female 0.0001 0.0008 0.0015 –0.0016 –0.0008 EOP 0.0038 0.0215 0.0412 –0.0442 –0.0222 Nonresident 0.0067 0.0376 0.0721 –0.0774 –0.0389 College GPA –0.0359 –0.2015 –0.3865 0.4151 0.2088 Total units –0.0001 –0.0007 –0.0014 0.0015 0.0008 Buscom –0.0044 –0.0245 –0.0471 0.0505 0.0254 Acctmaj –0.0011 –0.0063 –0.0122 0.0131 0.0066 Mktmaj –0.0049 –0.0275 –0.0527 0.0566 0.0285
Note. Dependent variables = MKT 304 grade. *p= .05 (two-tailed). **p= .01 (two-tailed).
There were some other interesting results. First, we expected older and more experienced college students to obtain higher grades in MKT 304. Each year of age increased the likelihood of receiving better grades in the marketing course. The number of completed units also had a positive effect on student suc-cess in marketing.
We included gender in the regression because some researchers have found that male gender was a significant predictor of student success in economics and finance courses (Anderson et al., 1994; Borde, Byrd, & Modani, 1998). However, Borde (1998) found that gender did not influ-ence student performance in the introduc-tory marketing course. Our results also suggest that gender did not affect market-ing grades. The coefficient on female gender was small, negative, and statisti-cally insignificant.
CSUN has a large minority enroll-ment. Many of these students speak English as a second language. Our best measures to capture this population were participation in the university’s Equal Opportunity Program (EOP) and status as a nonresident alien. Many EOP par-ticipants are first-generation college stu-dents and frequently come from homes where English is seldom spoken. Our findings indicate that EOP participants and students with nonresident alien sta-tus earned lower grades in marketing.
Students with higher college grade point averages (GPA) earned better grades in MKT 304. The coefficient on college GPA was large, positive, and statistically significant. Moreover, the marginal effects indicate that holding a higher GPA reduced the probability of receiving a C, D, or F, while substan-tially increasing the probability of receiving an A or B. This finding is con-sistent with previous pedagogical research in marketing and economics courses (Borde, 1998; Brasfield, Harri-son, & McCoy, 1993; Von Allmen, 1996) and confirms that previous cess is a good predictor of future suc-cess in college courses.
College GPA was our best measure of student ability. The regression did not include Scholastic Aptitude Test (SAT) scores or high school GPA because 74% of the students in our sample were miss-ing this information.4However, in
sepa-completion of the business communica-tions course (Buscom) improved stu-dent performance in marketing. The marginal effects suggest that students who completed Buscom before the mar-keting course were 7.6% more likely to receive a grade of A or B in MKT 304 than otherwise comparable students. Development of skills in the communi-cations course may have helped the
stu-dents complete the classroom discus-sions, case analyses, and written and oral presentations that are typically required in the marketing course. Alter-natively, students with weak communi-cation skills may have delayed taking Buscom. If so, completion of business communications may signal better stu-dents who would have received higher grades in marketing without the course.
Log-linear analysis will not handle continuous variables, so we “catego-rized” college GPA. The variable G indicates whether a student has a col-lege GPA that exceeds 2.72, which was the median GPA in our analyzed sam-ple.7We explored numerous alternative
categories for G. Unfortunately, any expansion in the number of categories for G produced frequency tables with several cells having very few counts.
The first model in Table 3 includes main effects without interactions between the variables. This “independence” model indicates that there was no associ-ation between the three variables M, G, and B. The likelihood ratio (L.R.) shows the “goodness-of-fit.” Here, it was 1,080.1 units, which means that the inde-pendence model could not be accepted.
Model 2 includes main effects with an interaction between G and B with no effect on M. This model indicates that G and B were associated but that neither variable was associated with M. The large L.R. statistic shows that this is a poor model for predicting the observed cell frequencies.
Model 3 includes main effects with an interaction between G and M with no effect of B on M. Model 3 is a signifi-cant improvement over Model 2 (1,039.8 – 112.5 with 4 degrees of free-dom). However, the goodness-of-fit at 112.5 is not a good fit. The improve-ment of fit, however, does suggest that the two variables M and G should not be treated as independent.
Model 4 includes main effects and all two-way interactions. This model indi-cates that there was a partial association between M and G, controlling for B; and a partial association between M and B, controlling for G. This model most closely resembles our ordered probit regression. The improvement of fit (112.5 – 3.6 with 4 degrees of free-dom) suggests that the two variables M and B should not be treated as indepen-dent. The L.R. statistic—3.6—is low, and the goodness-of-fit is not signifi-cantly different from zero, which means that this model is acceptable.
Model 5 is the saturated model, which adds the hypothesis that there is an inter-action of G and B in their effects on M. In general, it is not a good idea to accept the saturated model when a simpler ing and marketing majors in the MKT
304 course. CSUN faculty members often have stated that accounting majors perform better than other business majors in nonaccounting business courses. Accounting majors need to earn a higher GPA (3.0) than other busi-ness students (2.0) to enter the program and remain in good standing. However, our results suggest that accounting majors earn grades similar to those of other business majors in MKT 304. Our results also indicate that marketing majors were 8.5% more likely to earn an A or B in MKT 304 than otherwise comparable business majors. This is not surprising, because these students have selected themselves into the marketing major on the basis of their ability and interest in the subject matter.
Log-Linear Analysis
We checked the ordered probit regression results with a more conser-vative hierarchical log-linear modeling procedure. Like linear regression, the ordered probit model makes a clear dis-tinction between the dependent variable and the explanatory variables. This model is well suited for testing hypothe-ses about the coefficients and
differ-counts in a table are not identical, a ran-domly chosen observation has different probabilities of belonging to the various cells. Log-linear models propose that the logarithm of a cell probability can be modeled as a linear combination of parameters. The dependent variable is the number of observations (frequency) in a cell (Upton, 1991).
The procedure estimates maximum likelihood parameters of hierarchical log-linear models using the Newton-Raphson Method (Bishop, Feinberg, & Holland, 1995). Through this proce-dure, one can examine the ordered impacts of model variables proceeding from the independence model to the highest-way interaction (i.e., saturated model), while exploring each model in between for goodness-of-fit.
In Table 3, we present the log-linear results. Each of the five models contains the two variables of primary interest— MKT 304 (M) and Buscom (B)—along with college GPA. We confined our attention to these three variables to pro-duce a contingency table having very few cells with zero counts.6We selected
col-lege GPA as the third variable because it is our best measure of student ability and it had the largest effect on MKT 304 grades in the ordered probit results. rate regression results (not reported),
the inclusion of SAT scores and high school GPA did not alter these findings in a substantive manner. In particular, the marginal effect of Buscom was still strong, positive, and statistically signifi-cant.5 If completion of business
com-munications simply signals more capa-ble students, then the inclusion of SAT scores should substantially reduce the marginal effect of Buscom.
Finally, the ordered probit regression accounted for the presence of
account-ences among probabilities, but it is poorly suited for testing for indepen-dence. In contrast, log-linear models treat all variables as “dependent.” These models emphasize model building, goodness-of-fit tests, and estimation of cell frequencies in a contingency table. It is easy to test for independence with log-linear models.
The log-linear model analyzes the frequency counts of observations falling into each cross-classification category in a contingency table. Because the cell
However, our results suggest that accounting
majors earn grades similar to those of other
business majors in MKT 304.
model will fit the data. The improvement of fit from adding the three-way interac-tion was not significant (3.6 – 0 with 4 degrees of freedom), which led us to conclude that Model 4 is our best model.
Conclusion
In this study, we employed regression and categorical modeling techniques to determine whether a business communi-cations course improved student perfor-mance in introductory marketing. Our results indicate that students who com-pleted the business communications course beforehand earned better grades in MKT 304 than those who did not. The evidence suggests that a business communications prerequisite would improve student performance in the marketing course.
After we collected the data for this study, the business communications course was reclassified as a freshman-level class. Additionally, all lower divi-sion business requirements, including the business communications course, must now be completed before business students can take any junior-level core class, including MKT 304. These new rules have been in effect for only 1 year. The minors in marketing, who are non-business majors, will continue to take MKT 304 without the business commu-nications course. If the business com-munications course leads to a better grade in MKT 304, then student grades should improve for the business stu-dents only. In the future, researchers should focus on analysis of the relative
change in grades predicted as (a) a test of the validity of the models proposed and (b) a test of the extent to which the models proposed can be generalized. In other words, do our results apply to nonbusiness majors as well?
There are administrative costs as well as costs to students whenever prerequi-sites are instituted and enforced. In this study, we established an approach for quantifying the value of a proposed pre-requisite. It seems reasonable to recom-mend that instructors and curriculum designers conduct similar studies when they are considering the introduction of new prerequisites.
NOTES
1. California Code of Regulations §55201. 2. Actual grades include plus and minus grades. We collapsed the grades onto this 5-point scale for several reasons. First, plus/minus grading is not uniformly applied by the faculty members. Sec-ond, including plus/minus grades does not pro-duce the continuous grade scale necessary for lin-ear regression. Third, the use of plus/minus grades creates 12 grade categories and is therefore cum-bersome to report. Moreover, the findings are sim-ilar with the use of 12 grade categories.
3. The estimated coefficients of the explanatory variables in an ordered probit regression are not the marginal effects normally interpreted in a lin-ear regression model. If we let Pjrepresent the probability of receiving a j grade (e.g., j = 0 is an F), then calculation of the marginal effects is:
∂Pj/∂xi= [f(µj-1– β’xi) – f(µj– β’xi)] × β, where f is the standard normal density. It is clear that the marginal effects will vary with the values of x. The data in Table 2 contain the mar-ginal effects calculated at the means of the regres-sors (x). It is worth noting that the marginal effects are multiples of the coefficient vector. Thus, the magnitudes of the marginal effects are likely to be very different from the beta coefficients. See Greene (1993, pp. 672–676) for a discussion of this regression technique.
4. More than 70% of our students transfer from local community colleges, and the university does not require SAT scores or high school GPAs for these students.
5. Performing the identical regression reported in Table 2 on the smaller sample of students who have SAT scores and high school GPAs (n= 855), we found that students who completed the business communications course were 4.0% more likely to receive an A or a B in MKT 304. Adding two vari-ables—combined SAT score and high school GPA—to this regression suggests that students who completed the communications course were 3.5% more likely to earn an A or B in MKT 304. The impact of Buscom may be lower (4.0 versus 7.6) for this smaller sample (n= 855) because these stu-dents entered CSUN as freshmen and had better communication skills than students who had to transfer from local community colleges.
6. It is important to limit the number of variables
andthe number of categories for each variable to produce a table having very few cells with zero counts. Tables with zero counts lead to insensitive tests of the hypotheses and numerous theoretical problems. Please see the article by Upton (1991) for further discussion of the log-linear model.
7. It is the convention in log-linear analysis to name variables with only one letter.
REFERENCES
Anderson, G., Benjamin, D., & Fuss, M. A. (1994). The determinants of success in univer-sity introductory economics courses. Journal of
Economic Education, 25(2), 99–119.
Bishop, Y. M. M., Feinberg, S. E., & Holland, P. W. (1995). Discrete multivariate analysis:
The-ory and practice(12th ed.). Cambridge, MA:
MIT Press.
Borde, S. F. (1998). Predictors of student academ-ic performance in the introductory marketing course. Journal of Education for Business, 73(5), 302–306.
Borde, S. F., Byrd, A. K., & Modani, N. K. (1998). Determinants of student performance in intro-ductory corporate finance courses. Journal of
Financial Education, 24(Fall), 23–30.
Brasfield, D. W., Harrison, D. E., & McCoy, J. P. (1993). The impact of high school economics on the college principles of economics course.
Journal of Economic Education, 24(2), 99–111.
Cohn, E., Cohn, S., & Bradley, J, Jr. (1998). The effects of mathematics background on student learning in principles of economics. Journal of
Education for Business, 74(1), 18–22.
Ely, D. P., & Hittle, L. (1990). The impact of math background on performance in managerial eco-nomics and basic finance courses. Journal of
Financial Education, 19(2), 59–61.
Greene, W. H. (1993). Econometric analysis(2nd ed.). New York: Macmillan.
Henebry, K. (1997). The impact of class schedule on student performance in a financial manage-ment course. Journal of Education for
Busi-ness, 73(2), 114–120.
Horvath, J., Beaudin, B. Q., & Wright, S. P. (1992). Persisting in the introductory economics course: An exploration of gender differences. Journal of
Economic Education, 23(2), 101–108.
Marcal, L., & Roberts, W. (2001). Business statis-tics requirements and student performance in financial management. Journal of Financial
Education, 27(1), 29–35.
Smart, D. T., Kelley, C. A., &. Conant, J. S. (1999, December). Marketing education in the year 2000: Changes observed and chal-lenges anticipated. Journal of Marketing
TABLE 3. Hierarchical Log-Linear Models (N= 3,280)
Likelihood
Model Label df ratio pvalue
1. Independence M, G, B 13 1,080.1 0.00 2. No effects on M M, GB 12 1,039.8 0.00 3. No effect of B on M MG, GB 8 112.5 0.00 4. All two-way effects MG, GB, MB 4 3.6 0.47
5. Saturated MGB 0 0.0 1.00
Note. Each model is represented by a label referring to the three dependent variables M, G, and B. Conditionally dependent variables appear together in the label with no comma between them. The five models are hierarchical because a model that contains higher order effects must also contain lower order effects. Because model 5 allows MGB, it must also allow M, G, B, MG, GB, and MB. M = grade in MKT 304 (possible values: 0, 1, 2, 3, 4); G = student’s college GPA ≥2.72 (possible values: 0, 1); B = student completed the business communication course (possible values: 0, 1).
Education, 2, 206–216.
Upton, G. J. G. (1991). The exploratory analysis of survey data using log-linear models. The
Sta-tistician, 40(1), 169–182.
Von Allmen, P. (1996). The effect of quantitative prerequisites on performance in intermediate microeconomics. Journal of Education for
Business, 72(1), 18–22.
Young, M. R., & Murphy, W. (2003). Integrating communications skills into the marketing cur-riculum: A case study. Journal of Marketing
Education, 25(1), 57–70.