Full Terms & Conditions of access and use can be found at
http://www.tandfonline.com/action/journalInformation?journalCode=ubes20
Download by: [Universitas Maritim Raja Ali Haji] Date: 12 January 2016, At: 23:27
Journal of Business & Economic Statistics
ISSN: 0735-0015 (Print) 1537-2707 (Online) Journal homepage: http://www.tandfonline.com/loi/ubes20
Comment
Federico M Bandi & Jeffrey R Russell
To cite this article: Federico M Bandi & Jeffrey R Russell (2006) Comment, Journal of Business & Economic Statistics, 24:2, 167-173, DOI: 10.1198/073500106000000107
To link to this article: http://dx.doi.org/10.1198/073500106000000107
Published online: 01 Jan 2012.
Submit your article to this journal
Article views: 52
View related articles
cently, Goncalves and Meddahi (2005) developed an Edgeworth expansion for the basic RV estimator when there is no noise. Their expansion applies to the studentized statistic based on the standard RV estimator and is used to assess the accuracy of the bootstrap in comparison to the first-order asymptotic approach. Complementary to that work is our earlier work Zhang et al. (2005a), where we develop an Edgeworth expansion for non-studentized statistics for the standard RV, TSRV, and other es-timators but allow for the presence of microstructure noise. It would be interesting to know how the autocovariance-corrected RV estimators behave in small samples and, if need be, investi-gate the feasibility of Edgeworth corrections for them.
ADDITIONAL REFERENCES
Jacod, J., and Shiryaev, A. N. (2003),Limit Theorems for Stochastic Processes (2nd ed.), New York: Springer-Verlag.
Zhang, L. (2001), “From Martingales to ANOVA: Implied and Realized Volatil-ity,” unpublished doctoral thesis, University of Chicago, Dept. of Statistics. Zhang, L., Mykland, P. A., and Aït-Sahalia, Y. (2005a), “Edgeworth Expansions
for Realized Volatility and Related Estimators,” NBER Technical Working Paper 319, National Bureau of Economic Research.
(2005b), “A Tale of Two Time Scales: Determining Integrated Volatil-ity With Noisy High-Frequency Data,”Journal of the American Statistical Association, 100, 1394–1411.
Zhou, B. (1998), “F-Consistency, De-Volatization and Normalization of High-Frequency Financial Data,” inNonlinear Modelling of High Frequency Fi-nancial Time Series, eds. C. L. Dunis and B. Zhou, New York: Wiley, pp. 109–123.
Comment
Federico M. B
ANDIGraduate School of Business, University of Chicago, 5807 South Woodlawn Ave., Chicago, IL 60637 (federico.bandi@gsb.uchicago.edu)
Jeffrey R. R
USSELLGraduate School of Business, University of Chicago, 5807 South Woodlawn Ave., Chicago, IL 60637 (jeffrey.russell@gsb.uchicago.edu)
1. INTRODUCTION
If efficient asset prices follow continuous semimartingales and are perfectly observed, then their quadratic variation can be measured accurately from the sum of a large number of squared returns sampled over very finely spaced intervals, that is, realized variance (Andersen, Bollerslev, Diebold, and Labys 2003; Barndorff-Nielsen and Shephard 2002). With the emer-gence of high-frequency data, it seems that we should be able to identify volatility rather easily; however, this identification hinges on being able to observe the true (or efficient) price process. Unfortunately, observed asset prices are affected by market microstructure effects, such as discreteness, different prices for buyers and sellers, “price impacts” of trades, and so forth. If we think of observed logarithmic prices as effi-cient logarithmic prices plus logarithmic market microstruc-ture noise contaminations, then we face an interesting as well as complex econometric task in using high-frequency data to estimate quadratic variation from noisy observed asset price data.
Hansen and Lunde make several important contributions to this growing body of literature. First, they document empir-ical evidence regarding the dynamic features of microstruc-ture noise. Second, they propose a clever procedure to remove microstructure-induced biases from realized variance estimates. We start by giving intuition for their proposed estimation method. We then turn to a point-by-point discussion of their empirical findings regarding the properties of the noise. We conclude by providing our views on the current status of the nonparametric literature on integrated variance estimation.
2. THE METHODOLOGY
Assume the availability ofM+1 equispaced price observa-tions over a fixed time span[0,1](a trading day, say), so that the distance between observations isδ=M1. Write an observed logarithmic pricep˜jδas the sum of an equilibrium logarithmic
price pejδ and a market microstructure-induced departure ηjδ,
namely
˜
pjδ=pejδ+ηjδ, j=0, . . . ,M. (1)
Both pejδ and ηjδ are not observed by the econometrician. In
the remainder of this comment we frequently refer to ηjδ as
the “noise” component. Equivalently, in terms of continuously compounded returns,
In its general form, the estimator that Hansen and Lunde ad-vocate is in the tradition of robust covariance estimators, such as that of Newey and West (1987). Write
© 2006 American Statistical Association Journal of Business & Economic Statistics April 2006, Vol. 24, No. 2 DOI 10.1198/073500106000000107
where qM is a frequency-dependent number of covariance terms. The first term on the right side of (3) is the classical realized variance estimator, and the second term is a correc-tion intended to make the estimator unbiased for the integrated variance of the underlying price process in the presence of cor-related noise. If the correlation structure of the noise return process is finite and the efficient price is a local martingale, then the estimator in (3) is unbiased for the integrated variance of the efficient price process over [0,1] (i.e., V =01σs2ds), under appropriate conditions on qM. Interestingly, the finite-sample unbiasedness of Hansen and Lunde’s estimator is robust to the presence of some dependence between the underlying lo-cal martingale price process and market microstructure noise.
Consider, for simplicity, the iid market microstructure noise case with noise independent of the underlying price process. Specifically, impose Hansen and Lunde’s assumptions 1 and 3. Furthermore, setqM=1 to obtain
V1=
Consider now the iid market microstructure noise case with noise dependent on the underlying price process. However, as-sume that EM(rejδη(j−s)δ)=0 for allj and alls≥1 (i.e.,
mi-crostructure noise does not predict future efficient returns) and thatEM(rjeδη(j+1)δ)=0 for allj. The bias of the realized
vari-ance estimator is now equal to
2
which again provides the necessary finite-sample bias correc-tion in the case of noise dependent on the price process.
The proposed estimator is theoretically interesting and, we believe, empirically useful. The cancellation that gives rise to
bias-corrected integrated variance estimates, even in the pres-ence of some correlation between the noise component and the underlying efficient price process, is clever.
The frequency δ at which to sample continuously com-pounded returns for the purpose of integrated variance estima-tion through nonparametric estimates (likeVqM) can be chosen optimally. This point has been made in recent research and es-timable mean squared error (MSE) expressions for various non-parametric variance estimators have been provided (see Bandi and Russell 2005a,b; Zhang, Mykland, and Aït-Sahalia 2005). Hansen and Lunde expand on this framework by considering an optimal (in an MSE sense) frequencyδ∗for their first-order bias-corrected estimatorV1in the case of (1) iid noise with (2) noise independent of the price process. As shown earlier, the validity of their bias correction does not rely on (1) and (2) in general.
3. THE PROPERTIES OF MICROSTRUCTURE NOISE
Hansen and Lunde summarize their findings about the prop-erties of the noise in their introduction as follows:
• The noise is correlated with the efficient price.
• The noise is time-dependent.
• The noise is small.
• The noise has changed over time.
In this section of our comment we expand on these results and discuss them point by point.
3.1 The Noise Is Correlated With the Efficient Price
Hansen and Lunde study the relation between efficient price and noise from an interesting new perspective. (For a discus-sion of early work on this subject, see Hasbrouck 2006.) As they point out, this relation has important theoretical and em-pirical implications for integrated variance estimation. This is a difficult relation to assess since the equilibrium prices and the noise components embedded in the observed asset prices are inherently unobserved [see (1)]. Hansen and Lunde largely use “signature plots” to study this relation. Signature plots are plots of realized variance versus the sampling frequencyδ= M1 or, equivalently, versus the number of returnsM (Andersen et al. 2000b). The idea is simple. Assume thatEM(rejδη(j−s)δ)=0 for
alljand alls≥1, as earlier. Consider the expected value of the realized variance estimator,
If the noise is independent of the efficient price [i.e., if
EM(rejδηjδ)=0], then realized variance becomes large asδ→0
(or M → ∞), because MEM(εj2δ)→ ∞. If the noise is neg-atively correlated with the efficient price, then realized vari-ance might not increase at high frequencies, becauseEM(rjeδηjδ)
andEM(ε2jδ)operate in opposite directions. Hansen and Lunde
report several signature plots that are not upward-sloping with increasing sampling frequency. These plots refer mainly to NYSE mid-quote price data for a sample of Dow Jones stocks.
We point out that if the efficient price constantly evolves, then factors inducing stickiness in the observed prices p me-˜
chanicallydetermine a negative dependence between the un-observed components of the un-observed prices,peandη. This is due simply to the fact that any time the observed price remains fixed, any changes in the efficient price must be perfectly offset by movements in the opposite direction in the noise component. Hence important aspects of the dependence between the effi-cient price and the noise, as well as aspects of the conditional and unconditional properties of the noise, can be understood by considering the factors inducing stickiness in the observed prices, primarily the market structure, how prices are defined, and the method used to sample prices.
Market Structure. The market structure, or rules of trade, will impact the features of the noise. Assume thatp˜ refers to quotes. If agents arrive in a random fashion with differing per-ceptions of the value of an asset and different motives, then con-tinual random adjustments to the posted prices are expected to be made. These random price adjustments should induce noise components that are roughly uncorrelated with the underlying efficient price. This structure is consistent with, for instance, foreign exchange markets, at which banks around the world post quotes. Alternatively, specialist-driven markets, such as the NYSE, are more centralized, with a single agent posting quotes. Without the setting of prices by multiple agents with dissenting views, the observed prices can remain fixed for longer dura-tions. This results in stickiness in the posted quotes (thep˜’s in our framework), thereby contributing to the negative correla-tion between efficient returns and noise returns as documented by Hansen and Lunde. Interestingly, by combining quotes from multiple exchanges, one can replicate the random price-setting behavior of a more decentralized market.
Here we consider the foreign exchange market and NASDAQ as examples of fairly decentralized markets. The NYSE is used as an example of a relatively centralized market.
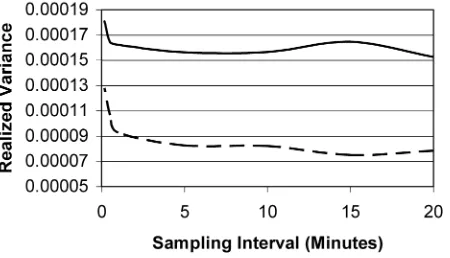
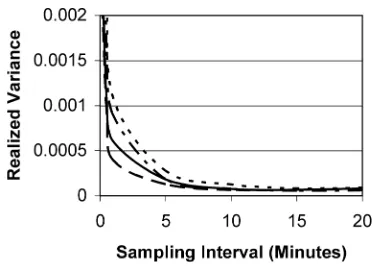
Figure 1 presents calendar time mid-quote variance plots for the deutchmark/dollar and yen/dollar exchange rates. The data is 5-minute data from all Tuesdays, Wednesdays, and Thurs-days in the year 1996. Figure 2 presents calendar time mid-quote variance plots for Cisco and Microsoft. Figure 3 presents calendar time mid-quote variance plots for IBM and GE using NYSE and NYSE and MIDWEST. Figure 4 presents calendar
Figure 1. Mid-Quote Variance Signature Plots for Deutchmark/Dollar ( ) and Yen/Dollar ( ) Exchange Rate Data for All Tues-days, WednesTues-days, and Thursdays in 1996.
Figure 2. Calendar Time Mid-Quote Variance Signature Plots for the NASDAQ Stocks Cisco Systems ( ) and Microsoft ( ).
time mid-quote variance plots for IBM and GE using NYSE and NASDAQ and the consolidated market.
Figure 3 confirms Hansen and Lunde’s observation. Mid-quotes posted on the NYSE have a residual noise component that is negatively related to the unobserved efficient price com-ponent. This negative correlation can be mechanically induced by relatively stable quotes in a specialist-driven market. In the other cases, the signature plots are upward-sloping at high fre-quencies. The negative correlation between noise and efficient price is dominated, sometimes strongly so, by the second mo-ment of the noise component. When dealing with quotes, we find support for this result in the foreign exchange market (our highest frequency here is only 5 minutes, due to data limi-tations), in the case of NASDAQ, as well as in the case of combined quotes from multiple exchanges such as the NYSE and the Midwest, for instance. This result is particularly strong when considering the consolidated U.S. market.
Price Measurement. The noise associated with bid–ask mid-quotes is different from the noise associated with transac-tion prices. Even within centralized markets, the price forma-tion mechanism leading to observed trade prices differs from the mechanism leading to posted quotes. The former change more randomly than the latter in that they are more strongly affected by the random arrival of agents in the marketplace.
Figure 3. Calendar Time Mid-Quote Variance Signature Plots for IBM and GE Using NYSE and NYSE and Midwest ( IBM NYSE; IBM NYSE and Midwest; GE NYSE; GE NYSE and Midwest).
Figure 4. Calendar Time Mid-Quote Variance Signature Plots for IBM and GE Using NYSE and NASDAQ and the Consolidated Mar-ket ( IBM NYSE and NASD; IBM consolidated;
GE NYSE and NASD; GE consolidated).
Hansen and Lunde recognize that the negative correlation be-tween re and η in the case of mid-quotes appears to not be a first-order effect when dealing with transaction prices. This result is easily understandable in the context of our assumed price formation mechanism. The observed pricep˜is relatively stickier when measured using mid-quotes rather than transac-tion prices regardless of the market structure and the method used to sample prices.
Figure 5 presents calendar time mid-quote and transaction variance plots for Cisco and Microsoft. Figure 6 presents calen-dar time transaction variance plots for IBM using NYSE, NYSE and Midwest, NYSE and NASDAQ, and the consolidated mar-ket. This figure should be compared with Figures 3 and 4. Fig-ure 7 presents calendar time transaction variance plots for GE using NYSE, NYSE and Midwest, NYSE and NASDAQ, and the consolidated market. This figure should be compared with Figures 3 and 4.
Sampling Method. Sampling returns in calendar time in-duces properties of the noise that are different from the prop-erties of the noise obtained by sampling returns in trade time. (See Oomen 2006 for an interesting treatment of business-time sampling in the context of realized variance estimation.) At very
Figure 5. Calendar Time Variance Signature Plots for Cisco Systems and Microsoft Using Transaction Prices and Mid-Quotes ( CSCO transactions; MSFT transactions;
CSCO quotes; MSFT quotes).
Figure 6. Calendar Time Transaction Price Variance Signature Plots for IBM Using NYSE, NYSE and Midwest, NYSE and NASDAQ, and the Consolidated Market ( NYSE; NYSE and Midwest;
NYSE and NASD; consolidated).
high frequencies, calendar time sampling will inevitably result in sampling between quote updates, thereby artificially induc-ing stickiness in thep˜’s. This stickiness again leads to an arti-ficially negative correlation between noise returns and efficient returns. Here we compare the variance signature plots obtained from event time sampling to those obtained previously from cal-endar time sampling.
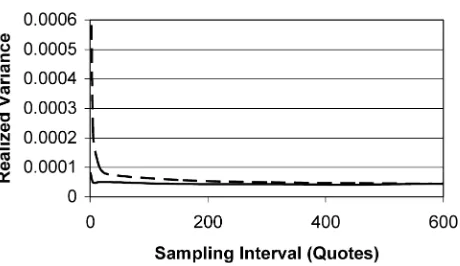
Figure 8 contains event time mid-quote variance plots for Cisco and Microsoft. This figure should be compared with Fig-ure 2. FigFig-ure 9 presents event time mid-quote variance plots for IBM and GE using NYSE and NYSE and Midwest. This figure should be compared with Figure 3.
Figure 10 presents event time mid-quote variance plots for IBM and GE using NYSE and NASDAQ, and the consolidated market. This figure should be compared with Figure 4.
3.2 The Noise Is Time-Dependent
It is not a coincidence that, as reported by Hansen and Lunde, the noise appears to be more persistent when the dependence between noise and efficient price is more negative. We argue
Figure 7. Calendar Time Transaction Price Variance Signature Plots for GE Using NYSE, NYSE and Midwest, NYSE and NASDAQ, and the Consolidated Market ( NYSE; NYSE and Midwest;
NYSE and NASD; consolidated).
Figure 8. Event Time Mid-Quote Variance Signature Plots for the NASDAQ Stocks Cisco Systems ( ) and Microsoft ( ).
that price stickiness can alsomechanicallyinduce persistence in the microstructure noise. In fact, stable observed returns de-termine persistent noise contaminations in the presence of un-predictable efficient returns. This, again, can be easily seen. Consider the model in (2). For the sake of argument, assume thatr˜jδ:=0 for allj. Then
0=rejδ+εjδ, (10)
thereby implying that
ηjδ=η(j−1)δ−rjeδ. (11)
As earlier, the extent of the persistence in the price contam-inations will depend on the market structure, the price mea-surement, and the sampling scheme. The convenient iid market microstructure model can be a poor approximation when us-ing mid-quotes from a highly centralized market like the NYSE as in Hansen and Lunde’s study; however, it can a be a sat-isfactory approximation in other circumstances. For example, adding additional quote information from other exchanges to NYSE mid-quotes substantially increases the (negative) first-order autocorrelation of the recorded returns.
Figure 9. Event Time Mid-Quote Variance Signature Plots for IBM and GE Using NYSE and NYSE and Midwest ( IBM NYSE; IBM NYSE and Midwest; GE NYSE; GE NYSE and Midwest).
Figure 10. Event Time Mid-Quote Variance Signature Plots for IBM and GE Using NYSE and NASDAQ and the Consolidated Mar-ket ( IBM NYSE and NASD; IBM consolidated;
GE NYSE and NASD; GE consolidated).
3.3 The Noise Is Small
We believe that the size of the noise depends on the met-ric of interest. For example, if the relevant metmet-ric is the MSE of an integrated variance estimator, then it is difficult to claim that the size of the noise is small. In fact, integrated variance estimators that are more robust to market microstructure noise than the classical realized variance estimator have conditional (on the volatility path) MSEs that are substantially smaller than the MSE of the realized variance estimator (Bandi and Russell 2005a,d; Hansen and Lunde 2006).
More generally, we think it is important to ask about the eco-nomic implications of alternative variance estimates. (We return to this observation in Sec. 4.) If sensible economic criteria sug-gest that nonparametric variance estimates that are more robust to market microstructure noise than the classical realized vari-ance estimator provide economic gains, then it certainly would be inaccurate to say that the noise is small.
3.4 The Noise Changed Over Time
We fully agree with this observation. For instance, the size of the noise component in the observed mid-quotes and transac-tion prices, as summarized by the magnitude of the noise sec-ond moment, has been decreasing throughout the years (Bandi and Russell 2005b; Oomen 2005).
Markets are becoming more liquid and more decentralized. More liquid markets will be characterized by a larger num-ber of transactions. Although the increased transaction rate will likely reduce the extent of the dependence, EM(rejδηjδ),
between the efficient return process and microstructure noise over any time interval, the resulting effect on the bias com-ponent MEM(rejδηjδ)in (9) is not obvious. The increased
de-centralization likely will induce less stickiness in the observed prices. This effect will probably contribute to render both the dependence between noise and efficient price and the noise per-sistence relatively less important.
4. FINAL REMARKS AND SOME PERSPECTIVES
Remark 1. We have argued that some of the dynamic fea-tures of the noise—namely, the negative correlation between
efficient returns and noise components and the persistence of the noise—may be explained by a mechanical relationship in-duced by a combination of sluggishness in the adjustments to the observed prices and an ever-evolving efficient price.
Remark 2. Are the inevitable negative correlations between noise and efficient return process and the noise persistence first-order effects in the data? It depends on the market, the type of price measurement, and the sampling scheme.
Consider the dependence between noise and efficient prices. Hansen and Lunde’s signature plots speak nicely to the strong negative dependence between efficient price and noise compo-nent when the observed price is particularly sticky, that is, in the case of calendar-time mid-quotes on the NYSE. But ferent market structures, different sampling methods, and dif-ferent price measurements can have drastically difdif-ferent noise features and a different nature of dependence between noise and efficient price. When the observed prices are relatively less sticky (i.e., in the case of foreign exchange markets, NASDAQ, and combinations of markets, e.g., but also when using transac-tion prices and/or sampling in event time rather than in calendar time), the evidence and logic in favor of a negative dependence between efficient price and noise component at high frequen-cies, as well as the evidence and logic in favor of noise persis-tence, are weaker in general.
Remark 3 (The importance of finite-sample performance). Should the literature on integrated variance estimation be con-cerned with the inevitable negative correlation between noise and efficient return process and with noise persistence? Natu-rally, the answer depends on whether these features are first-order effects in the data.
Our own work has emphasized the need for differentiating between asymptotic and finite-sample methods in the context of integrated variance estimation by virtue of noisy high-frequency data and the importance of finite-sample criteria (Bandi and Russell 2005a,d). Irrespective of the estimator used, the effective implementation of finite-sample criteria requires the imposition of sensible restrictions on the properties of the noise. For example, one can optimize the finite-sample MSE of various integrated variance estimators in the presence of de-pendent noise. (See Bandi and Russell 2005a for a study of the dependent noise case when dealing with realized variance.) However, dependence between the noise and the efficient price is a more delicate issue. Although in general one can express the MSE of integrated variance estimators in the presence of dependence between the noise and the efficient price, empirical estimation of the additional terms that would arise by virtue of this dependence is a very complicated matter.
Depending on the data (market structure and type of price measurement) and sampling scheme, empirically justifiable compromises need to be made for the finite-sample properties of alternative integrated variance estimators to be optimized. Compromises are made in Hansen and Lunde’s work; the vari-ance of their first-order bias-corrected estimatorV1is optimized under an iid noise model with noise independent of the efficient price. Similarly, compromises are likely to be needed when op-timizing the finite-sample variance properties of the more gen-eral bias-corrected estimator advocated by Hansen and Lunde [VqM in (3)].
Remark 4. What data do we suggest using?
a. If interest is placed on the integrated variance of the un-derlying price process (as in Hansen and Lunde’s work), then it is sensible to use high-frequency data that are less contami-nated by residual market microstructure noise components, that is, mid-quotes.
b. As we showed, sampling in calendar time can generate severe distortions at high frequencies. The presence of stale quotes due to sampling between quote updates can substantially bias the estimates downward. Hence sampling at high frequen-cies for the purpose of estimating mid-quote noise moments, as suggested by Bandi and Russell (2005a,b) and Zhang et al. (2005), should be conducted in event time.
c. If the properties of the noise are not expected to change wildly across exchanges, then information provided by multi-ple exchanges can be used. Bandi and Russell (2005a,b) used event time mid-quotes from the NYSE and Midwest to estimate the noise moments. Figure 11 presents event-time mid-quote volatility plots for IBM and GE using the NYSE and Midwest. At high frequencies, the IBM variance doubles, whereas the GE variance is five times as large as the corresponding value at low frequencies. These increases provide important informa-tion about the second moment of the noise.
d. If interest is in the noise variance andηis interpreted as a transaction cost, then transaction prices sampled in event time should be used.
Remark 5(The importance of economic metrics). Numer-ous statistical refinements have been made for integrated vari-ance estimation in the presence of market microstructure noise. (For summaries of the current state of the research, see Bandi and Russell 2005c; Barndorff-Nielsen and Shephard 2007.) Hansen and Lunde’s work is central to this exciting line of re-search. Even though we expect future important statistical ad-vances, we believe that it is now necessary to inquire about the economic implications of statistical refinements.
One way to assess these implications is to use the utility-based method advocated by Fleming, Kirby, and Ostdiek (2001) to evaluate alternative variance forecasts. This is the approach taken by Bandi and Russell (2005b). But numerous alternative economic metrics could (and should) be considered. For ex-ample, given an option pricing model linking option prices to
Figure 11. NYSE and Midwest Mid-Quote Variance Signature Plots for IBM ( ) and GE ( ).
integrated variance, the forecasting power of alternative inte-grated variance measures can be assessed. Although proposing and implementing sensible economic metrics is a difficult task in general, we believe that this is an important hurdle to over-come for the literature on integrated variance estimation.
ACKNOWLEDGMENTS
The authors thank the Graduate School of Business of the University of Chicago for financial support. They are grate-ful to the conference participants at the 2005 Annual JBES Invited Lecture (American Statistical Association Meetings, Minneapolis, August 7–11) for discussions.
ADDITIONAL REFERENCES
Bandi, F. M., and Russell, J. R. (2005a), “Microstructure Noise, Realized Vari-ance, and Optimal Sampling,” working paper, University of Chicago, Grad-uate School of Business.
(2005b), “Separating Microstructure Noise From Volatility,”Journal of Financial Economics, 79, 655–692.
(2005c), “Volatility,” in Handbook of Financial Engineering, eds. J. R. Birge and V. Linetski, Amsterdam: Elsevier/North-Holland, forthcom-ing.
(2005d), “Market Microstructure Noise, Integrated Variance Estima-tors, and the Limitations of Asymptotic Approximations: A Solution,” work-ing paper, University of Chicago, Graduate School of Business.
Fleming, J., Kirby, C., and Ostdiek, B. (2001), “The Economic Value of Volatil-ity Timing,”Journal of Finance, 56, 329–352.
Hasbrouck, J. (2006), Empirical Market Microstructure, Oxford University Press, forthcoming.
Comment
Torben G. A
NDERSENDepartment of Finance, Kellogg School, Northwestern University, Evanston, IL 60208, and National Bureau of Economic Research (t-andersen@kellogg.northwestern.edu)
Tim B
OLLERSLEVDepartment of Economics, Duke University, Durham, NC 27708, and National Bureau of Economic Research (boller@econ.duke.edu)
Per Houmann F
REDERIKSENDepartment of Marketing and Statistics, Aarhus School of Business, Fuglesangs Alle 4, 8210 Aarhus V, Denmark (phf@asb.dk)
Morten Ørregaard N
IELSENDepartment of Economics, 482 Uris Hall, Cornell University, Ithaca, NY 14853 (mon2@cornell.edu)
1. INTRODUCTION
The article by Hansen and Lunde (henceforth HL) provides an excellent introduction to, overview of, and synthesis of the recent literature on estimating financial return variability from high-frequency data in the presence of market microstructure noise in the observed prices. In addition, importantly, it goes further by extending the existing procedures in important di-rections, providing abundant empirical evidence in support of the main assertions. The latter is perhaps the most compelling aspect of the work, because it directly pinpoints limitations in currently popular approaches. Among the features stressed are findings suggesting a negative correlation between the under-lying “efficient” price and the noise component, time variation in the size of the noise component, and temporal dependence in the noise process. Finally, the magnitude of the noise com-ponent has decreased dramatically in recent years and is now quite small relative to the daily return variation for the liquid stocks investigated. The most striking implication of this is that the so-called “volatility signature plot” generally will not di-verge to infinity as the sampling frequency increases toward tick-by-tick transaction prices or quotations. In fact, for some
relevant sampling schemes, the signature plot drops off rather than explodes near the origin, implying that the presence of mi-crostructure noise lowersthe return variation estimated from ultra-high–frequency observations. This is evidently problem-atic for procedures that rely on an asymptotic theory stipulating that the noise term will be dominant in the limit (for ever-higher sampling frequencies) and thus allows for direct identification and estimation of the variance of the noise term through the use of subsampling schemes. The time series dependence of the noise process further complicates the practical implementa-tion of such strategies. HL provide a foundaimplementa-tion for systematic discussions of such issues and further seek to explain when the pertinent theoretical assumptions provide a sensible and reliable guide for real-world applications. This careful balancing of the-oretical and empirical perspectives produces a comprehensive exposition of where the literature has originated, as well as in-sightful suggestions for directions that should be pursued going
© 2006 American Statistical Association Journal of Business & Economic Statistics April 2006, Vol. 24, No. 2 DOI 10.1198/073500106000000134