Full Terms & Conditions of access and use can be found at
http://www.tandfonline.com/action/journalInformation?journalCode=cbie20
Bulletin of Indonesian Economic Studies
ISSN: 0007-4918 (Print) 1472-7234 (Online) Journal homepage: http://www.tandfonline.com/loi/cbie20
Survey of Recent Developments
Eric D. Ramstetter
To cite this article:
Eric D. Ramstetter (2000) Survey of Recent Developments, Bulletin of
Indonesian Economic Studies, 36:3, 3-47
To link to this article:
http://dx.doi.org/10.1080/00074910012331338943
Published online: 18 Aug 2006.
Submit your article to this journal
Article views: 60
View related articles
SURVEY OF RECENT DEVELOPMENTS
Eric D. Ramstetter*
International Centre for the Study of East Asian Development, Kitakyushu
SUMMARY
Indonesia continued to struggle with institutional change and political uncertainty in recent months. President Abdurrahman Wahid delegated some responsibilities to Vice President Megawati Sukarnoputri, but subsequently appointed a new cabinet that consisted primarily of people close to him, making many wonder if he had really given up any power. The killing of UN personnel in Atambua, West Timor, led to renewed pressure on the government to rein in the militias operating there. The president also tried to increase his control over the military, the police and the judiciary, with mixed results.
INSTITUTIONAL CHANGE CONTINUES AT A RAPID PACE
The two and a half years since the fall of the New Order regime have witnessed rapid institutional change that appears likely to continue. In the last few months the efforts of President Abdurrahman Wahid (Gus Dur) to define his role in a democratically elected government have been particularly conspicuous, though there is much scepticism about their effectiveness, and continued uncertainty about political and administrative arrangements.
The President, the MPR, and the Economic Policy Making Team
The August session of the People’s Consultative Assembly (MPR, Majelis Permusyawaratan Rakyat) began with the possibility that some legislators would mount a serious effort to impeach the president. His report on the performance of his administration was poorly received, most importantly because he often gives the impression of making policy statements without thinking through the issue at hand and is often perceived as meddling in affairs where he should not. Moreover, his frequent trips abroad make him vulnerable to charges that he is not giving sufficient priority to domestic affairs in general, and to the economy in particular. Partly in response to these criticisms, the president agreed to delegate much of the authority for day-to-day administration to the vice president. He also streamlined the cabinet, reducing the number of posts to 26 from 35 in the October 1999 cabinet; however, three key former cabinet posts (Attorney General, State Secretary and Commander of the Armed Forces) still exist outside the cabinet. The most significant streamlining came where two ministries were combined (e.g. Home Affairs and Regional Autonomy; Agriculture and Forestry; and Manpower and Trans-migration), although these mergers may not result in a significant reduction of the bureaucracy. The government is understandably reluctant to cut too many government posts at a time when the labour market is perceived to be weak.
retained.1 This cabinet has been dubbed ‘all the president’s men’, because
it consists mainly of people close to Gus Dur, whereas the previous cabinet was the result of political compromise following his election by the MPR in 1999. Many observers are sceptical about just how much power the president has given up in this process (e.g. MacIntyre 2000).
Rizal Ramli is generally seen as a more forceful leader than his predecessor, Kwik Kian Gie, and this has led some to hope for a more focused and effective economic policy (ESCOM Monthly Journal, September 2000: 4–12). Nevertheless, Rizal and Priyadi are thought to disagree over how to handle the case of Bank Rakyat Indonesia, the bank Priyadi was previously nominated to head.2 In a related matter, the press
suggested in September that Rizal was in a ‘major turf battle’ with then IBRA head Cacuk for control of Indonesia’s state-owned enterprises (Business Times Singapore, 18/9/00: 1), though this may have been an exaggeration. There is also continuing strain in relations between the government and Bank Indonesia (the central bank), which is keen to protect its newly legislated independence and is campaigning for the release of its governor, Syahril Sabirin, following his detention on charges of involvement in the Bank Bali scandal (McLeod 2000: 8). Fortunately, Rizal appears to get along reasonably well with the acting central bank governor, Anwar Nasution, and the rumoured rifts between Rizal and others in the administration have not yet led to major problems. In short, there is guarded optimism that the present policy making team may be able to work better together than its predecessor, but there are many potential problems and little margin for error in the next few years.
Whatever transpires, Indonesia is going through a profound process of institutional change and institution building. The political system and the policy making bureaucracy are in a state of flux as a result. This process is likely to proceed in a haphazard and sometimes chaotic fashion for the foreseeable future and, although the international community often demands institutional change as a precondition for extending assistance, a realistic assessment would suggest that many of the changes demanded (e.g. to the judiciary’s handling of bankruptcy proceedings) will take years to realise. Most of the international agencies on the ground—the International Monetary Fund (IMF), the World Bank, and bilateral agencies—appear to be aware of this contradiction, but there are some areas in which Indonesia may be forced to respond rather rapidly.
Security and the Role of the Military
armed militias in refugee camps. The latter problem came to a head when three United Nations (UN) aid workers were killed in Atambua on 6 September. UN officials issued stern warnings to Indonesian representatives at the Millennium Summit in New York, and the US Defense Secretary, William Cohen, gave a similar warning during a visit to Jakarta, saying that a failure to disband the militias would ‘have consequences for Jakarta’s relations with the international community’. The Indonesian response to Cohen’s vague threat was generally negative. Many observers, and most of the press, complained about foreign intervention in domestic affairs, and some went so far as to suggest that the US was threatening a trade embargo against Indonesia, though there is no evidence of this (Capital, 2–8 October 2000: 6–8). In reality, failure to control the militias might have negative effects on Indonesia’s efforts to secure economic aid, but the strong strategic interest of the US, the European Union, Japan and Australia in supporting Indonesia’s new democracy makes it very unlikely that a trade embargo or any major cut in funding will result as long as the country remains democratic.3
Perhaps more important in the medium term are the president’s attempts to exercise more control over the security apparatus, the military and the police. Through the appointment of Coordinating Minister Bambang Yudhoyono, the subsequent abolition of the post of Deputy TNI (armed forces) Commander and removal of the office’s occupant, General Fachrul Razi, and the controversial (and probably illegal) dismissal of the national police chief, Gus Dur has tried to signal that he is indeed supreme commander as mandated by the constitution. However, he has apparently been unable to get his candidates appointed to top military posts (Tempo, 9–15 October 2000). The military appears highly demoralised, and it is unclear whether the chain of command really works any longer. In short, there is still considerable doubt that recent actions can be translated into the increased political and military will necessary to control militias in West Timor, to manage volatile situations in other regions such as Maluku, or to stop the series of bombings in Jakarta and elsewhere over the last six months. Some observers (e.g. The Economist, 3 September – 6 October 2000) have wondered if certain serving or retired senior military officials might be behind some of these problems, and have suggested that the president’s efforts to assert more control over the security apparatus could end in failure.
The Stock Exchange Bombing, the Soeharto Trial, Bank Restructuring, and the Rule of Law
The bombing of the Jakarta Stock Exchange building on 13 September created a domestic outcry. This was the latest in a series of terrorist acts that appeared to be correlated with steps in the bid to try former President Soeharto and other family members on corruption charges.5 Apparently
convinced that these events were related, the president ordered the arrest of Soeharto’s youngest son, Hutomo Mandala Putra (Tommy), and another associate, in connection with the bombing. However, the then police chief refused to make the arrest, saying that there was no evidence to warrant it, though Tommy was taken in for questioning in the affair. This led to the firing of the police chief. Subsequently, a group who appeared to hail from Aceh, and who included two individuals from a special military unit, were arrested in connection with the bombing.
Meanwhile a panel of judges ruled that former President Soeharto was medically and psychologically unfit to stand trial. This effectively ends the government’s attempts to try the former president on criminal charges, unless a higher court overturns the decision or another court rules differently on a separate indictment.6 Here again the president
In a different sphere, as of 27 August IBRA had brought bankruptcy proceedings in 51 cases, and civil court proceedings in 146 cases (IBRA,
Monthly Report, September 2000: 5). Meanwhile, by 16 August, IBRA had had 37 legal cases brought against it. IBRA has lost the majority of the cases where judgments have been rendered.
As discussed by Fane (2000a: 36–7), judicial corruption is a major problem in Indonesia, and is widely thought to be a factor in the decisions rendered in the Soeharto and IBRA cases. In this context, the president’s comments about the Soeharto trial are perhaps understandable. There is also a perception that a similar level of corruption extends to the police, which may explain the president’s desire to give specific instructions to them. However, the police chief was legally obliged to refuse the president’s order if there was indeed no evidence to support the arrest of Soeharto’s son. The president is also legally required to consult with the legislature before dismissing the police chief. More fundamentally, the fact that Gus Dur has expressed opinions about specific cases before the courts or the police is disturbing. The president does have an important role to play in the appointment and removal of judges and of the police chief, but the challenge is to reform the judiciary and police without continuing the practice of excessive executive control that existed under Soeharto. See box 1 for a brief discussion of progress with law reform.
MACROECONOMIC TRENDS AND POLICY ISSUES
There are finally signs that the economy may be recovering after the sharp contraction in 1998 and lacklustre performance in 1999. Indeed, it seems that first consumers and then investors have become used to political uncertainty and institutional flux, and have begun to spend more.
Expenditure Components of GDP
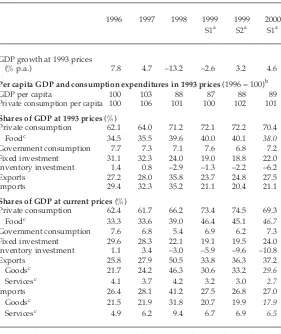
Gross Domestic Product (GDP) grew 4.6% in the first half of 2000 compared with the first half of 1999, in marked contrast to negative growth rates of –2.6% a year earlier, and –13.2% in 1998 (table 1). In 1999 and in 1996 (the last full pre-crisis year), the annual growth rate exceeded the rate for the first half. This was also the case in 1992–93 and 1995, and many observers expect growth to be stronger in the second half of 2000 as well.7 Growth in the first half of the year was still rather slow compared
Box 1 THE FAILURE OF LAW REFORM
There is growing despondency among Indonesian law reform leaders. The window of opportunity that opened after Abdurrahman Wahid’s election seems to have almost closed. Few expected that the flood of statutory reforms approved by Habibie would achieve more than symbolic change, but it was hoped that a purging and restructuring of key legal institutions under his successor would usher in a new legal culture. The commissions set up to overhaul the corrupt and incompetent judicial system have, however, run head-on into the lingering power of the New Order system.
Some operating methods of the New Order were those of criminal gangs. The territorialised system of the petty standover criminals, or preman, was writ large as the state used systematic intimidation and corruption to extract rents to help sustain Soeharto’s political franchise. Controlling the courts was a key part of this strategy, and Soeharto was a master: barely a decision went against his government in three decades. Post-Soeharto reformasi succeeded in publicly identifying the essential criminality of much of public life and pushed many key figures into the background, but it has failed to effect any real change to the system itself. In many cases, the ‘gangs’ pushed out of the state’s systems simply went ‘private’, operating now as enemies of the state. The consequences can be seen in aspects of militia activity in Eastern Indonesia, bombings in Jakarta and the rise of vigilantism—a response to state loss of control. More subtly, it is demonstrated by the continued corruption of the courts, which favour the old elite at the expense of reformasi, as shown by the farce of the Soeharto trial and the recent dismissal of charges against three allegedly corrupt judges. So far, not one ‘big fish’ has been both finally convicted and jailed.
It is now becoming obvious that the government has limited authority to control the state apparatus; it can offer little guarantee of the proper functioning of the legal system; and it has almost no ability to prevent or punish violence or corruption. Alarmingly, the president’s response is, increasingly, political intervention—ordering arrests and trials—itself one of the causes of past decay in legal institutions.
Tim Lindsey
TABLE 1 Real GDP Growth, Real Per Capita GDP, and Expenditure Shares of GDP, 1996–2000
1996 1997 1998 1999 1999 2000 S1a S2a S1a
GDP growth at 1993 prices
(% p.a.) 7.8 4.7 –13.2 –2.6 3.2 4.6
Per capita GDP and consumption expenditures in 1993 prices (1996 = 100)b
GDP per capita 100 103 88 87 88 89
Private consumption per capita 100 106 101 100 102 101
Shares of GDP at 1993 prices (%)
Private consumption 62.1 64.0 71.2 72.1 72.2 70.4
Foodc 34.5 35.5 39.6 40.0 40.1 38.0
Government consumption 7.7 7.3 7.1 7.6 6.8 7.2 Fixed investment 31.1 32.3 24.0 19.0 18.8 22.0 Inventory investment 1.4 0.8 –2.9 –1.3 –2.2 –6.2
Exports 27.2 28.0 35.8 23.7 24.8 27.5
Imports 29.4 32.3 35.2 21.1 20.4 21.1
Shares of GDP at current prices (%)
Private consumption 62.4 61.7 66.2 73.4 74.5 69.3
Foodc 33.3 33.6 39.0 46.4 45.1 46.7
Government consumption 7.6 6.8 5.4 6.9 6.2 7.3 Fixed investment 29.6 28.3 22.1 19.1 19.5 24.0 Inventory investment 1.1 3.4 –3.0 –5.9 –9.6 –10.8
Exports 25.8 27.9 50.5 33.8 36.3 37.2
Goodsc 21.7 24.2 46.3 30.6 33.2 29.6
Servicesc 4.1 3.7 4.2 3.2 3.0 2.7
Imports 26.4 28.1 41.2 27.5 26.8 27.0
Goodsc 21.5 21.9 31.8 20.7 19.9 17.9
Servicesc 4.9 6.2 9.4 6.7 6.9 6.5
aS1 = first half, S2 = second half; growth rates refer to the growth over the
corre-sponding half of the previous year.
bReal GDP is originally estimated at 1993 prices; per capita GDP is then rebased to
1996; population is estimated to grow by 1.49% in 1999 and 1.47% in 2000 (growth rates were 1.51% in 1998 and 1.53% in 1997), and population growth is assumed to be evenly distributed throughout 1999 and 2000.
cFigures for 2000 S1 in these categories refer to the first quarter of 2000 only, and
have not been revised as is the case for other GDP components.
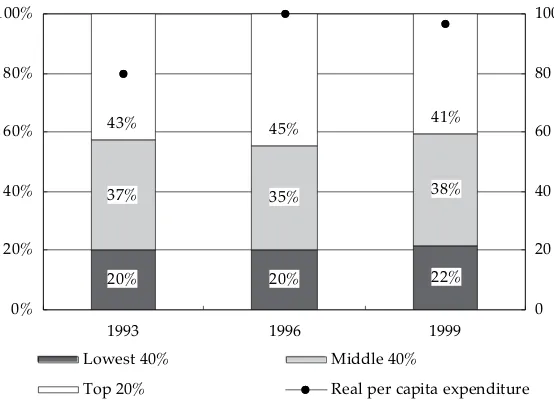
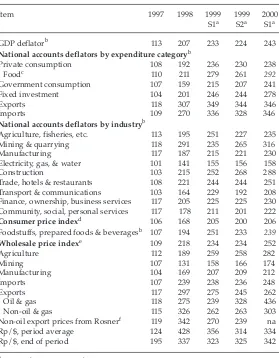
As a result of the contraction in 1998 and the first half of 1999, per capita real GDP was 13% lower in the first half of 1999 than in 1996 (table 1). It has since started to recover, and was back to 11% below pre-crisis levels in the first half of 2000. Private consumption per capita (as calculated from the national accounts) never fell below 1996 levels throughout the crisis. By contrast, if estimates of consumption expenditure from the National Socio-Economic Survey (Susenas) are deflated using the consumer price index (CPI), real consumption expenditure appears to have declined 3% between 1996 and 1999 (figure 1). If the private consumption deflator from the national accounts is used instead of the CPI to deflate these estimates, the decline becomes much larger (16%), because the private consumption deflator rose much more rapidly than the CPI in this period (table 2). For a discussion of anomalies among various price deflators in Indonesia, see box 2.
FIGURE 1 Shares of Consumption Expenditure by Expenditure Group (%) and Index of Real Per Capita Expenditurea
(1996 = 100)
aPer capita expenditure is deflated by the consumer price index.
Sources: BPS (2000b); World Bank (2000a).
20% 20% 22%
37% 35% 38%
43% 45% 41%
0% 20% 40% 60% 80% 100%
1993 1996 1999
0 20 40 60 80 100
Lowest 40% Middle 40%
TABLE 2 Various Price Indicators, 1997–2000 (1996 = 100)
Item 1997 1998 1999 1999 2000
S1a S2a S1a
GDP deflatorb 113 207 233 224 243
National accounts deflators by expenditure categoryb
Private consumption 108 192 236 230 238
Foodc 110 211 279 261 292
Government consumption 107 159 215 207 241
Fixed investment 104 201 246 244 278
Exports 118 307 349 344 346
Imports 109 270 336 328 346
National accounts deflators by industryb
Agriculture, fisheries, etc. 113 195 251 227 235
Mining & quarrying 118 291 235 265 316
Manufacturing 117 187 215 221 230
Electricity, gas, & water 101 141 155 156 158
Construction 103 215 252 268 288
Trade, hotels & restaurants 108 221 244 244 251 Transport & communications 103 164 229 192 208 Finance, ownership, business services 117 205 225 225 230 Community, social, personal services 117 178 211 201 222
Consumer price indexd 106 168 205 200 206 Foodstuffs, prepared foods & beveragesb 107 194 251 233 239
Wholesale price indexe 109 218 234 234 252
Agriculture 112 189 259 258 282
Mining 107 131 158 166 174
Manufacturing 104 169 207 209 212
Imports 107 239 238 236 248
Exports 117 297 275 245 262
Oil & gas 118 275 239 328 436
Non-oil & gas 115 326 262 263 303
Non-oil export prices from Rosnerf 119 342 270 239 na
Rp/$, period average 124 428 356 314 334
Rp/$, end of period 195 337 323 325 342
aS1 = first half, S2 = second half.
bDeflators calculated from annual or quarterly data defined as 1993 = 100 in the source.
cSee table 1, note c.
dAnnual averages of monthly price indices defined as 1996 = 100 in the source.
eAnnual averages of monthly price indices defined as 1993 = 100 in the source.
fAnnual averages of quarterly price indices defined as 1994 Q2 = 100 in $ in the source,
trans-lated to rupiah at period average exchange rates.
The distribution of consumption expenditures appears to have become somewhat more equal in 1996–99 (figure 1). The 40% of households with the lowest expenditures increased their share of total expenditures from 20% to 22%, while the share of the middle 40% rose from 35% to 38%, and that of the top 20% fell from 45% to 41%. However, the share of poorer households would probably rise much less if one were to calculate the shares in constant prices, and to account for the fact that food occupies a much larger share of expenditures in poor households, because food prices rose more rapidly than prices of other consumer goods (table 2).8
Box 2 NATIONAL ACCOUNTS DEFLATORS AND PRICE INDICES IN INDONESIA
There were conspicuous increases in fixed investment and exports in the first half of 2000 (table 1). Consequently, shares of these items in real GDP rose from 19% to 22% and from 24% to 28%, respectively, compared to the first half of 1999. The share of fixed investment was still far below pre-crisis levels (e.g. 31% in 1996), but the long awaited turnaround in fixed investment finally appears to have begun in the first half of 2000.9
Likewise, the share of imports remained steady after falling dramatically in 1999, although it too is still far below pre-crisis levels. If the turnaround in fixed investment is sustained, the share of imports is likely to rise in the medium term, because capital goods account for a large proportion of imports. On the other hand, the share of private consumption fell in the first half of 2000 after rising steadily in 1997–99. Of particular significance is the levelling off and apparent decline in the share of food expenditures in the first quarter of 2000.10 To the extent that the estimate
is reliable, the large negative share of inventory investment indicates that existing inventories were rapidly drawn down in the first half of 2000.11
There are some markedly different patterns observed if shares are calculated in current prices, reflecting the fact that price movements have varied greatly across GDP components (tables 1 and 2). For example, the rise in the share of private consumption from 1997 to the second half of 1999, and its subsequent fall, are much larger when shares are calculated in current prices. This reflects the fact that the consumption deflator rose more rapidly than the GDP deflator through 1999, a pattern reversed in the first half of 2000. Food shares increased particularly sharply in current prices, the rise in this deflator being even greater than that in the consumption deflator. In 1999 and the first half of 2000, the fixed investment deflator also rose quite rapidly, resulting in smaller declines or larger increases in GDP shares when measured in current prices. However, by far the largest differences between nominal and real shares were in trade shares of GDP, which were also much larger in current prices, because export and import prices rose much faster than the GDP deflator through 1999.
Monetary Developments
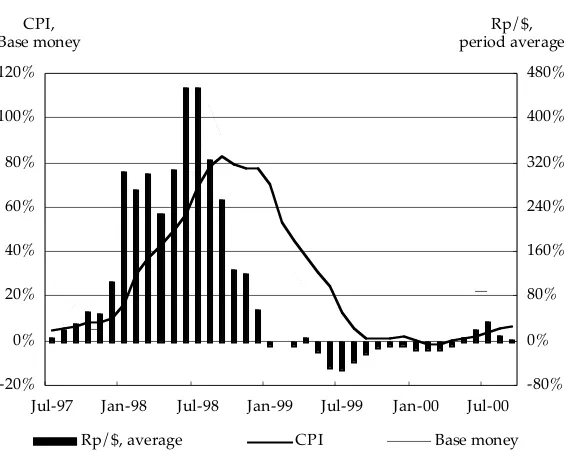
very low levels between September 1999 and June 2000 (of –1% to 2%), before increasing to 5% in July 2000, 6% in August 2000, and 7% in September 2000. Growth rates of base money have been more volatile, but were generally below 20% from May 1999 to May 2000; they then climbed to 22% in June and July and 20% in August, before falling back to 16% in September. As a result, by the end of August base money was 5.7% higher than the performance criteria, and by the end of September it was 5.2% higher than the indicative target identified in the Letter of Intent submitted to the IMF in July (Bank Indonesia [BI], Indonesian
FIGURE 2 Exchange Rate Movements, Inflation and Base Money Growtha
(% p.a.)
aAll growth rates are annualised rates comparing the month in question with the
same month one year earlier. Monthly money supply figures are measured at the end of the month; exchange rates are monthly average rates; various components of the CPI are collected at different intervals throughout the month.
Sources: BI, IFS (various issues); World Bank (2000a). -20%
0% 20% 40% 60% 80% 100% 120%
Jul-97 Jan-98 Jul-98 Jan-99 Jul-99 Jan-00 Jul-00 CPI,
Base money
-80% 0% 80% 160% 240% 320% 400% 480% Rp/$, period average
Financial Statistics [IFS], various issues; tables downloaded from <www.imf.org>). Some observers have worried that failure to control the money supply would lead to increased inflation in the second half of 2000 (Feridhanusetyawan 2000: 2–3; McLeod 2000: 16–20). Moreover, the government began reducing its subsidy of oil products on 1 October, raising fuel prices an average of 12%, a move that is generally thought to add to inflationary pressures. Nonetheless, Bank Indonesia still expects that annual CPI inflation will be only about 1% higher than the 5–7% predicted earlier (Dow Jones Newswires, 11/10/00), and the data in figure 2 suggest that this is a reasonable estimate.
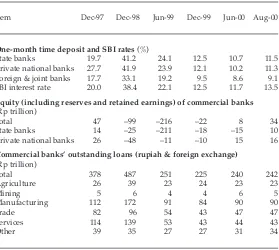
One reason that Bank Indonesia is hesitant to slow the growth of money is that this would require it to issue certificates of deposit (Sertifikat Bank Indonesia, SBI). In conjunction with the bank recapitalisation program the government has issued a large amount of floating rate bonds, which pay the same rate as the three-month SBIs. Tighter monetary policy and higher interest rates would therefore increase the domestic interest burden in the budget. Three-month SBI rates have already moved markedly higher in recent months, from 11.1% in June to 13.0% in July, and 13.3% in August (BI, IFS, various issues). Table 3 shows that 28-day SBI rates were not much higher than interest rates on simple time deposits, underscoring the weak incentive to hold these securities. Deposit interest rates have been much lower in foreign and joint banks in recent months, suggesting that the public may have more confidence in these banks than before. It is also interesting that private national banks now pay lower interest than state banks, reversing the large differential that existed in 1996–97, when their liabilities were not explicitly guaranteed.
These figures reflect both the successes and the problems that IBRA has had in restructuring Indonesia’s banking sector. Progress has been somewhat slower when dealing with state-owned than with private banks, as political infighting complicates the process. To finance the recapitalisation, IBRA had issued bonds worth Rp 412 trillion by July 2000, including Rp 270 trillion for four state banks (Bank Mandiri, Bank BNI, Bank BRI and Bank BTN) and Rp 109 trillion for four private banks taken over in 1998 (Bank Tiara Asia, Bank Central Asia, Bank PDFCI and Bank Danamon). In addition, in 1998 and 1999 the government issued repayment bonds to Bank Indonesia totalling Rp 228 trillion, including TABLE 3 Selected Interest Rates and Indicators for Commercial Banks, 1997–2000
(end of period)
Item Dec-97 Dec-98 Jun-99 Dec-99 Jun-00 Aug-00
One-month time deposit and SBI rates (%)
State banks 19.7 41.2 24.1 12.5 10.7 11.5
Private national banks 27.7 41.9 23.9 12.1 10.2 11.3 Foreign & joint banks 17.7 33.1 19.2 9.5 8.6 9.1 SBI interest rate 20.0 38.4 22.1 12.5 11.7 13.5
Equity (including reserves and retained earnings) of commercial banks
(Rp trillion)
Total 47 –99 –216 –22 8 34
State banks 14 –25 –211 –18 –15 10
Private national banks 26 –48 –11 –10 15 16
Commercial banks’ outstanding loans (rupiah & foreign exchange)
(Rp trillion)
Total 378 487 251 225 240 242
Agriculture 26 39 23 24 23 23
Mining 5 6 4 4 6 5
Manufacturing 112 172 91 84 90 90
Trade 82 96 54 43 47 47
Services 114 139 53 43 44 43
Other 39 35 27 27 31 34
Rp 165 trillion to refund liquidity support and Rp 54 trillion to refund outlays related to bank guarantees. Combined, these bonds comprise IBRA’s liabilities of Rp 640 trillion in government bonds, Rp 151 trillion of which are fixed rate bonds, Rp 271 trillion variable rate bonds, and Rp 218 trillion inflation indexed bonds (Feridhanusetyawan 2000: 11). In the process of bank restructuring, IBRA had acquired assets with an estimated book value of Rp 470 trillion at the end of July 2000. However, their market value has recently been estimated at 35–40% of the book value (Feridhanusetyawan 2000: 12).
This process has left IBRA and the government with three large problems. First, in the short run, the government has to find a way to pay the interest on the recapitalisation bonds. This will represent a serious fiscal burden over the next few years, as can be seen in the budget presented below. Second, the government will soon have to start paying down the principal on these bonds, some of which begin to mature in 2003, creating a further fiscal burden. Third, IBRA has to dispose of the assets it has acquired. The estimated recovery rate of 35–40% implies that IBRA should be able to raise only about Rp 175 trillion to help alleviate these fiscal burdens.
The process of disposing of the IBRA assets is riddled with political difficulties. First, there are fears that previous owners will just buy back their old assets, which IBRA seized at a considerable discount to book value, with the taxpayer left bear the burden of the losses incurred by these bankers. This could create a strong political reaction against IBRA and the government, even if could be justified on the grounds that previous owners made the best offers for the assets. Second, IBRA and the government are hesitant to sell to foreign buyers, partly because they risk being seen as offering Indonesian assets to foreigners at ‘fire-sale’ prices. This nationalist sentiment is so strong that IBRA cannot ignore it, even if nationalism is costly to the economy. As a result, IBRA has been relatively slow to dispose of the assets it holds. Experience from other countries suggests, however, that the longer IBRA holds them, the lower the recovery rate is likely to be.
Another important aspect of IBRA’s operations concerns the restructuring of corporate debts.12 There are several agencies in addition
debtors outside the court system. It has been more successful in eliciting participation, but the amount of debt worked out through the JI has been limited. In response to slow progress in resolving corporate debt, the FSPC began operation in February 2000. This is an interministerial committee now headed by Coordinating Economics Minister Rizal Ramli; it is charged with developing guidelines for both bank and corporate restructuring, and with overseeing the operations of IBRA and the JI. However, in a statement on 25 September after concluding a consultation with Indonesia, the IMF expressed concern over the slow progress not only of IBRA, but also of the JI and the FSPC (JP, 27/9/00: 5).
Fiscal Developments and Public Sector Debt
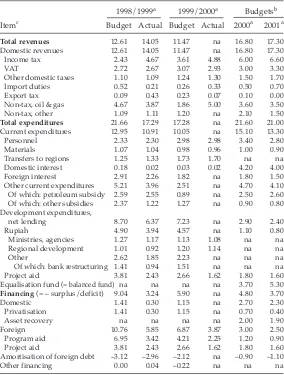
The budget will be extremely tight for the next several years because of the cost of servicing the large public debt incurred in the process of bank restructuring. Table 4 shows that the domestic interest burden will rise from an actual expenditure of only 0.02% of GDP in fiscal 1998/99 and 1999/2000 (April–March) to a projected 4.2% of GDP in fiscal 2000 (March–December), this increase being almost equal to the total increase in budgeted expenditure in this period. The newly announced budget projects that this burden will be similar in 2001 (January–December).13
The burden the domestic debt places on the budget will increase further in 2003, when the government has to start retiring some of the bonds issued. Two important sources of revenue for the government to make up the shortfalls caused by debt servicing are the sale of banking assets held in IBRA and the sale of state-owned corporations, including banks and other firms such as PT Telkom. However, progress on privatisation has been slow, with realised receipts being far below those projected for 1998/99, and probably below the target for 1999/2000 as well. As with problems in the state-owned banks, an important obstacle to the privatisation process is the lack of a political consensus on how, or whether, to proceed.
TABLE 4 Government Revenue and Expenditure Items (% of GDP)
1998/1999a 1999/2000a Budgetsb
Itemc Budget Actual Budget Actual 2000a 2001a
Total revenues 12.61 14.05 11.47 na 16.80 17.30 Domestic revenues 12.61 14.05 11.47 na 16.80 17.30 Income tax 2.43 4.67 3.61 4.88 6.00 6.60 VAT 2.72 2.67 3.07 2.93 3.00 3.30 Other domestic taxes 1.10 1.09 1.24 1.30 1.50 1.70 Import duties 0.52 0.21 0.26 0.33 0.50 0.70 Export tax 0.09 0.43 0.23 0.07 0.10 0.00 Non-tax, oil & gas 4.67 3.87 1.86 5.00 3.60 3.50 Non-tax, other 1.09 1.11 1.20 na 2.10 1.50
Total expenditures 21.66 17.29 17.28 na 21.60 21.00 Current expenditures 12.95 10.91 10.05 na 15.10 13.30 Personnel 2.33 2.30 2.98 2.98 3.40 2.80 Materials 1.07 1.04 0.98 0.96 1.00 0.90 Transfers to regions 1.25 1.33 1.73 1.70 na na Domestic interest 0.18 0.02 0.03 0.02 4.20 4.00 Foreign interest 2.91 2.26 1.82 na 1.80 1.50 Other current expenditures 5.21 3.96 2.51 na 4.70 4.10 Of which: petroleum subsidy 2.59 2.55 0.89 na 2.50 2.60 Of which: other subsidies 2.37 1.22 1.27 na 0.90 0.80 Development expenditures,
net lending 8.70 6.37 7.23 na 2.90 2.40 Rupiah 4.90 3.94 4.57 na 1.10 0.80 Ministries, agencies 1.27 1.17 1.13 1.08 na na Regional development 1.01 0.92 1.20 1.14 na na
Other 2.62 1.85 2.23 na na na
Of which: bank restructuring 1.41 0.94 1.51 na na na Project aid 3.81 2.43 2.66 1.62 1.80 1.60 Equalisation fund (= balanced fund) na na na na 3.70 5.30
Financing (= – surplus/deficit) 9.04 3.24 5.90 na 4.80 3.70 Domestic 1.41 0.30 1.15 na 2.70 2.30 Privatisation 1.41 0.30 1.15 na 0.70 0.40 Asset recovery na na na na 2.00 1.90 Foreign 10.76 5.85 6.87 3.87 3.00 2.50 Program aid 6.95 3.42 4.21 2.25 1.20 0.90 Project aid 3.81 2.43 2.66 1.62 1.80 1.60 Amortisation of foreign debt –3.12 –2.96 –2.12 na –0.90 –1.10 Other financing 0.00 0.04 –0.22 na na na
a1998/1999 and 1999/2000 refer to fiscal years from April to March; 2000 refers to March–
December; from 2001 fiscal and calendar years will coincide.
bThe 2000 budget is the revised budget as of April 2000; the 2001 budget is the
prelimi-nary budget as of 2 October 2000.
cThe items used here correspond to those in Ministry of Finance (2000).
easily argue that the government has been far too conservative, and that the tendency to underspend the budget in 1998/99, for example, was very costly to the economy. The costs include growth lost through failure to stimulate aggregate demand and to maintain aggressive development spending (in a country that still lacks basic physical and educational infrastructure). Of course, the argument that Indonesia should have run larger deficits is based on the assumption that adequate financing could have been found, and that the funds could have been efficiently allocated to the necessary projects—which may have been politically impossible during this period, especially given the problems on the monetary side. There will also be important long-term changes in the budget in coming years. The first will result from implementation of a decentrali-sation plan under which the central government intends to return about one-quarter of its domestic revenues to local governments, a process due to begin in January 2001 (McLeod 2000: 30–8). It is unclear how this will proceed, though the 2001 budget does explicitly account for the change with the newly established equalisation fund, which is projected to grow to 5.3% of GDP in 2001. (For a comment on the impact of efforts by local governments to increase their revenues in the context of fiscal decen-tralisation, see box 3.) A second change stems from the decision to roll back some of the subsidies that the government provides. Political diffi-culties with implementation caused the first increase in fuel prices to be delayed from 1 April 2000 to 1 October. However, this rise has appar-ently been carried out with relatively little public outcry, and another increase of 20% is scheduled to take place in April 2001. The removal of subsidies is desirable both to lessen the burden on the budget and, more importantly, to promote efficient use of resources.
The Balance of Payments and External Debt
Box 3 DECENTRALISATION AND THE RETURN OF THE ‘HIGH COST ECONOMY’
There is increasing evidence to suggest that decentralisation, on its present course, will generate new interregional trade barriers that work to undermine the integrity of the Indonesian economy and nation. This is unfortunate, as to enjoy the efficiency benefits of decentralisation Indonesia must continue to promote and maintain free and open domestic markets.
Perhaps the most significant barrier to internal trade that may arise out of, or be exacerbated by, the decentralisation process is the imposition of taxes, fees, levies, licences and other charges on the movement of agricultural produce. Many of these distortions were eliminated by Law 18/1997—much to the relief of farmers and other small-scale rural producers. Unfortunately this law is now under threat of revision, with amendments currently being considered by the DPR that will give greater flexibility to local governments to generate more revenues from domestic trade and business activities. Some local governments, such as the Lampung provincial government and some district level administrations in North Sumatra, are not waiting for any such amendments and have taken the autonomy initiative by issuing new regulations placing taxes on all commodities transported across provincial and/or district boundaries. Other regional governments are using more creative ways to tax internal trade, such as imposing a requirement upon producers and traders to make a ‘voluntary contribution’ (sumbangan pihak ketiga, third party contribution) based on the amount of the commodity produced or traded. Moreover, as more and more authority to regulate business is devolved to the regions there are signs that many local governments intend to use their business licensing powers to increase local taxation revenue.
With no clause in the constitution banning duties on internal trade and with continuing confusion as to whether domestic trade policy will remain a matter of ‘national concern’, there are growing fears that decentralisation will bring with it a new and more dangerous form of the ‘high cost economy’ that had been a feature of Soeharto’s Indonesia: an economy characterised by multiple and discriminatory taxation regimes in the regions and a plethora of new informal taxes and charges imposed upon traders and producers.
David Ray
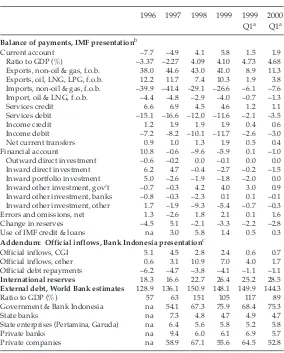
TABLE 5 The Balance of Payments, Exchange Rates, International Reserves, and External Debt Indicators, 1996–2000 ($ billion, unless noted)
1996 1997 1998 1999 1999 2000 Q1a Q1a
Balance of payments, IMF presentationb
Current account –7.7 –4.9 4.1 5.8 1.5 1.9 Ratio to GDP (%) –3.37 –2.27 4.09 4.10 4.73 4.68 Exports, non-oil & gas, f.o.b. 38.0 44.6 43.0 41.0 8.9 11.3 Exports, oil, LNG, LPG, f.o.b. 12.2 11.7 7.4 10.3 1.9 3.8 Imports, non-oil & gas, f.o.b. –39.9 –41.4 –29.1 –26.6 –6.1 –7.6 Import, oil & LNG, f.o.b. –4.4 –4.8 –2.9 –4.0 –0.7 –1.3 Services credit 6.6 6.9 4.5 4.6 1.2 1.1 Services debit –15.1 –16.6 –12.0 –11.6 –2.1 –3.5 Income credit 1.2 1.9 1.9 1.9 0.4 0.6 Income debit –7.2 –8.2 –10.1 –11.7 –2.6 –3.0 Net current transfers 0.9 1.0 1.3 1.9 0.5 0.4 Financial account 10.8 –0.6 –9.6 –5.9 0.1 –1.0 Outward direct investment –0.6 –0.2 0.0 –0.1 0.0 0.0 Inward direct investment 6.2 4.7 –0.4 –2.7 –0.2 –1.5 Inward portfolio investment 5.0 –2.6 –1.9 –1.8 –2.0 0.0 Inward other investment, gov’t –0.7 –0.3 4.2 4.0 3.0 0.9 Inward other investment, banks –0.8 –0.3 –2.3 0.1 0.1 –0.1 Inward other investment, other 1.7 –1.9 –9.3 –5.4 –0.7 –0.3 Errors and omissions, net 1.3 –2.6 1.8 2.1 0.1 1.6 Change in reserves –4.5 5.1 –2.1 –3.3 –2.2 –2.8 Use of IMF credit & loans na 3.0 5.8 1.4 0.5 0.3
Addendum: Official inflows, Bank Indonesia presentationc
Official inflows, CGI 5.1 4.5 2.8 2.4 0.6 0.7 Official inflows, other 0.6 3.1 10.9 7.0 4.0 1.7 Official debt repayments –6.2 –4.7 –3.8 –4.1 –1.1 –1.1
International reserves 18.3 16.6 22.7 26.4 25.2 28.5
External debt, World Bank estimates 128.9 136.1 150.9 148.1 149.9 144.3 Ratio to GDP (%) 57 63 151 105 117 89 Government & Bank Indonesia na 54.1 67.3 75.9 68.4 75.3 State banks na 7.3 4.8 4.7 4.9 4.7 State enterprises (Pertamina, Garuda) na 6.4 5.6 5.8 5.2 5.8 Private banks na 9.4 6.0 6.1 6.9 5.7 Private companies na 58.9 67.1 55.6 64.5 52.8
aQ1 = first quarter.
bIn the balance of payments, positives indicate net receipts or inward capital flows, and
negatives indicate net payments or outward capital flows.
cThe Bank Indonesia presentation differs from the IMF presentation in the way that
services, income and financial flows are recorded; most of the official inflows reported by Bank Indonesia would be part of ‘inward other investment (government)’, but this item also includes IMF credit from 1998 and some items probably recorded as current transfer payments in the IMF presentation.
The turnaround in the external debt position was facilitated in part by the emergence of a large current account surplus, equal to 4.1% of GDP in 1998 and 5.8% in 1999. The most conspicuous element was the collapse in imports from a peak of $46 billion in 1997 to $31–32 billion in 1998–99. Data for the first quarter of 2000 indicate some recovery in imports to $9 billion, compared to $7 billion in the same period in 1999, but the current account surplus was unchanged at 4.7% of GDP, primarily because exports also grew rapidly, from $11 to $15 billion. Thus, the large depreciation of the rupiah (figure 2) and the recession following the crisis have had the predictable effect of turning around the current account. This is despite very large debits on the services and income accounts, both of which remain strongly negative on net. The substantial increase in investment income debits in 1996–99 reflects increased foreign interest payments.
THE INDUSTRIAL STRUCTURE OF PRODUCTION, TRADE AND EMPLOYMENT
It is now three years since the crisis broke and, as the above review of macroeconomic trends suggests, the economy has had to make large adjustments. With the passage of time and the increasing availability of data, it is now possible to examine more closely which industries have benefited from these adjustments, and which have been most adversely affected.
Production
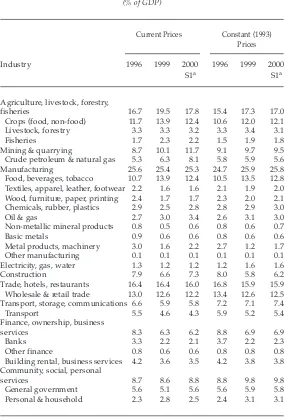
Shares of some industries in real GDP have changed markedly in the last year and more generally through the crisis (table 6). The hardest hit major industries were construction, whose share fell from 8.0% in 1996 to 5.8% in 1999, and finance, ownership and business services (whose share declined from 8.8% to 6.9%). Construction’s share rebounded somewhat in the first half of 2000, but that of finance, ownership and business services remained stagnant. In the latter sector, the fall in banking accounts for most of the decline, which is of similar magnitude whether measured in current or constant prices. In construction, the decline is much smaller in current than in constant prices, reflecting relatively rapid price rises in this sector (table 2). In trade, hotels and restaurants, where the bulk of business is wholesale and retail trade, the share of constant price GDP fell in 1996–99, while the share of current price GDP remained unchanged. In the first half of 2000, this pattern was reversed.
In contrast, shares of real GDP rose in 1996–99 in agriculture (15.4% to 17.3%), manufacturing (24.7% to 25.9%), and community, social and personal services (8.8% to 9.8%) (table 6). Shares of real GDP remained at the 1999 level in the first half of 2000 for manufacturing and community, social and personal services, but fell somewhat in agriculture (to 17.0%).14
In agriculture these changes are even larger when measured in current prices, reflecting the large rise and subsequent decline of prices in that sector (table 2). On the other hand, sectoral deflators were relatively stable in manufacturing and community, social and personal services (compared to the GDP deflator) and shares changed less when measured in current prices.
TABLE 6 Industrial Structure of GDP, 1996–2000 (% of GDP)
Current Prices Constant (1993) Prices
Industry 1996 1999 2000 1996 1999 2000
S1a S1a
Agriculture, livestock, forestry,
fisheries 16.7 19.5 17.8 15.4 17.3 17.0
Crops (food, non-food) 11.7 13.9 12.4 10.6 12.0 12.1
Livestock, forestry 3.3 3.3 3.2 3.3 3.4 3.1
Fisheries 1.7 2.3 2.2 1.5 1.9 1.8
Mining & quarrying 8.7 10.1 11.7 9.1 9.7 9.5 Crude petroleum & natural gas 5.3 6.3 8.1 5.8 5.9 5.6
Manufacturing 25.6 25.4 25.3 24.7 25.9 25.8
Food, beverages, tobacco 10.7 13.9 12.4 10.5 13.5 12.8 Textiles, apparel, leather, footwear 2.2 1.6 1.6 2.1 1.9 2.0 Wood, furniture, paper, printing 2.4 1.7 1.7 2.3 2.0 2.1 Chemicals, rubber, plastics 2.9 2.5 2.8 2.8 2.9 3.0
Oil & gas 2.7 3.0 3.4 2.6 3.1 3.0
Non-metallic mineral products 0.8 0.5 0.6 0.8 0.6 0.7
Basic metals 0.9 0.6 0.6 0.8 0.6 0.6
Metal products, machinery 3.0 1.6 2.2 2.7 1.2 1.7
Other manufacturing 0.1 0.1 0.1 0.1 0.1 0.1
Electricity, gas, water 1.3 1.2 1.2 1.2 1.6 1.6
Construction 7.9 6.6 7.3 8.0 5.8 6.2
Trade, hotels, restaurants 16.4 16.4 16.0 16.8 15.9 15.9 Wholesale & retail trade 13.0 12.6 12.2 13.4 12.6 12.5 Transport, storage, communications 6.6 5.9 5.8 7.2 7.1 7.4
Transport 5.5 4.6 4.3 5.9 5.2 5.4
Finance, ownership, business
services 8.3 6.3 6.2 8.8 6.9 6.9
Banks 3.3 2.2 2.1 3.7 2.2 2.3
Other finance 0.8 0.6 0.6 0.8 0.8 0.8
Building rental, business services 4.2 3.6 3.5 4.2 3.8 3.8 Community, social, personal
services 8.7 8.6 8.8 8.8 9.8 9.8
General government 5.6 5.1 5.6 5.6 5.9 5.8
Personal & household 2.3 2.8 2.5 2.4 3.1 3.1
aS1 = first half.
its share of real GDP rose sharply in 1996–99 (10.5% to 13.5%), but then fell significantly in the first half of 2000 (to 12.8%). Another manufacturing industry that experienced relatively large changes was metal products and machinery, whose share of real GDP fell from 2.7% in 1996 to 1.2% in 1999, but then rebounded sharply to 1.7% in the first half of 2000. However, the export and industrial survey data presented below indicate that the composition of this industry has changed markedly. Moreover, the rebound in its share of GDP in the first half of 2000, and the increasing real GDP shares of some of Indonesia’s traditional export industries (e.g. crops, food, beverages and tobacco, and oil and gas manufacturing) in 1996–99, appear to be related to the growth of export industries after the large depreciation in 1997–98.
Merchandise Trade
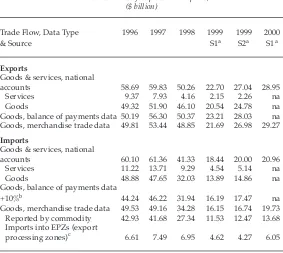
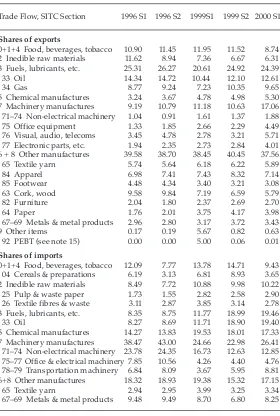
The dollar value of merchandise exports as estimated in the trade data was $29 billion in the first half of 2000, 35% higher than in the same period in 1999 (table 7). There is some indication that this rapid pace of growth may be slowing, with exports only 24% higher in July–August 2000 than in the same months in 1999 (BI, IFS, various issues). Perhaps more impressive than the growth of export values has been the dramatic shift in export structure.
Food, beverages and tobacco is a traditional Indonesian export industry, and its share of exports in dollars remained constant at about 11–12% in the second half of 1996 and the second half of 1999 (table 8).15
but the share of machinery rose to high levels, from 9% in the first half of 1996 and 11% in the second half of 1996 and 1999, to 17% in the first half of 2000. Within the machinery category, exports are concentrated in office equipment, visual, audio and telecommunications equipment, and various electronic parts, and shares of all of these items grew rapidly.
The machinery story is interesting because exports in this industry are generally dominated by foreign MNCs, not only in Indonesia but also in other Southeast Asian economies such as Singapore and Thailand.16
TABLE 7 Various Estimates of Exports and Imports, 1996–2000 ($ billion)
Trade Flow, Data Type 1996 1997 1998 1999 1999 2000
& Source S1a S2a S1a
Exports
Goods & services, national
accounts 58.69 59.83 50.26 22.70 27.04 28.95
Services 9.37 7.93 4.16 2.15 2.26 na
Goods 49.32 51.90 46.10 20.54 24.78 na
Goods, balance of payments data 50.19 56.30 50.37 23.21 28.03 na Goods, merchandise trade data 49.81 53.44 48.85 21.69 26.98 29.27
Imports
Goods & services, national
accounts 60.10 61.36 41.33 18.44 20.00 20.96
Services 11.22 13.71 9.29 4.54 5.14 na
Goods 48.88 47.65 32.03 13.89 14.86 na
Goods, balance of payments data
+10%b 44.24 46.22 31.94 16.19 17.47 na
Goods, merchandise trade data 49.53 49.16 34.28 16.15 16.74 19.73 Reported by commodity 42.93 41.68 27.34 11.53 12.47 13.68 Imports into EPZs (export
processing zones)c 6.61 7.49 6.95 4.62 4.27 6.05
aSee table 2, note a.
bIn the balance of payments, imports are measured on an f.o.b. basis, whereas
they are measured on a c.i.f. basis in the trade data. The c.i.f./f.o.b. ratio is esti-mated at 1.1.
cThis portion of imports is not available by commodity: e.g. data by SITC
TABLE 8 Shares of Exports and Imports by SITC Section, 1996–2000a
(%)
Trade Flow, SITC Section 1996 S1 1996 S2 1999S1 1999 S2 2000 S1
Shares of exports
0+1+4 Food, beverages, tobacco 10.90 11.45 11.95 11.52 8.74 2 Inedible raw materials 11.62 8.94 7.36 6.67 6.31 3 Fuels, lubricants, etc. 25.31 26.27 20.61 24.92 24.39
33 Oil 14.34 14.72 10.44 12.10 12.61
34 Gas 8.77 9.24 7.23 10.35 9.65
5 Chemical manufactures 3.24 3.67 4.78 4.98 5.30 7 Machinery manufactures 9.19 10.79 11.18 10.63 17.06 71–74 Non-electrical machinery 1.04 0.91 1.61 1.37 1.88 75 Office equipment 1.33 1.85 2.66 2.29 4.49 76 Visual, audio, telecoms 3.45 4.78 2.78 3.21 5.71 77 Electronic parts, etc. 1.94 2.35 2.73 2.84 4.01 6 + 8 Other manufactures 39.58 38.70 38.45 40.45 37.56
65 Textile yarn 5.74 5.64 6.18 6.22 5.89
84 Apparel 6.98 7.41 7.43 8.32 7.14
85 Footwear 4.48 4.34 3.40 3.21 3.08
63 Cork, wood 9.58 9.84 7.19 6.59 5.79
82 Furniture 2.04 1.80 2.37 2.69 2.70
64 Paper 1.76 2.01 3.75 4.17 3.98
67–69 Metals & metal products 2.96 2.80 3.17 3.72 3.43
9 Other items 0.17 0.19 5.67 0.82 0.63
92 PEBT (see note 15) 0.00 0.00 5.00 0.06 0.01
Shares of imports
0+1+4 Food, beverages, tobacco 12.09 7.77 13.78 14.71 9.43 04 Cereals & preparations 6.19 3.13 6.81 8.93 3.65 2 Inedible raw materials 8.49 7.72 10.88 9.98 10.22 25 Pulp & waste paper 1.73 1.55 2.82 2.58 2.90 26 Textile fibres & waste 3.11 2.87 3.85 3.14 2.78 3 Fuels, lubricants, etc. 8.35 8.75 11.77 18.99 19.46
33 Oil 8.27 8.69 11.71 18.90 19.40
5 Chemical manufactures 14.27 13.83 19.53 18.01 17.33 7 Machinery manufactures 38.47 43.00 24.66 22.98 26.41 71–74 Non-electrical machinery 23.78 24.35 16.73 12.63 12.85 75–77 Office & electrical machinery 7.85 10.56 4.26 4.40 4.76 78–79 Transportation machinery 6.84 8.09 3.67 5.95 8.81 6+8 Other manufactures 18.32 18.93 19.38 15.32 17.15
65 Textile yarn 2.94 2.95 3.99 3.25 3.34
67–69 Metals & metal products 9.48 9.49 8.70 6.80 8.25
aSee table 2, note a.
Moreover, as James and Ramstetter (1997) and Pangestu (1997) highlight, before the crisis Indonesia’s electrical and electronic machinery industry had yet to become very large, though there were signs that foreign, particularly Japanese, MNCs were beginning to expand their facilities in the country. The export figures in table 7 suggest very strongly that Indonesia is now being integrated into the regional network on a much larger scale than before. This impression is further underlined by the fact that the major three-digit SITC items involved appear to come from labour-intensive assembly operations, including a large number of parts that are likely to be used elsewhere in the region.17
As indicated in box 4, it is difficult to interpret changes in the structure of imports, primarily because it is impossible to know the structure of the increasingly large share of imports through export processing zones (EPZs). Nonetheless, along with the collapse of imports in 1998 and 1999 (valued in dollars), the decline in the share of the largest import category, machinery, is conspicuous. Machinery shares of imports reported by commodity fell from over 40% in the second half of 1996 and the first half of 1997 to as low as 23% in the second half of 1999, the largest component of this category being non-electrical machinery (table 8). To the extent that the rise in EPZ imports is comprised of machinery, the decline is overstated by these data, but it is nevertheless clear that firms greatly reduced their imports of machinery after the crisis. In contrast, the share of machinery began to increase again in the first half of 2000 compared to 1999, reflecting the recovery in fixed investment described above. Shares of chemicals and other manufactures were more stable during this period, while the share of mineral fuels rose markedly in 1999 and the first half of 2000, largely reflecting higher oil prices. The share of raw materials also increased somewhat between 1996 and 1999– 2000 S1, while the share of food fluctuated.
Employment
Employment structure has changed less than the structures of production and trade, if 1996 is compared with 1999 (tables 6, 9). For example, manufacturing’s share of GDP increased by 1.2 percentage points or 5% over this period, while the corresponding change in share of employment was 0.4 percentage points or 3%. The construction share of GDP changed by –2.2 percentage points or –28%, while the
Box 4 PROBLEMS IN THE TRADE DATA
TABLE 9 Employment and Unemployment Indicators and Shares of Employment by Industry, 1996–99
1996 1997 1998 1999
Employment and open unemployment
Total employment (‘000) 85,702 85,406 87,672 88,817 Open unemployment (‘000) 4,408 4,197 5,062 6,030 Open unemployment rate (%) 4.89 4.68 5.46 6.36
Shares of total employment by main industry (%)
Agriculture, livestock, forestry, fisheries 44.0 40.7 45.0 43.2
Mining & quarrying 0.9 1.0 0.8 0.8
Manufacturing 12.6 12.9 11.3 13.0
Electricity, gas, water 0.2 0.3 0.2 0.2
Construction 4.4 4.9 4.0 3.8
Trade, hotels, restaurants 18.8 19.9 19.2 19.7 Transport, storage, communications 4.6 4.8 4.7 4.7 Finance, ownership, business services 0.8 0.8 0.7 0.7 Community, social, personal services 13.7 14.7 14.1 13.8
Mean weekly real wages of production workers (manufacturing in 1996 = 100)a
Mining 331 224 231 291
Manufacturing 100 106 73 88
Food, beverages, tobacco 81 83 59 65
Textiles, apparel, leather, footwear 94 101 67 92
Wood, furniture 106 119 81 96
Paper, printing 138 129 90 108
Chemicals 111 110 75 100
Non-metallic mineral products 96 105 67 72
Basic metals 178 161 122 137
Metal products & machinery 116 130 102 105
Other manufacturing 77 80 54 57
Hotels 113 110 81 88
aData refer to mean weekly wages of production workers below the supervisor
level in December of the year listed, deflated by the consumer price index.
corresponding employment figures were only –0.6 percentage points and –14%. In finance, ownership and business services, the change in terms of GDP was –1.9 percentage points or –22%, and in terms of employment –0.1 percentage points or –13%. The same pattern was observed in community, social and personal services, where the GDP share changed by 1.0 percentage point or 11% but the employment share changed by only 0.1 percentage points or 1%.
Nonetheless there were important changes in the structure of employment (and production) between 1996 and 1999 (table 9). As emphasised by Manning (2000), this is particularly the case in agriculture, where the share of total employment first fell from 44% in 1996 to 41% in 1997, then rebounded to 45% in 1998, and fell back to 43% in 1999. Another important change was the fall in manufacturing’s share of employment to 11% in 1998 from 13% in 1996–97, and its subsequent rebound to 13% in 1999. There was also a relatively large fall in construction, from 5% in 1997 to 4% in 1998–99.
Changes in real mean weekly wages were negative between 1996 and 1998 in all industries for which data are available (table 9). In 1996–98, the largest declines were concentrated in manufacturing, specifically in paper and printing (34%), chemicals (33%), and basic metals and other manufacturing (31% each). The smallest declines were in metal products and machinery (12%) and wood products and furniture (24%). In 1998– 99, the strongest rebound was in the textiles category (37%), chemicals (34%), and mining (26%), while increases were smallest (10% or less) in metal products and machinery, followed by other manufacturing, hotels, and food, beverages and tobacco. Even though the increases in 1998–99 were sometimes larger than the declines in 1996–98, as of December 1999 the recovery had yet to pull wages back to their pre-crisis levels in any industry listed.
THE INVESTMENT ENVIRONMENT AND THE REACTION OF FOREIGN INVESTORS
Is the Recovery of Fixed Investment Sustainable?
The increase in the share of fixed investment in real GDP, from 19% in the first half of 1999 to 22% in the first half of 2000 (table 1), reflects the first rise in real fixed investment since the third quarter of 1997 (figure 3). In the second, third and fourth quarters of 1998, fixed investment declined by 37–42% in each quarter, compared with the same quarter of 1997. In the first quarter of 1998 and the first three quarters of 1999, these growth rates were –21% to –29%. The large negative growth began to abate in the fourth quarter of 1999, and in the first two quarters of 2000 fixed investment expanded rapidly, by 17% and 25%, respectively, compared to the same quarters of 1999. While the level of fixed investment is still far below that reached in the mid 1990s in real terms or as a percentage of GDP, the downturn does appear to have been arrested, with a robust recovery in the first half of 2000. There is still a general perception, however, that investors are not keen to invest in Indonesia just yet, and that the recovery of 2000 may not last long. Trends in share prices reflect this pessimism: after rising for four consecutive quarters, their rate of increase turned negative in the second and third quarters of 2000, declining by 22% and 26%, respectively, compared to the same quarters of 1999.
Although the continued low level of foreign portfolio investment has an important influence on share prices, and FDI by foreign MNCs often attracts the attention of the government and the press, most fixed investment is undertaken by domestic firms. Even at their peak in 1996, inward FDI flows amounted to only 9% of total fixed investment flows in Indonesia (IMF 2000; World Bank 2000a). More importantly, if cumulated from 1983, FDI amounted to only 4% of fixed investment through 1999, and only 5% through 1996, 1997 or 1998, when this ratio reached its peak. Foreign portfolio investment was even smaller than FDI. Moreover, these ratios overstate the importance of FDI and foreign portfolio investment as a source of finance for fixed investment in Indonesia, because only a portion of the flows is used to finance fixed investment, the rest being used to offset other asset or liability changes on corporate balance sheets. In any case, the low level of this ratio shows that domestic investors are the key to the recovery of fixed investment.
realised domestic investment, like the figures on share prices, are only indicative of investor sentiment, and not a comprehensive measure of domestic investment.18 Moreover, when using Board of Investment data
one must be careful to distinguish between approved and realised investment, because the bulk of approved investment is never realised. Data on realised investment are only published on a stock basis (cumulative investment from 1968 forward) and figures are compiled on a gross (not net) basis at historical prices (i.e. book values or prices at the time the investment was realised). Despite these data limitations, it is interesting that trends in realised domestic investment tell very much the same story as do trends in share prices. For example, before the crisis the stock of realised domestic investment increased markedly from Rp 133 trillion in June 1996 to Rp 201 trillion in June 1997 (Investment Coordinating Board, Monthly Investment Report, various issues; Board of Investment and State-Owned Enterprise Development 2000). During the
FIGURE 3 Growth of Real Fixed Investment and Share Price Movementsa (%)
aGrowth rates refer to growth over the corresponding quarter of the previous year.
Sources: BI, IFS (various issues); BPS (2000a, 2000c); World Bank (2000a).
-50 -25 0 25 50 75 100
1995 Q1
1996 Q3
1998 Q1
1999 Q3
crisis, however, investment stagnated from December 1997 through June 1999, when the stock was Rp 210–215 trillion. It increased rapidly in the latter half of 1999, to Rp 306 trillion in December, with most of the Rp 90 trillion in new investment being in fisheries (Rp 48 trillion) and chemicals (Rp 18 trillion). The stock then stagnated again in the first half of 2000, increasing by only Rp 1 trillion to Rp 307 trillion in June. Trends in approved domestic investment were very different from those in realised domestic investment, as illustrated by large fluctuations in the ratio of realised-to-approved domestic investment.19
There is thus conflicting evidence about the sentiment of domestic investors, whose increased willingness to invest is crucial to sustaining the recovery in fixed investment observed in the first half of 2000. Nonetheless, if, as many observers expect, the economy continues to grow at 4–5% for the rest of 2000 and 2001, it is difficult to see how domestic firms will be able to continue to hold back on investment plans as capacity limits become increasingly binding and inventories are drawn down.
Foreign Direct Investment
Although FDI accounts for a relatively small proportion of fixed investment, MNCs do play an important role in some industries such as oil and gas, finance, and a number of manufacturing industries. In this context, the fact that inward FDI has continued to register large net outflows through the first quarter of 2000 (indicating that foreign MNCs have been repatriating more equity and intercompany debt than they have been bringing in) is an important reflection of negative sentiment among the firms that undertake this investment.20 With one exception,
the second quarter of 1998, net FDI flows have been negative since the fourth quarter of 1997, suggesting that the immediate reaction of foreign MNCs was to divest from Indonesia on net, and that this reaction has yet to be reversed. This is in marked contrast to what happened in Korea and Thailand, for example, where foreign MNCs poured in record levels of FDI during and immediately after the crisis in 1997–99 (Ramstetter 2000: table 1).
TABLE 10 Stock of Realised Foreign Direct Investment Registered with the Board of Investment, by Industry and Major Source, 1997–2000a
($ billion)
1997 1997 1998 1999 1999 2000 S1b S2b S1b S1b S2b S1b
By industry
All industries 51.73 56.22 58.25 59.43 66.75 70.48
(ratio to approved, %) 28 28 27 27 29 31
Primary 4.11 5.39 5.48 5.59 8.71 10.64
Agriculture, forestry 1.35 1.44 1.48 1.53 2.53 3.03
Fisheries 0.17 0.17 0.21 0.28 1.66 3.03
Mining 2.59 3.77 3.78 3.78 4.52 4.59
Manufacturing 35.73 37.30 39.13 40.18 43.44 45.22
Food 1.82 1.91 2.01 2.03 2.07 2.07
Textiles 2.85 2.92 2.94 2.99 3.01 3.01
Paper 7.09 7.11 7.13 7.13 7.77 7.77
Chemicals 12.58 13.16 14.35 14.76 15.93 15.98 Non-metallic mineral products 1.99 2.19 2.31 2.36 2.70 2.70
Basic metals 3.64 3.70 3.78 4.10 4.37 4.37
Metal products & machinery 5.08 5.59 5.90 6.03 6.63 8.35
Tertiary 11.88 13.53 13.64 13.65 14.60 14.61
Electricity, gas, & water 2.61 2.66 2.66 2.66 2.69 2.69 Trade, hotels, restaurants 4.57 4.64 4.68 4.68 4.91 4.91 Office buildings, real estate 2.49 2.96 2.96 2.96 3.05 3.05
By major source economy
Japan 8.98 9.69 10.25 10.92 12.12 12.37
Hong Kong 6.53 6.56 6.59 6.60 6.66 7.16
United Kingdom 4.82 5.20 5.93 6.09 6.13 6.43
Taiwan 3.40 3.41 3.42 3.44 4.77 4.97
Korea 3.03 3.14 3.18 3.21 3.88 4.75
Singapore 3.00 3.59 3.63 3.71 4.52 4.52
United States 2.54 3.42 3.53 3.57 3.70 3.83
Malaysia 0.34 0.37 0.38 0.40 2.71 2.73
Other & joint countries 19.09 20.84 21.34 21.50 22.25 23.72
aData refer to the sum of equity and loans, excluding investments in oil and
finance from 1967 forward.
bS1 = end of first half (15 June), S2 = end of second half (15 December).
rose to $67 billion by December 1999 and to $70 billion in June 2000. In 1999 and the first half of 2000, increases in approved FDI tended to be smaller than those in realised FDI, and the ratio of the realised total to the approved total rose from 27% in June 1999 to 31% in June 2000. In this period, the largest increases were in fisheries ($2.8 billion), metal products and machinery ($2.3 billion), agriculture and forestry ($1.5 billion) and chemicals ($1.2 billion). In June 2000, the largest industries for FDI were chemicals ($16 billion), metal products and machinery and paper ($8 billion each), and mining and trade, hotels and restaurants ($5 billion each). The large investments observed in fisheries and in agriculture and forestry in the year ending June 2000 are somewhat atypical for MNCs. On the other hand, chemicals and machinery are typically industries where MNCs account for a substantial share of economic activity in Indonesia and elsewhere (Lipsey, Blomström and Ramstetter 1998).
By country, the largest increases in the year ending June 2000 came from Malaysia ($2.3 billion), and then Korea, Taiwan and Japan ($1.5 billion each). There was also a significant rise in the category ‘other and joint countries’ ($2.2 billion). The latter was the largest category in stock terms in June 2000 ($24 billion), partly because FDI is recorded by country of origin, not by country of owner, and investments by foreign MNCs often come not only from the parent company in the home country (e.g. the Japanese parent), but also from affiliates in other countries (e.g. an affiliate of the Japanese parent in Singapore).21 Of the individual countries
listed, Japan is the largest ($12 billion), followed by Hong Kong ($7 billion), the United Kingdom ($6 billion), and then Taiwan, Korea and Singapore ($5 billion each). Investments from Hong Kong and Singapore would be much smaller if FDI were classified by country of owner (Low, Ramstetter and Yeung 1998).
Foreign MNCs in Manufacturing through 1998
Trends in FDI can tell us something about sentiment among foreign investors—namely, whether they believe investments of equity and loan capital will become profitable in the future—but are often poorly correlated with trends in indicators of real economic activity (e.g. employment, production and trade) in the MNCs themselves (Ramstetter 2000: tables 16–17). BPS has recently published its industrial statistics for 1998, and using this data set it is now possible to get a much more precise idea of how foreign MNCs in manufacturing reacted in this crisis year. In a recent paper, Takii and Ramstetter (2000) examined in detail trends in the shares of MNCs, their relative size, and relative productivity. They found that, contrary to the impression given by negative net inward FDI in the balance of payments (table 5) or by stagnant realised FDI through the Board of Investment (table 10), foreign MNCs were not reducing their presence in Indonesian manufacturing; indeed, those with large foreign ownership shares in particular were greatly increasing it.
This can be seen from the data in table 11, which show the shares of manufacturing employment in medium or large plants (20 or more workers) for three foreign ownership groups: minority-foreign plants (those with 10–50% foreign ownership), majority-foreign plants (51–89%), and heavily foreign plants (90% or more). The combined total for these three groups in all manufacturing increased from 18.5% in 1996 to 19.4% in 1997 and 19.1% in 1998 (see also Takii and Ramstetter, 2000: tables 1a, 1b, 1c). If these shares are measured in terms of value added there was a more pronounced increase, from 29.2% in 1996 to 33.9% in 1997, and 35.0% in 1998 (Takii and Ramstetter, 2000: tables 2a, 2b, 2c).22 Thus, the shares
TABLE 11 Shares of Employment for Manufacturing Establishments, Backcast Estimates, 1996–98a
(% of total in each industry)
Minority- Majority- Heavily Total foreign foreign foreign
Industry 1996 1998 1996 1998 1996 1998 1996 1998
All manufacturing 5.56 4.56 7.06 6.03 5.87 8.54 18.49 19.12 Food 5.48 3.90 2.90 3.68 1.78 2.37 10.15 9.96 Beverages 5.82 3.93 1.78 2.93 7.95 7.14 15.56 14.01 Tobacco 0.00 0.00 0.30 0.31 0.98 1.03 1.28 1.34 Textiles 3.07 2.03 7.15 4.93 3.67 5.98 13.88 12.93 Apparel 6.84 5.83 4.32 3.76 11.81 12.82 22.97 22.41 Leather 2.15 4.72 6.53 15.35 5.65 16.25 14.33 36.32 Footwear 10.33 8.79 22.84 17.05 13.16 18.55 46.33 44.39 Wood 4.34 2.51 3.12 4.51 1.58 2.16 9.04 9.18 Furniture 1.40 2.24 1.57 0.83 3.00 3.13 5.97 6.20 Paper 14.43 15.01 2.77 6.03 4.65 2.01 21.86 23.05 Printing, publishing 1.73 1.37 2.86 0.00 0.00 0.32 4.59 1.70 Industrial chemicals 6.21 5.69 10.65 9.47 3.95 7.99 20.82 23.16 Other chemicals 7.46 5.03 10.62 9.49 3.35 7.94 21.43 22.47 Oil refineries & gas 0.00 0.00 0.00 0.00 0.00 50.86 0.00 50.86 Other oil & coal 3.61 0.96 0.79 15.11 20.79 8.78 25.20 24.85 Rubber 3.90 6.72 5.94 4.63 5.61 4.22 15.44 15.57 Plastics 3.50 2.56 3.53 2.69 3.00 6.12 10.03 11.37 Porcelain 9.91 8.78 7.12 8.95 0.00 0.88 17.03 18.61 Glass 22.63 8.08 1.50 7.55 0.29 0.00 24.41 15.63 Cement 8.84 7.05 2.43 2.80 0.06 2.71 11.33 12.56 Clay 2.02 4.82 0.51 3.25 0.00 0.00 2.53 8.06 Other non-metallic
mineral products 0.00 0.56 2.56 3.23 1.00 0.97 3.56 4.76 Iron, steel 4.03 7.35 8.83 6.05 2.18 3.33 15.04 16.73 Non-ferrous metals 5.17 1.48 23.85 28.52 8.93 11.29 37.95 41.29 Metal products 7.83 3.70 11.88 9.41 4.22 9.77 23.94 22.88 Non-electrical machinery 6.53 7.68 10.52 12.27 5.65 16.15 22.70 36.11 Electrical machinery 7.95 6.45 16.61 13.96 30.64 44.63 55.21 65.04 Transport machinery 9.60 10.88 12.07 7.70 3.68 10.06 25.36 28.63 Precision machinery 2.37 3.08 19.92 9.31 22.32 32.39 44.61 44.78 Miscellaneous 7.64 4.46 12.26 10.67 19.97 27.04 39.88 42.17
aEstimates from the backcast data set are used because it includes estimates for
non-reporting plants, and corrections not included in the original raw data sets from which published data are drawn. See the source for details on the differences between these data sets. Minority-foreign plants are plants with foreign ownership shares of 10–50%, majority-foreign plants have shares of 51–89%, and heavily foreign plants have shares of 90% or more.